

What is the Green Ammonia Market Size?
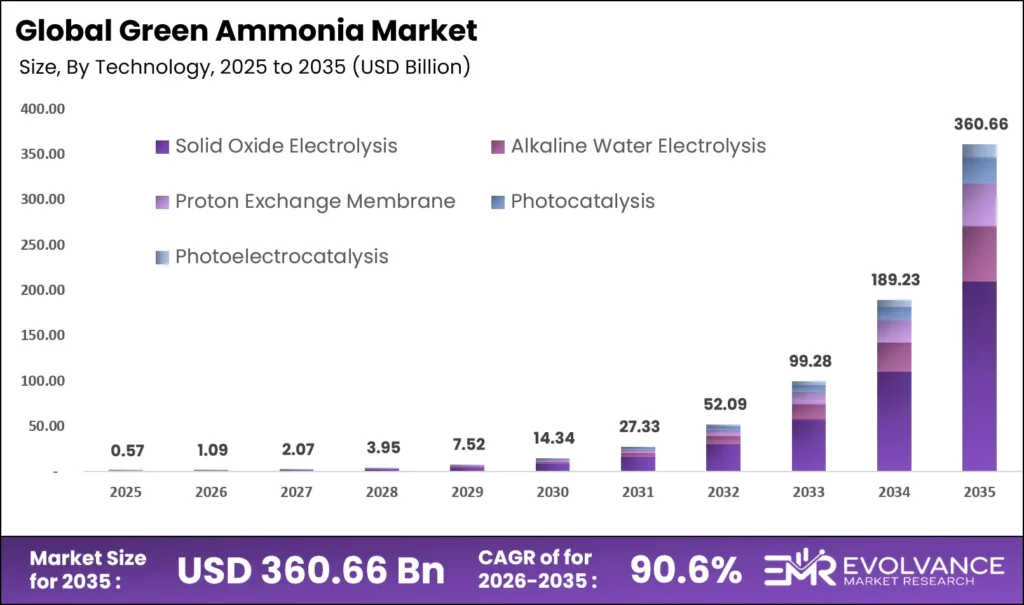
The Global Green Ammonia Market size will be worth around USD 360.66 Billion by 2035 from USD 0.57 Billion in 2025, growing at a CAGR of 90.6% during the forecast period 2026 to 2035. Stringent global carbon taxes compel heavy industry producers to replace gray ammonia with zero-carbon alternatives fast. Major maritime firms lock in long-term off-take deals to secure clean fuel ahead of imminent supply deficits. High capital costs for early-stage electrolyzer facilities delay final investment decisions across strict western regulatory markets.
Market Highlights
- The market will expand from USD 0.57 billion in 2025 to USD 360.66 billion by 2035, growing at a massive 90.6% CAGR.
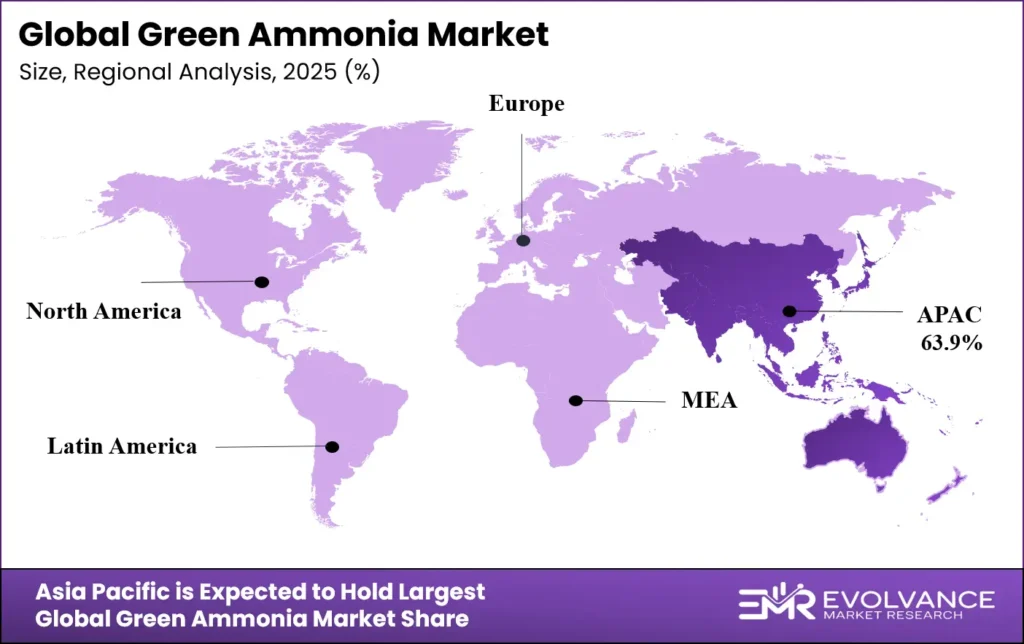
- Asia Pacific dominates the global market, holding a 63.9% share valued at USD 0.36 billion in 2025.
- Solid Oxide Electrolysis leads with a 62.3% share due to its ability to lower electricity use by utilizing waste heat.
- Renewable-powered Haber-Bosch controls 71.7% of the market, allowing producers to adapt a trusted, mature process.
- Dinitrogen-based extraction holds a 58.2% share, offering predictable operating costs by pulling raw material straight from the air.
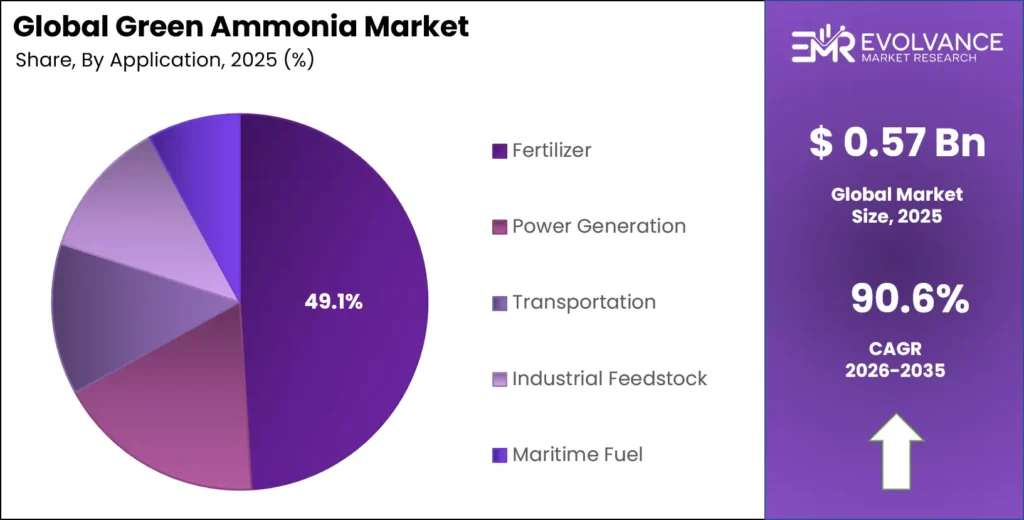
- Fertilizers account for a 49.1% share, heavily driven by global food security needs and corporate decarbonization mandates.
Market Overview
Green ammonia involves fusing nitrogen with clean hydrogen using zero-carbon power. This specific process removes fossil fuels from traditional fertilizer production. Industrial buyers use this chemical as a core raw material. Energy firms also view the product as a dense carrier for hydrogen transport. Buyers need stable supply chains to replace dirty carbon inputs. Current global infrastructure relies heavily on natural gas feeds. Transitioning to zero-carbon inputs requires massive capital upgrades. Consequently, producers focus on scaling solar arrays near deep-water ports to serve global trade routes directly.
According to the IEA, global ammonia sustains a 190 million tonne baseload demand. Furthermore, conventional methods consume 2.0% of total energy and create 1.3% of global carbon emissions. These severe figures prove heavy industries must overhaul basic supply chains to meet strict climate targets. Saudi Arabia advances the NEOM Green Hydrogen mega-plant to convert nitrogen into 1.2 million tonnes of clean fuel yearly. This massive capacity targets European industrial buyers directly. Early-mover mega-projects establish global pricing models and test the real-world scale of clean supply chains.
Governments push aggressive mandates to lower carbon outputs globally. Heavy state subsidies lower the high cost of new plant builds. Therefore, massive corporate joint ventures form to share financial risks. Developers target locations with cheap renewable power and easy access to shipping lanes to maximize margins.
Green Ammonia Market Segmentation Insights
Technology Insights
Solid Oxide Electrolysis dominates with 62.3% due to higher electrical efficiency.
In 2025, Solid Oxide Electrolysis held a dominant market position in the By Technology segment of the Green Ammonia Market, with a 62.3% share. This system requires less electricity by using waste heat. Topsoe opened Europe’s largest manufacturing site in Denmark with 500 MW initial capacity. This scale lowers core equipment costs for developers.
Alkaline Water Electrolysis offers proven durability for huge export projects. The NEOM plant installs 2 GW of these systems. Mature supply chains make this hardware cheaper to buy. Plant operators prefer this choice when capital budgets are tight and grid power remains unstable.
Proton Exchange Membrane handles variable power inputs from wind grids perfectly. The quick start times match changing weather conditions exactly. Therefore, off-grid developers select this system to maximize Ammonia As Marine Fuel output without constant grid backup. High iridium costs currently limit broader global market adoption.
Photocatalysis remains in early lab testing phases worldwide. This method uses direct sunlight to trigger chemical reactions without heavy grid power. Startups focus on this path to cut electricity bills entirely. Commercial rollout requires major breakthroughs in material science to match current industrial volumes.
Photoelectrocatalysis combines light and small electric charges to split water. This path lowers the total power needed for hydrogen creation. Niche tech firms test small modules for local farming needs. Large chemical firms monitor these early tests for future cost-saving farm uses.
Production Method Insights
Haber-Bosch (Renewable-Powered) dominates with 71.7% due to existing infrastructure compatibility.
In 2025, Haber-Bosch (Renewable-Powered) held a dominant market position in the By Production Method segment of the Green Ammonia Market, with a 71.7% share. The IEA reports announced low-emissions fertilizer projects reached 19 million tonnes. Producers trust this mature process, adapting it by simply swapping natural gas for clean hydrogen feeds.
Haber-Bosch with Carbon Capture (Blue Ammonia) provides a fast transition step for legacy plants. Operators trap waste gases instead of changing core systems. This path lets major producers meet short-term climate goals cheaply. Long-term use depends strictly on local carbon storage site rules.
Feedstock Insights
Dinitrogen-Based dominates with 58.2% due to pure atmospheric availability.
In 2025, Dinitrogen-Based held a dominant market position in the By Feedstock segment of the Green Ammonia Market, with a 58.2% share. Firms extract this raw material straight from the air. Envision Energy operates a 320,000 tonne off-grid plant using this clear supply line. Free atmospheric access keeps operating costs highly predictable.
Nitrate-Based inputs serve specialized regional agricultural markets perfectly. Local supply chains collect these materials from natural deposits or waste streams. Processing these inputs requires less intense heat than pure nitrogen separation. Smaller community farms rely on these specific blends for better soil health.
Organic Nitrogen-Based options recycle farm waste into usable fertilizer blocks. This circular loop appeals strongly to eco-focused brands. However, collecting raw waste at a massive scale remains costly. Only regional plants near huge cattle or poultry farms find this exact method profitable.
Application Insights
Fertilizer dominates with 49.1% due to massive captive farming demand.
In 2025, Fertilizer held a dominant market position in the By Application segment of the Green Ammonia Market, with a 49.1% share. Global food security relies totally on nitrogen inputs. Yara agreed to supply PepsiCo with 165,000 tons of low-carbon crop food. Food brands push suppliers to clean their chains.
Power Generation uses the chemical to co-fire coal plants. Europe maintains 96 gas-fired projects featuring 44.6 GW of capacity built for clean fuel burning. Utilities burn this liquid to cut grid emissions quickly. This buys crucial time while nations build more wind arrays.
Transportation tests the fuel for heavy land fleets. Mining trucks and rail lines need more power than standard batteries hold. Engine makers design new blocks to burn the liquid directly. Wide adoption waits for regional fuel stops to build new storage tanks.
Industrial Feedstock supplies makers of plastics and explosives. Chemical hubs must replace dirty inputs to avoid stiff carbon taxes. Clean versions cost more today but prevent future legal fines. Major industrial parks build shared pipes to split the heavy import delivery costs.
Maritime Fuel replaces heavy bunker oil in global shipping. NYK runs the world’s first commercial ammonia-powered tugboat. Cargo firms face strict international emission caps now. Port authorities scramble to fund massive coastal storage tanks to fuel these new zero-carbon green ships.
Market Segments Covered in the Report
By Technology
- Solid Oxide Electrolysis
- Alkaline Water Electrolysis
- Proton Exchange Membrane
- Photocatalysis
- Photoelectrocatalysis
By Production Method
- Haber-Bosch (Renewable-Powered)
- Haber-Bosch with Carbon Capture (Blue Ammonia)
By Feedstock
- Dinitrogen-Based
- Nitrate-Based
- Organic Nitrogen-Based
By Application
- Fertilizer
- Power Generation
- Transportation
- Industrial Feedstock
- Maritime Fuel
Regional Insights
Asia Pacific Dominates the Green Ammonia Market with a Market Share of 63.9%, Valued at USD 0.36 Billion
Asia Pacific leads due to massive chemical demand and active state policies. China added 4.9 GW of electrolyzer capacity to support regional clean energy plans. Japan mandates fuel co-firing to lower import reliance on pure fossil gas. Strong state funding shields early builders from high financial risks.
North America Market Trends
North America leverages cheap land and massive wind potential. The US grants heavy tax credits to lower clean hydrogen costs per kilo. CF Industries plans large capture sites to build blue and green volumes. This region aims to export excess fuel to strict European buyer markets.
Europe Market Trends
Europe creates strict rules forcing industries to buy clean fuels. The EU Innovation Fund grants massive cash blocks, like EUR 200 million for Fortescue, to jumpstart local builds. High local carbon prices make green fuel imports highly competitive against heavily taxed domestic dirty fuels.
Middle East & Africa Market Trends
The Middle East uses vast solar arrays to dominate export markets. Saudi Arabia targets 2.9 million tonnes of clean fuel by 2030. Cheap desert land and heavy state oil wealth fund these mega-projects. This region plans to become the primary green energy hub globally.
Latin America Market Trends
Latin America relies on powerful wind and hydro resources. Chile attracts global giants to test huge clean export sites. The region features very cheap green power, offsetting the high cost of shipping fuel far away. Port cities race to build deep-water docks for global tank ships.
Key Regions and Countries
North America
- US
- Canada
Europe
- Germany
- France
- The UK
- Spain
- Italy
- Rest of Europe
Asia Pacific
- China
- Japan
- South Korea
- India
- Australia
- Rest of APAC
Latin America
- Brazil
- Mexico
- Rest of Latin America
Middle East & Africa
- GCC
- South Africa
- Rest of MEA
Regulatory Landscape
The European Union enacted strict carbon border adjustments in 2024 to tax dirty imports. This forces global chemical suppliers to switch to clean ammonia or lose access to EU buyers. Consequently, Germany launched major tenders to secure 259,000 metric tons of green supply to meet these new rules.
Egypt introduced the National Low-Carbon Hydrogen Strategy in 2024. This clear policy framework aims to capture a major share of global trade. The government projects this shift will boost national GDP by USD 18 billion by 2040. Strong local policies give foreign investors the legal safety needed to build mega-plants.
The United States deployed heavy tax credits under recent climate bills to subsidize production costs. These strict rules require producers to prove exact hourly power matching to claim the funds. This regulatory pressure forces developers to install complex tracking software before breaking ground on new plants.
Drivers
Mega-Joint Ventures and Corporate Buyouts Accelerate Global Production Capacity
Massive capital groups form joint ventures to share heavy plant costs. CF Industries built a USD 4 billion venture with JERA for a massive clean facility. Shared risk models allow builders to secure bank loans faster. This speed helps markets scale up before raw material shortages hit.
The Hydrogen Council tracks over 510 active clean projects globally. Total financial commitments reach USD 110 billion. This huge wave of cash pushes equipment makers to expand factory lines. Scale lowers the price of core machines, making the next wave of plants much cheaper to build.
TotalEnergies seeks permits for a USD 16 billion export hub in Chile. These mega-deals signal deep buyer confidence in long-term fuel demand. Large corporate buyers now sign binding decade-long contracts. This clear demand profile forces global banks to release cheaper debt for green energy transition projects.
Restraints
High Production Costs and Slow Policy Approvals Delay Final Investments
Green production methods remain vastly more expensive than dirty alternatives. South Africa’s Hive project targets USD 650 per ton to stay competitive. Most buyers refuse to pay this steep premium without state help. Consequently, operators struggle to secure enough buyer contracts to start actual construction work.
Evolving rules and certification laws create massive market doubt. Unclear standards caused an 18-month negotiation delay for the Yara-ACME deal. Buyers fear signing contracts for fuel that might fail future legal tests. This doubt freezes capital and pushes project start dates years into the future.
The Ammonia Energy Association tracks 372.5 million tons of planned capacity. However, a huge gap exists between big announcements and actual steel in the ground. High interest rates block many mid-sized builders from closing their bank loans. Therefore, actual short-term market volume remains very low.
Growth Factors
Emerging African Hubs and Strong Southeast Asian Demand Unlock New Trade Routes
African nations open massive plots of cheap land for solar arrays. Kenya advances the Kaptagat park to produce 40,000 tons annually. Local governments fast-track permits to attract foreign dollars. This action creates a brand new supply block outside of traditional middle eastern energy strongholds.
South Africa advances the USD 5.8 billion Hive project to hit 1 million tons by 2029. Global shipping lanes pass directly by these coastal ports. Ships can bunker clean fuel right at the source without extra transport costs. This location advantage creates huge future profit margins.
Southeast Asia offers a massive built-in buyer base. Indonesia and Vietnam possess huge existing chemical demand. Yara signed to buy 100,000 tons yearly from Oman starting in 2027. Using mature local trade networks lets new producers sell their green fuel instantly without building new downstream pipes.
Emerging Trends
Asian Power Grids Shift to Ammonia Co-Firing to Cut Carbon Fast
Asian utilities test direct chemical burning to clean up dirty coal plants quickly. Japan’s JERA plans 20% co-firing at the Hekinan station by 2030. This single plant needs 1 million tons yearly. This trend creates a huge new buyer class outside of traditional farm uses.
Regional supply chains mature rapidly to meet this new power demand. China schedules 600,000 tons of annual production for its northeast grid by 2026. Local governments build dedicated chemical storage tanks near major power stations. This hard infrastructure proves the co-firing model is a permanent market shift.
Developers build massive portfolios to dominate this future trade. The ACME Group targets a 10 million ton global network by 2032. First-movers secure the best port lands and the cheapest wind sites. Late arrivals will face much higher land costs and strict grid connection queues.
Research Methodology Framework and Report Scope
Market Definitions and Key Coverage
This research report analyzes the global clean ammonia market, focusing on production methods, core technologies, and end-use applications. The scope covers physical chemical output, electrolyzer systems, and purpose-built storage infrastructure. Market values are calculated in constant 2025 US Dollars to prevent local currency shifts from altering core growth trends.
The study specifically excludes traditional high-carbon ammonia sales, standalone wind or solar farms not directly tied to chemical production, and pure software management platforms. Furthermore, small lab-scale testing units and pure research grants are excluded from the final commercial revenue models to ensure highly accurate business forecasting.
Key Companies Insights
Yara International ASA uses its massive global shipping fleet to control clean trade routes. The firm opened a German import terminal in 2024 to handle 3 million tons yearly. Owning both production and import docks allows the business to dictate European pricing. This hard physical moat easily blocks smaller rivals from entering the market space.
Qatar Fertiliser Company (QAFCO) uses vast state backing to fund massive green plant tests. The company pairs deep chemical knowledge with huge solar farm access. This specific dual strength lowers the actual cost to make clean fuels. Their massive existing export ports mean they can ship green liquid globally without building expensive new loading docks.
PJSC Togliattiazot (TOAZ) faces strong pressure to upgrade legacy pipes to green standards. The firm plans large carbon capture units to sell blue variants as a bridge fuel. Holding massive global market share in dirty chemicals forces them to move fast. Delaying these green plant upgrades risks losing access to strict western buyer markets.
OCI Global N.V. strikes massive deals to secure prime coastal lands. Woodside Energy just bought their clean Texas project for USD 2.35 billion. The firm also builds a 60,000 ton storage tank in Rotterdam. Controlling these specific deep-water transit points ensures their clean product reaches paying buyers before grid limits stop other builders.
Key Companies
- Yara International ASA
- Qatar Fertiliser Company (QAFCO)
- PJSC Togliattiazot (TOAZ)
- OCI Global N.V.
- Koch Fertilizer
- IFFCO
- Group DF (Ostchem)
- EuroChem Group
- CSBP Limited
- CF Industries
- Nel ASA
- ThyssenKrupp
- Siemens
- ITM Power plc
- BASF SE
- ENGIE SA
- Cummins Inc.
- Linde Engineering
- Enapter Srl
- Green Hydrogen Systems
- Haldor Topsoe
- John Cockerill
Recent Industry Developments
- In March 2026, Under India’s National Green Hydrogen Mission, fertilizer companies, SECI and green-ammonia producers exchanged Green Ammonia Purchase Agreements and Supply Agreements covering approximately 724,000 tonnes per year. The agreements have a 10-year tenure and are designed to provide demand certainty and support financial closure for large-scale projects.
- In February 2026, MNRE notified India’s Green Ammonia Standard, defining eligibility and emissions requirements for ammonia to qualify as green. The standard sets a maximum lifecycle-related non-biogenic GHG emissions threshold of 0.38 kg CO₂e/kg NH₃, calculated over the preceding 12 months.
- In July 2026, AM Green’s Kakinada project advances as a major green ammonia development. The Asian Development Bank identifies the AM Green Ammonia Project in Kakinada, Andhra Pradesh as one of the world’s large green ammonia developments, with planned capacity of approximately 1.09 million tonnes per year across two 547.5 ktpa phases. ADB’s July 2026 documentation describes its financing as the bank’s first financing of a green ammonia facility.
- In July 2026, ACME secures 405,000 tonnes/year green ammonia offtake with IHI. ACME Group secured a long-term green ammonia offtake agreement with Japan’s IHI Corporation for 405,000 tonnes per year. The project is planned as an ACME-IHI joint venture at the Tata Steel SEZ Industrial Park in Gopalpur, Odisha, with proposed investment of approximately ₹67,000 crore and commissioning targeted for 2030.
Market Scope
| Report Features | Description |
|---|---|
| Market Value (2025) | USD 0.57 Billion |
| Forecast Revenue (2035) | USD 360.66 Billion |
| CAGR (2026-2035) | 90.6% |
| Base Year for Estimation | 2025 |
| Historic Period | 2020-2024 |
| Forecast Period | 2026-2035 |
| Report Coverage | Revenue Forecast, Market Dynamics, Competitive Landscape, Recent Developments |
| Segments Covered | By Technology (Solid Oxide Electrolysis, Alkaline Water Electrolysis, Proton Exchange Membrane, Photocatalysis, Photoelectrocatalysis), By Production Method (Haber-Bosch (Renewable-Powered), Haber-Bosch with Carbon Capture (Blue Ammonia)), By Feedstock (Dinitrogen-Based, Nitrate-Based, Organic Nitrogen-Based), By Application (Fertilizer, Power Generation, Transportation, Industrial Feedstock, Maritime Fuel) |
| Regional Analysis | North America (US and Canada), Europe (Germany, France, The UK, Spain, Italy, and Rest of Europe), Asia Pacific (China, Japan, South Korea, India, Australia, and Rest of APAC), Latin America (Brazil, Mexico, and Rest of Latin America), Middle East & Africa (GCC, South Africa, and Rest of MEA) |
| Competitive Landscape | Yara International ASA, Qatar Fertiliser Company (QAFCO), PJSC Togliattiazot (TOAZ), OCI Global N.V., Koch Fertilizer, IFFCO, Group DF (Ostchem), EuroChem Group, CSBP Limited, CF Industries, Nel ASA, ThyssenKrupp, Siemens, ITM Power plc, BASF SE, ENGIE SA, Cummins Inc., Linde Engineering, Enapter Srl, Green Hydrogen Systems, Haldor Topsoe, John Cockerill |
| Customization Scope | Customization for segments, region/country-level will be provided. Moreover, additional customization can be done based on the requirements. |
| Purchase Options | We have three licenses to opt for: Single User License, Multi-User License (Up to 5 Users), Corporate Use License (Unlimited User and Printable PDF) |