What is the Hydrogen Market Size?
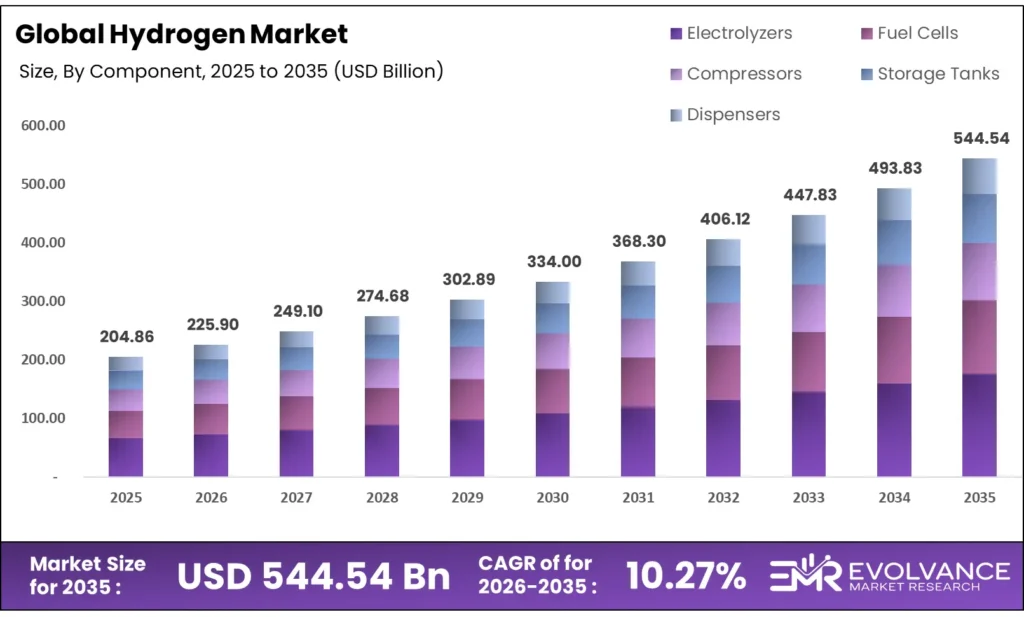
The Global Hydrogen Market size will be worth around USD 544.54 Billion by 2035 from USD 204.86 Billion in 2025, growing at a CAGR of 10.27% during the forecast period 2026 to 2035. Industrial decarbonization mandates and clean fuel tax credits are pulling capital into large-scale production faster than supply chains can absorb it. Buyers are shifting spending from fossil-based supply contracts toward long-term hydrogen electrolyzer backed offtake deals. However, project cancellations and weak near-term offtake commitments signal that demand certainty, not technology, is the primary risk to delivery timelines.
Market Highlights
- Global Hydrogen Market valued at USD 204.86 Billion in 2025, forecast to reach USD 544.54 Billion by 2035 at a CAGR of 10.27%.
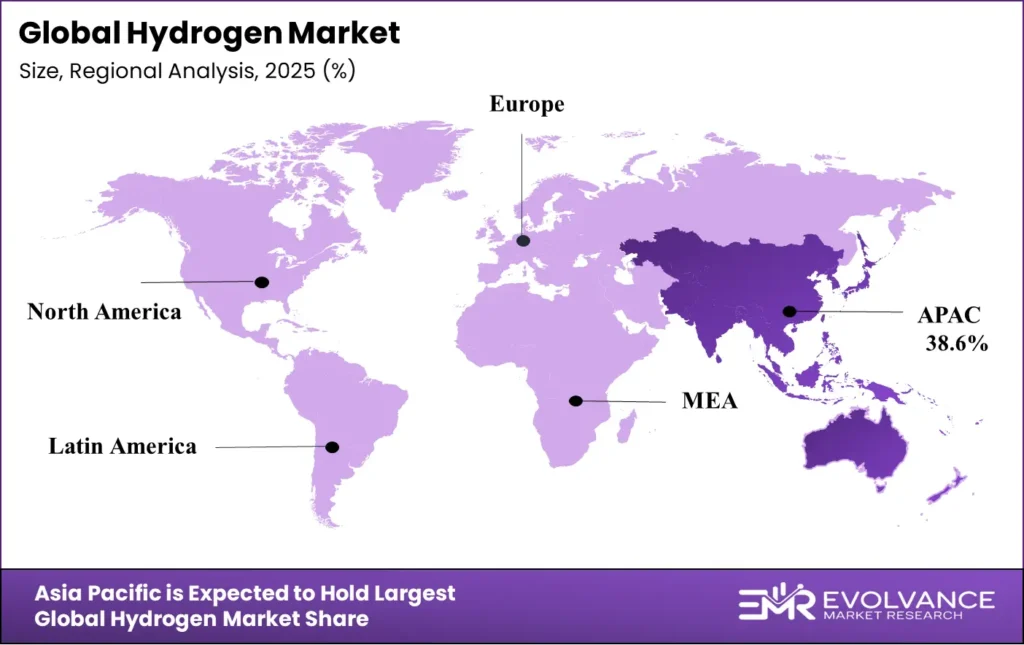
- Asia Pacific leads with 38.6% market share, valued at USD 79.07 Billion.
- Steam Methane Reforming dominates By Technology with 56.8% share.
- Grey Hydrogen leads By Type with 37.8%.
- Pipeline holds 58.7% of By Distribution Channel.
- Captive Generation leads By Deployment at 64.3%.
- Electrolyzers dominate By Component at 43.7%.
- Compressed Hydrogen leads By Storage Method at 43.9%.
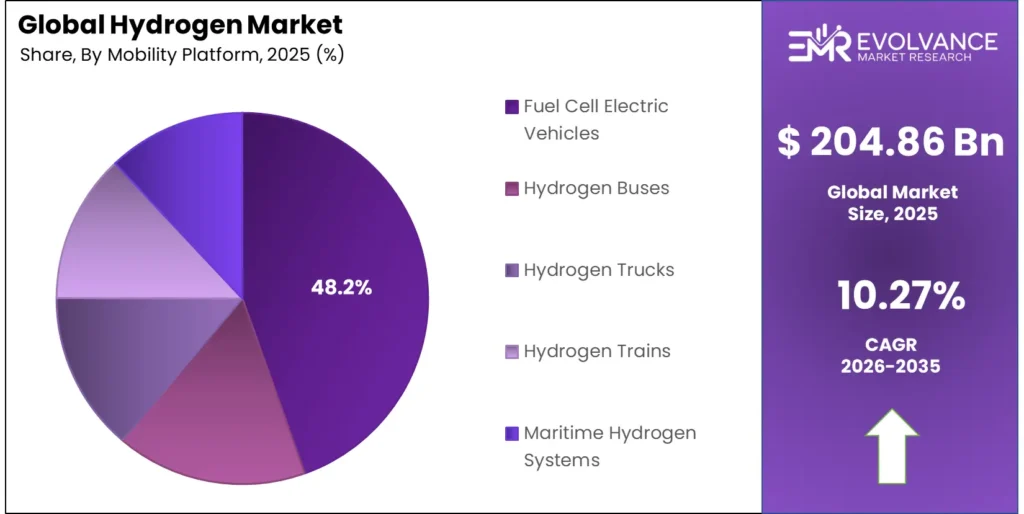
- Fuel Cell Electric Vehicles lead By Mobility Platform at 48.2%.
- Alkaline Electrolyzer leads By Electrolyzer Technology at 52.4%.
- Ammonia leads By Application with 46.2% share.
Market Overview
Hydrogen is an energy carrier used across refining, chemicals, steel production, transport, and power systems. It is produced from natural gas, coal, water electrolysis, and biomass, with each method carrying different carbon profiles and cost structures. The choice of production pathway now directly shapes competitive positioning, as buyers and regulators increasingly link procurement to carbon certification.
The market divides broadly between established grey and blue hydrogen supply chains and a fast-growing green hydrogen and low-carbon production segment. Grey hydrogen remains the volume leader today, but policy pressure, subsidy frameworks, and long-term offtake contracts are steadily redirecting capital toward electrolysis-based production. This structural shift is creating a two-speed market — high-volume legacy supply running alongside a capital-intensive clean build-out.
Government investment is accelerating commercial-scale production. The U.S. Bipartisan Infrastructure Law allocated $8 billion for Regional Clean Hydrogen Hubs through FY2026. Germany’s KfW development bank committed a €24 billion financing facility in 2024 to support the national hydrogen core network. These commitments create durable demand floors that justify the capital required for large electrolyzer facilities.
According to the U.S. Department of Energy, its Hydrogen Program currently supports more than 400 hydrogen research, demonstration, and deployment projects spanning production, storage, transport, and industrial end-use. This scale of public investment signals that hydrogen is no longer a speculative technology bet — it is an active procurement category for governments and large industrials alike.
Based on data from the European Commission, the IF24 Hydrogen Auction received 61 bids and selected 15 projects for €992 million in renewable hydrogen production support. Competition for subsidies at this intensity tells investors that policy support is a constraint, not a guarantee — developers who secure subsidy positions now hold a structural advantage over late entrants in a market that will consolidate around funded projects.
Type Insights
Grey Hydrogen dominates with 37.8% due to low production cost and existing infrastructure.
In 2025, Grey Hydrogen held a dominant market position in the By Type segment of the Hydrogen Market, with a 37.8% share. This dominance reflects the current reality: grey hydrogen is cheap to make, and most industrial buyers still prioritize cost over carbon impact. Until green alternatives reach price parity, grey hydrogen will remain the default choice for ammonia and refinery operations globally.
Blue Hydrogen serves as the bridge technology for industrial buyers not yet ready to commit fully to electrolysis-based production. It retains carbon through capture processes, making it viable for markets where carbon reduction commitments exist but renewable energy costs remain high. However, ExxonMobil freezing its Baytown blue hydrogen project signals that buyer demand has not yet validated large-scale blue hydrogen economics.
Green Hydrogen is the segment drawing the most capital despite holding a smaller share today. Air Liquide and TotalEnergies committed over €1 billion to two electrolyzer projects in the Netherlands totaling 450 MW of combined capacity. The EU’s IF24 Auction allocated €1.2 billion to renewable hydrogen projects, and 15 projects received €992 million in support — proof that subsidy frameworks are now driving commercial-scale deployment.
Turquoise Hydrogen is produced through methane pyrolysis, generating solid carbon rather than CO2 as a byproduct. Nel ASA’s new pressurized alkaline electrolyzer platform targeting costs below $1,450 per kW signals that electrolyzer economics are improving across all clean hydrogen types, including turquoise production pathways.
Technology Insights
Steam Methane Reforming dominates with 56.8% due to proven scale and low unit cost.
In 2025, Steam Methane Reforming (SMR) held a dominant market position in the By Technology segment of the Hydrogen Market, with a 56.8% share. SMR’s lead is structural, not just historical — it benefits from decades of industrial investment, fully depreciated assets, and a cost base that electrolysis cannot yet match at scale. This creates a sticky installed base that limits how quickly green alternatives can take volume.
Electrolysis is the technology at the center of the energy transition bet. The U.S. DOE closed a $1.66 billion loan guarantee for Plug Power in January 2025 to finance up to six clean hydrogen production facilities using electrolyzer technology. Siemens Energy and partners committed to scaling electrolyzer manufacturing from approximately 1.75 GW per year to 17.5 GW per year — a tenfold increase that signals industry confidence in electrolysis becoming the backbone of future hydrogen supply.
Distribution Channel Insights
Pipeline dominates with 58.7% due to cost efficiency at industrial scale.
In 2025, Pipeline held a dominant market position in the By Distribution Channel segment of the Hydrogen Market, with a 58.7% share. Pipelines win at scale because per-unit delivery cost falls sharply with volume — a structural advantage no other channel can replicate for continuous industrial supply. Germany’s Federal Network Agency approved a national hydrogen core network in October 2024 to connect industrial demand centers, and KfW committed a €24 billion financing facility to support it.
Cargo distribution covers hydrogen transported in compressed or liquefied form via trucks and ships. It serves markets too distant from pipeline networks to access industrial hydrogen at competitive cost. Its role will likely grow in maritime and cross-border trade as import-dependent economies build hydrogen import terminals.
Component Insights
Electrolyzers dominate with 43.7% due to central role in clean hydrogen production.
In 2025, Electrolyzers held a dominant market position in the By Component segment of the Hydrogen Market, with a 43.7% share. Their dominance reflects where capital is flowing — every major green hydrogen project requires an electrolyzer as its core production asset. HYDGEN raised $5 million in 2025 to scale its Anion Exchange Membrane electrolyzer from a 1 kW to 100 kW product range, with a 250 kW unit under development for industrial users across India, Japan, Europe, and the Middle East.
Compressors are essential for pipeline injection and refueling station operations. Nel ASA’s new electrolyzer platform delivers hydrogen at 30 bar pressure with 99.99% purity, which directly reduces the downstream compression load for industrial buyers — a cost saving that improves overall project economics.
Deployment Insights
Captive Generation dominates with 64.3% due to industrial self-supply economics.
In 2025, Captive Generation held a dominant market position in the By Deployment segment of the Hydrogen Market, with a 64.3% share. Industrial buyers overwhelmingly prefer to produce hydrogen on-site or within their own supply chain — it eliminates third-party pricing risk and ensures consistent supply for continuous process operations. Ammonia plants, refineries, and steel producers all operate captive hydrogen systems for this reason.
Merchant Generation supplies hydrogen to external buyers through commercial agreements. RWE’s long-term deal to supply 30,000 tonnes of green hydrogen annually to TotalEnergies from its 300 MW Lingen facility starting in 2030 represents one of Europe’s largest merchant hydrogen contracts — signaling that the merchant model is maturing beyond pilot volumes into bankable commercial supply agreements.
On-site Generation enables smaller industrial and commercial users to produce hydrogen at point of use. This model is gaining traction where pipeline access is absent and delivered hydrogen costs are high. HYDGEN’s modular electrolyzer systems from 1 kW to 100 kW target exactly this demand — localized production that avoids both transport cost and supply chain dependency.
Storage Method Insights
Compressed Hydrogen dominates with 43.9% due to simplicity and established infrastructure.
In 2025, Compressed Hydrogen held a dominant market position in the By Storage Method segment of the Hydrogen Market, with a 43.9% share. Compression is the default storage format because it requires no exotic materials or cryogenic management — it uses equipment already deployed in industrial gas markets. Nel ASA’s electrolyzer delivering hydrogen at 30 bar natively reduces the additional compression energy needed, directly lowering storage costs for buyers adopting this format.
Underground Hydrogen Storage offers the largest-scale buffer capacity of any storage method, using depleted gas fields, aquifers, or salt caverns. Germany’s 9,040-kilometer hydrogen core network — approved in October 2024 — will depend partly on underground storage to balance seasonal supply and demand swings across industrial demand centers.
Mobility Platform Insights
Fuel Cell Electric Vehicles dominate with 48.2% due to range and refueling advantages.
In 2025, Fuel Cell Electric Vehicles (FCEVs) held a dominant market position in the By Mobility Platform segment of the Hydrogen Market, with a 48.2% share. FCEVs lead the mobility segment because they solve the range and refueling limitations that constrain battery-electric vehicles in high-utilization transport roles. The California Hydrogen Hub under DOE’s ARCHES initiative is designed to produce 450 to 500 metric tonnes of clean hydrogen per day, partly to supply fuel-cell trucks and buses across California’s transport network.
Hydrogen Trucks address the long-haul freight segment where battery weight and recharge time create practical barriers. Plug Power supplied electrolyzers for Hy2gen’s 275 MW Courant project in Québec, designed to produce decarbonized ammonium nitrate using renewable hydrogen — an adjacent industrial application that shares infrastructure with truck refueling networks.
Maritime Hydrogen Systems target the shipping sector, where fuel switching is one of the most complex decarbonization challenges due to long voyage durations and high energy requirements. The DOE’s California Hydrogen Hub includes marine vessel applications as part of its integrated mobility infrastructure plan.
Electrolyzer Technology Insights
Alkaline Electrolyzers dominate with 52.4% due to proven reliability and lower capital cost.
In 2025, Alkaline Electrolyzers held a dominant market position in the By Electrolyzer Technology segment of the Hydrogen Market, with a 52.4% share. Alkaline technology wins on cost and longevity — it uses no precious metal catalysts and benefits from decades of industrial deployment. Nel ASA’s next-generation pressurized alkaline platform targets capital costs below $1,450 per kW for a 25 MW plant, with Nel estimating 40% to 60% cost reductions versus prior systems and an 80% reduction in space requirements.
PEM Electrolyzers offer faster response times and higher efficiency at partial load, making them better suited for pairing with variable renewable energy. Air Liquide’s 200 MW ELYgator project in Rotterdam and the planned 250 MW Zeeland facility both leverage renewable electricity from the OranjeWind offshore windfarm — conditions where PEM’s dynamic response capabilities add operational value.
AEM Electrolyzers combine elements of alkaline and PEM technology using a polymer membrane with alkaline chemistry. HYDGEN’s AEM-based systems, ranging from 1 kW to 100 kW with a 250 kW unit in development, target decentralized industrial production markets across India, Japan, Europe, and the Middle East — positioning AEM as the format of choice for modular, distributed hydrogen generation.
Application Insights
Ammonia dominates with 46.2% due to fertilizer demand and established hydrogen consumption infrastructure.
In 2025, Ammonia held a dominant market position in the By Application segment of the Hydrogen Market, with a 46.2% share. Ammonia production accounts for the largest single block of industrial hydrogen consumption globally — this is not new demand but an existing industrial process where green hydrogen substitution can reduce carbon intensity without changing end-product or buyer behavior. The DOE’s Heartland Hydrogen Hub focused specifically on clean hydrogen for low-carbon fertilizer manufacturing, with its hub expected to cut CO2 emissions by approximately 525,000 metric tonnes annually.
Transportation applications cover fuel-cell vehicles, buses, trucks, trains, and maritime systems. TotalEnergies and Air Liquide’s combined Rotterdam and Zeeland projects are expected to avoid up to 500,000 tonnes of CO2-equivalent emissions annually — partly through supplying hydrogen to heavy-duty mobility applications alongside industrial refinery customers.
Market Segments Covered in the Report
By Type
- Grey Hydrogen
- Blue Hydrogen
- Green Hydrogen
- Pink Hydrogen
- Turquoise Hydrogen
- Yellow Hydrogen
- White Hydrogen
By Technology
- Steam Methane Reforming
- Coal Gasification
- Electrolysis
- Partial Oxidation
- Biomass Gasification
- Methane Pyrolysis
By Distribution Channel
- Pipeline
- Cargo
- Cryogenic Tanks
- Hydrogen Refueling Stations
By Component
- Electrolyzers
- Fuel Cells
- Compressors
- Storage Tanks
- Dispensers
By Deployment
- Captive Generation
- Merchant Generation
- On-site Generation
By Storage Method
- Compressed Hydrogen
- Liquid Hydrogen
- Metal Hydrides
- Underground Hydrogen Storage
By Mobility Platform
- Fuel Cell Electric Vehicles
- Hydrogen Buses
- Hydrogen Trucks
- Hydrogen Trains
- Maritime Hydrogen Systems
By Electrolyzer Technology
- Alkaline Electrolyzer
- PEM Electrolyzer
- SOEC Electrolyzer
- AEM Electrolyzer
By Application
- Ammonia
- Methanol Production
- Transportation
- Power Generation
- Steel Production
- Electronics
- Food & Beverages
- Medical
Regional Insights
Asia Pacific Dominates the Hydrogen Market with a Market Share of 38.6%, Valued at USD 79.07 Billion
Asia Pacific leads with 38.6% share and a market value of USD 79.07 Billion, driven by China’s dominant grey and blue hydrogen production base, Japan’s long-standing national hydrogen strategy, and India’s emerging green hydrogen hub program. The region’s heavy industrial base creates captive demand for hydrogen in refining, chemicals, and steel that no other region matches in volume. India’s INR 2 billion allocation for renewable hydrogen hubs in 2024 signals that state-led demand creation is now replicating the policy playbook that drove solar adoption.
North America Hydrogen Market Trends
North America holds a strong position built on federal investment commitments. The U.S. Bipartisan Infrastructure Law allocated $8 billion for Regional Clean Hydrogen Hubs, with the DOE supporting more than 400 hydrogen projects. The U.S. DOE’s $1.66 billion loan guarantee to Plug Power in January 2025 for six clean hydrogen facilities shows that federal capital is now flowing from policy to physical assets. Canada is adding commercial-scale capacity through Hy2gen’s 275 MW Courant project in Québec targeting decarbonized fertilizer production.
Europe Hydrogen Market Trends
Europe is the most active subsidy market globally. The European Commission allocated €1.2 billion through the IF24 Hydrogen Auction, selecting 15 projects for €992 million in renewable hydrogen support. Germany’s national hydrogen core network approval in October 2024 and its €24 billion KfW financing facility create the transport backbone that industrial buyers need before committing to green supply contracts. Air Liquide and TotalEnergies announced over €1 billion in combined electrolyzer investments in the Netherlands in February 2025.
Latin America Hydrogen Market Trends
Latin America is emerging as an export-oriented green hydrogen zone. Brazil and Chile hold the most advanced project pipelines, leveraging abundant renewable resources to target European and Asian import demand. The region’s low renewable power costs create a structural production cost advantage that, if paired with infrastructure investment, could make Latin American green hydrogen among the most price-competitive globally by the early 2030s.
Middle East & Africa Hydrogen Market Trends
The Middle East is transitioning from fossil fuel exporter to potential clean hydrogen exporter. Egypt’s 100 MW Ain Sokhna green hydrogen facility producing feedstock for green ammonia demonstrates that large-scale projects are moving from announcement to construction. Gulf sovereign wealth funds are backing projects that leverage low-cost solar and stranded natural gas assets to build competitive blue and green hydrogen export capacity targeting European import demand.
Key Regions and Countries
North America
- US
- Canada
Europe
- Germany
- France
- The UK
- Spain
- Italy
- Rest of Europe
Asia Pacific
- China
- Japan
- South Korea
- India
- Australia
- Rest of APAC
Latin America
- Brazil
- Mexico
- Rest of Latin America
Middle East & Africa
- GCC
- South Africa
- Rest of MEA
Regulatory Landscape
The U.S. Inflation Reduction Act Section 45V, enacted in 2022 and active through the forecast period, offers up to $3 per kilogram in clean hydrogen production tax credits. This is the most direct production economics intervention any government has made for hydrogen. It narrows the cost gap between green and grey hydrogen for U.S.-based producers and is already redirecting capital toward domestic electrolyzer projects.
Germany’s Hydrogen Acceleration Law, adopted in February 2026, classified hydrogen infrastructure as a matter of overriding public interest. This change simplifies permitting for production, storage, and transport projects that previously faced multi-year approval delays. For project developers, it removes one of the most significant non-financial barriers to deployment in Europe’s largest industrial economy.
The European Commission’s IF24 Hydrogen Auction, open from December 2024 to February 2025, allocated €1.2 billion to renewable hydrogen projects across EU27 countries plus Iceland, Liechtenstein, and Norway. Support takes the form of fixed premium payments linked to certified hydrogen output over a maximum 10-year period. This shifts revenue risk from producers to the public sector, which is the trigger mechanism for institutional capital deployment at scale.
Germany’s Federal Network Agency approved the national hydrogen core network in October 2024, covering 9,040 kilometers of pipelines by 2032. The network’s regulatory approval gives offtake counterparties certainty about delivery infrastructure — a prerequisite for signing long-term supply contracts. Without regulatory-backed transport infrastructure, even well-funded production projects struggle to secure commercial off-takers.
Hydrogen Market Dynamics
Drivers
Subsidy Frameworks and Tax Credits Are Reshaping Hydrogen Production Economics
The EU’s €1.2 billion IF24 Hydrogen Auction and the U.S. IRA Section 45V tax credit of up to $3 per kilogram are not just incentives — they are structural repricing events. They change the return profile of green hydrogen projects enough to unlock institutional equity and debt that previously sat on the sideline waiting for cost parity.
The European Hydrogen Bank’s pilot auction attracted 132 bids representing 8.5 GW of electrolyzer capacity. That level of bid volume tells producers and investors that subsidy support is competitively scarce, which accelerates investment decisions. Developers who secure auction positions now hold an asset with durable revenue protection — a fundamentally different risk profile from merchant hydrogen sales.
Moreover, Spain, Austria, and Lithuania committed over €700 million in national co-funding under the EU Auctions-as-a-Service framework. National governments adding capital on top of EU-level support creates layered incentive stacks that further compress the effective cost of capital for winning projects. This is the mechanism that turns policy ambition into physical electrolyzer capacity.
Restraints
Weak Offtake Demand and Project Cancellations Are Slowing Industrial Hydrogen Deployment
ExxonMobil’s decision to freeze one of the world’s largest blue hydrogen projects in Baytown is the clearest signal that demand, not supply, is the binding constraint. The project had strong technology and funding credentials. What it lacked was a buyer base willing to pay a premium for low-carbon hydrogen at the volumes required to justify capital deployment.
The International Energy Agency cut its 2030 low-emission hydrogen production outlook by nearly 25% in response to rising costs and project cancellations. This revision reflects a structural gap between announced project pipelines and confirmed offtake agreements. Developers over-estimated how quickly industrial buyers would accept higher hydrogen input costs in their decarbonization planning.
Additionally, the U.S. DOE evaluated funding reductions affecting four of seven hydrogen hubs, representing approximately $4 billion in pledged infrastructure funding under review in 2025. Policy uncertainty of this scale creates a freeze effect — project developers pause final investment decisions when they cannot confirm public co-funding will be available at the terms originally planned.
Growth Factors
Pipeline Network Conversion and New Infrastructure Investment Open Transport Capacity
Germany converted 400 kilometers of existing natural gas pipelines into hydrogen transport infrastructure in 2025. This is the fastest and lowest-cost route to hydrogen network buildout — repurposing steel already in the ground avoids the permitting, procurement, and construction timelines of new-build pipelines. It makes commercial hydrogen delivery viable years earlier than greenfield alternatives would allow.
Belgium launched construction of its first national open-access hydrogen pipeline network through Fluxys. Open-access infrastructure is a market formation mechanism: it allows multiple producers and buyers to share transport capacity, lowering the entry cost for smaller producers and expanding the buyer pool beyond anchor industrial customers. Germany estimated its full national hydrogen pipeline network will cost approximately €20 billion, with a proposed access fee of €25 per kWh per hour to fund financing and operations.
Furthermore, Air Liquide and TotalEnergies announced over €1 billion in investment for a 200 MW Rotterdam electrolyzer and a 250 MW Zeeland electrolyzer in February 2025. These projects, expected to produce up to 53,000 tonnes of combined annual renewable hydrogen, are sized to supply industrial clusters at volumes that make long-term supply contracts bankable for both producers and buyers.
Emerging Trends
Large-Scale Electrolyzer Projects Above 200 MW Are Becoming the Commercial Benchmark
The hydrogen industry is shifting from pilot-scale to commercial-scale production as the defining competitive threshold. Air Liquide’s 200 MW ELYgator project in Rotterdam and the planned 250 MW Zeeland facility signal that projects below 100 MW are no longer positioned as market leaders — they are now technology demonstrators rather than supply-chain anchors.
Nel ASA’s 2026 announcement of a pressurized alkaline electrolyzer platform targeting turnkey costs below $1,450 per kW for a 25 MW plant — with capital cost reductions of 40% to 60% versus prior systems — shows that equipment economics are compressing alongside project scale. The EU Innovation Fund is supporting this platform with up to €135 million, covering roughly 60% of eligible costs, further reducing the financial risk for early commercial buyers.
Additionally, hydrogen policy support is transitioning from pilot subsidies to long-term market formation mechanisms. The IF24 Auction’s fixed premium payment model, linked to certified output over up to 10 years, mirrors the contract-for-difference structure that scaled offshore wind globally. Developers who recognize this pattern are building businesses around recurring subsidy-backed revenue streams rather than spot market exposure.
Key Companies Insights
Air Liquide is building one of Europe’s largest hydrogen production footprints through its ELYgator platform. Its 200 MW Rotterdam electrolyzer, targeting 23,000 tonnes of annual renewable hydrogen production, is backed by EU Innovation Fund and Dutch IPCEI support with operations targeted for end of 2027. Combined with the 250 MW Zeeland project with TotalEnergies, Air Liquide’s European green hydrogen pipeline is designed to serve both industrial and heavy-duty mobility markets at commercial scale.
Linde plc holds a strong position in hydrogen distribution infrastructure, particularly in pipeline and cryogenic transport systems. Its global presence across industrial gas markets means it operates at the intersection of legacy grey hydrogen supply chains and the new clean hydrogen buildout — giving it leverage on both the offtake and logistics sides of the transition. Linde’s infrastructure base is a structural advantage as industrial buyers seek reliable delivery networks alongside clean production credentials.
Nel ASA is repositioning from a niche electrolyzer supplier to a cost-competitive platform provider. Its next-generation pressurized alkaline system targets hydrogen delivery at 30 bar and 99.99% purity, reducing downstream compression costs for industrial users. The platform targets capital cost reductions of 40% to 60% while cutting space requirements by 80% — a combination that addresses the two main barriers industrial buyers cite when comparing electrolyzer bids.
Plug Power Inc. has built an electrolyzer supply track record across multiple large-scale projects. It supplied systems for Hy2gen’s 275 MW Courant project in Québec, a 100 MW installation at the Galp Sines refinery in Portugal, and a 100 MW facility for Egypt’s Ain Sokhna green ammonia project. The U.S. DOE’s $1.66 billion loan guarantee in January 2025 for up to six clean hydrogen production facilities gives Plug Power the balance sheet support needed to execute on a project pipeline that spans three continents.
Key Companies
- Air Liquide
- Linde plc
- Shell plc
- Mitsubishi Power
- Plug Power Inc.
- Cummins Inc.
- Nel ASA
- Siemens Energy AG
- thyssenkrupp nucera
- Bloom Energy
- Ballard Power Systems
- ENGIE
- TotalEnergies
- Air Products and Chemicals, Inc.
- Others
Recent Development
- In October 2025, Indian green hydrogen startup Hydgen raised $5 million in a pre-Series A funding round led by Transition Venture Capital with participation from Cloudberry Pioneer Investments, Moringa Ventures, and strategic family offices.
- In March 2025, Estonian electrolyzer manufacturer Stargate Hydrogen announced an €11 million Series A funding round to scale precious-metal-free electrolyzer systems for industrial hydrogen production.
- In February 2025, Air Liquide and TotalEnergies announced plans to invest more than €1 billion in two large-scale green hydrogen electrolyzer projects in the Netherlands, including a 200 MW Rotterdam electrolyzer powered by offshore wind.
- In September 2025, GH2 Solar announced a ₹400 crore investment to enter electrolyzer manufacturing in India through a facility in Gwalior developed with Advanced Hydrogen Energy Solutions (AHES).
Market Scope
| Report Features | Description |
|---|---|
| Market Value (2025) | USD 204.86 Billion |
| Forecast Revenue (2035) | USD 544.54 Billion |
| CAGR (2026-2035) | 10.27% |
| Base Year for Estimation | 2025 |
| Historic Period | 2020-2024 |
| Forecast Period | 2026-2035 |
| Report Coverage | Revenue Forecast, Market Dynamics, Competitive Landscape, Recent Developments |
| Segments Covered | By Type (Grey Hydrogen, Blue Hydrogen, Green Hydrogen, Pink Hydrogen, Turquoise Hydrogen, Yellow Hydrogen, White Hydrogen), By Technology (Steam Methane Reforming, Coal Gasification, Electrolysis, Partial Oxidation, Biomass Gasification, Methane Pyrolysis), By Distribution Channel (Pipeline, Cargo, Cryogenic Tanks, Hydrogen Refueling Stations), By Component (Electrolyzers, Fuel Cells, Compressors, Storage Tanks, Dispensers), By Deployment (Captive Generation, Merchant Generation, On-site Generation), By Storage Method (Compressed Hydrogen, Liquid Hydrogen, Metal Hydrides, Underground Hydrogen Storage), By Mobility Platform (Fuel Cell Electric Vehicles, Hydrogen Buses, Hydrogen Trucks, Hydrogen Trains, Maritime Hydrogen Systems), By Electrolyzer Technology (Alkaline Electrolyzer, PEM Electrolyzer, SOEC Electrolyzer, AEM Electrolyzer), By Application (Ammonia, Methanol Production, Transportation, Power Generation, Steel Production, Electronics, Food & Beverages, Medical) |
| Regional Analysis | North America (US and Canada), Europe (Germany, France, The UK, Spain, Italy, and Rest of Europe), Asia Pacific (China, Japan, South Korea, India, Australia, and Rest of APAC), Latin America (Brazil, Mexico, and Rest of Latin America), Middle East & Africa (GCC, South Africa, and Rest of MEA) |
| Competitive Landscape | Air Liquide, Linde plc, Shell plc, Mitsubishi Power, Plug Power Inc., Cummins Inc., Nel ASA, Siemens Energy AG, thyssenkrupp nucera, Bloom Energy, Ballard Power Systems, ENGIE, TotalEnergies, Air Products and Chemicals, Inc., Others |
| Customization Scope | Customization for segments, region/country-level will be provided. Moreover, additional customization can be done based on the requirements. |
| Purchase Options | We have three licenses to opt for: Single User License, Multi-User License (Up to 5 Users), Corporate Use License (Unlimited User and Printable PDF) |