What is the Hydrogen Generation Market Size?
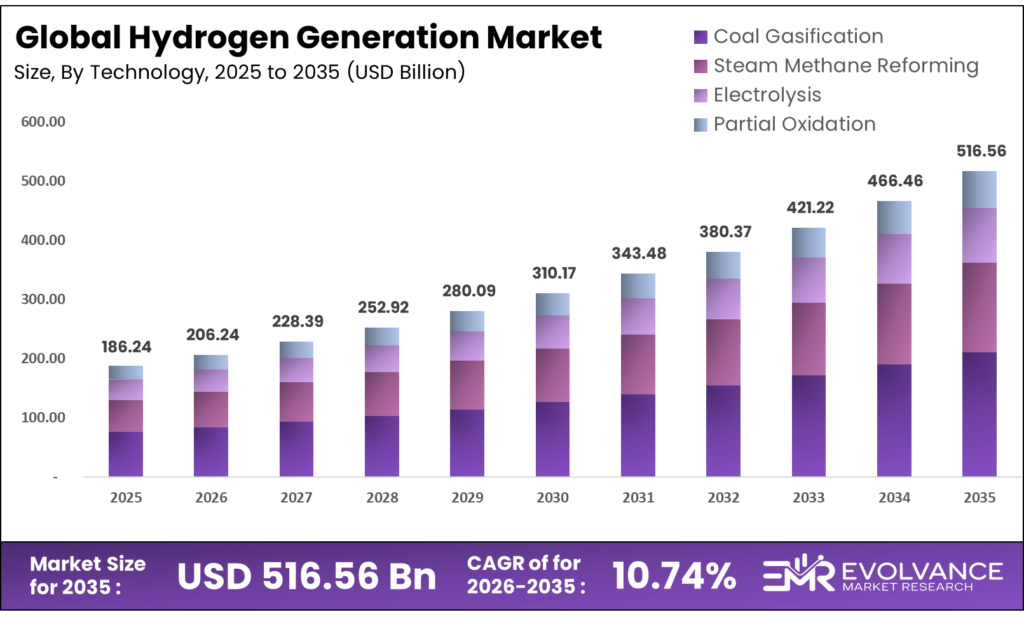
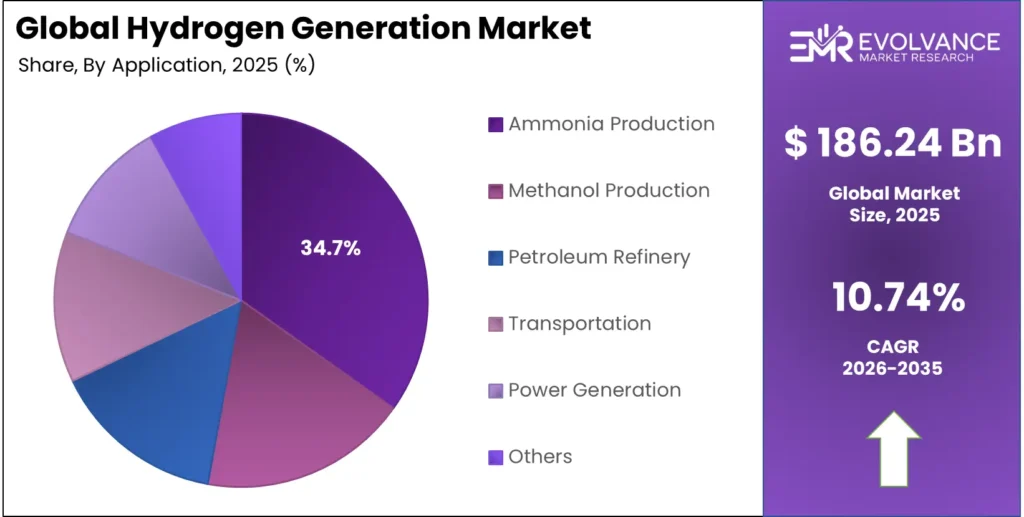
The Global Hydrogen Generation Market size will be worth around USD 516.26 Billion by 2035 from USD 186.24 Billion in 2025, growing at a CAGR of 10.74% during the forecast period 2026 to 2035. Industrial decarbonization mandates and fuel cell adoption are pushing buyers to commit capital well ahead of infrastructure readiness. Enterprise procurement is shifting from spot purchases to long-term offtake deals, signaling a structural change in how hydrogen is bought and sold. Water scarcity constraints near planned production sites introduce a supply-side risk that could slow project timelines in key regions.
Market Highlights
- The Global Hydrogen Generation Market will grow from USD 186.24 Billion in 2025 to USD 516.26 Billion by 2035, at a CAGR of 10.74%.
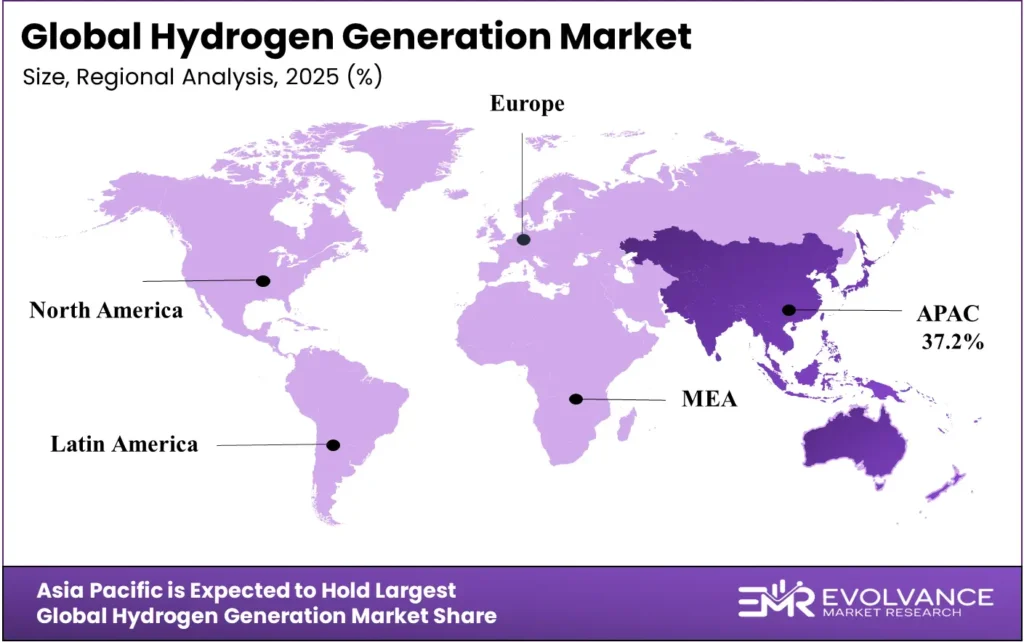
- Asia Pacific leads all regions with a 37.2% market share, valued at USD 69.28 Billion.
- By Systems Type, Captive Generation dominates with a 62.7% share.
- By Technology, Coal Gasification leads at 65.3%.
- By Raw Material, Coal holds 46.2%.
- By Application, Ammonia Production commands 34.7%.
- By Distribution Channel, Pipeline leads at 49.3%.
- By End-User, Chemical Industry holds 42.9%.
Market Overview
The hydrogen generation market covers all commercial and industrial processes that produce hydrogen gas for use as a chemical feedstock, energy carrier, or industrial input. Output methods range from coal gasification and steam methane reforming to electrolysis and partial oxidation. Each technology carries a different cost structure, carbon intensity, and infrastructure requirement, which shapes where and how buyers source their hydrogen.
Hydrogen serves as a foundational input across ammonia production, petroleum refining, steel manufacturing, and power generation. The diversity of end-use applications means demand is broadly distributed across heavy industry sectors. This breadth protects the market from cyclical downturns in any single sector while creating competition among buyers for limited low-emissions supply.
Government investment and policy action are reshaping project economics at scale. National hydrogen strategies increased from 23 in 2021 to 60 by 2024 worldwide, reflecting a global policy shift toward hydrogen as a decarbonization tool. This proliferation of national frameworks is creating new procurement pipelines and investment incentives that did not exist three years ago. This level of targeted public funding de-risks early projects and accelerates the commercialization window for equipment and service providers operating in the U.S. market.
In December 2024, the U.S. clarified Investment Tax Credit rules to cover a broader range of hydrogen storage applications, extending financial support beyond production and into the storage layer of the value chain. As reported by the U.S. Department of Energy, USD 750 million in grants were awarded across 52 hydrogen projects in 24 states, channeling federal capital into hydrogen electrolyzer deployment and hydrogen hub development.
According to data from the International Energy Agency, global hydrogen production reached 97 million tonnes in 2023, yet low-emissions output accounted for less than 1% of total supply. This gap between headline production volume and clean supply is the core commercial tension defining this market — and it represents the largest addressable opportunity for vendors offering electrolysis and other low-carbon production technologies.
Systems Type Insights
Captive Generation dominates with 62.7% due to cost control and supply security advantages.
In 2025, Captive Generation held a dominant position in the By Systems Type segment of the Hydrogen Generation Market, with a 62.7% share. Large industrial operators — especially in chemicals and refining — prefer on-site production because it removes dependence on third-party supply chains and allows hydrogen costs to be managed as a controllable operating input. The economics of scale-up also favor captive models for facilities with steady, high-volume demand.
Merchant Generation serves buyers who cannot justify the capital cost of on-site production. These are typically mid-sized industrial users, mobility operators, and early-stage applications where demand volumes are insufficient to support a dedicated plant. The merchant segment benefits from expanding pipeline and bulk delivery infrastructure, which improves unit economics for delivered hydrogen and broadens the viable customer base over time.
Technology Insights
Coal Gasification dominates with 65.3% due to low feedstock cost and established production infrastructure.
In 2025, Coal Gasification held a dominant position in the By Technology segment of the Hydrogen Generation Market, with a 65.3% share. This dominance reflects the geographic concentration of hydrogen production in coal-rich economies, particularly China, where cheap domestic coal makes gasification the lowest-cost route. The existing asset base — built over decades — creates significant switching inertia even as cleaner alternatives gain policy support.
Electrolysis is the key growth technology in the market. Global installed water electrolyzer capacity reached 1.4 GW by end of 2023, a figure that could reach 5 GW by end of 2024. Global electrolyzer manufacturing capacity grew from 9 GW/year in 2021 to 25 GW/year in 2023, proving that supply chains are scaling well ahead of current demand — a condition that historically precedes a rapid cost reduction cycle.
Raw Material Insights
Coal dominates with 46.2% due to abundant supply and low cost in Asian production markets.
In 2025, Coal held a dominant position in the By Raw Material segment of the Hydrogen Generation Market, with a 46.2% share. This is a direct output of China’s dominant role in global hydrogen production, where domestic coal gives local producers a cost advantage that natural gas cannot match at current energy prices. Any shift away from coal as a hydrogen feedstock requires either a carbon price high enough to overcome the cost gap or a major relative change in gas pricing.
Natural Gas is the primary feedstock in Western hydrogen markets. Its share is supported by well-developed gas distribution networks, existing reforming assets, and historically low prices in North America. The path toward blue hydrogen — natural gas reforming with carbon capture — positions natural gas as a bridge feedstock rather than a stranded asset, which sustains investment in gas-fed production capacity through the transition period.
Water is the feedstock for electrolysis-based green hydrogen. Its market share will grow in direct proportion to electrolyzer deployment. However, data published by the International Energy Agency flagged that approximately 40% of planned low-emissions hydrogen projects are located in water-stressed regions — a supply-chain risk that developers and investors must price into project models before committing capital.
Application Insights
Ammonia Production dominates with 34.7% due to its role as the primary input for global fertilizer supply chains.
In 2025, Ammonia Production held a dominant position in the By Application segment of the Hydrogen Generation Market, with a 34.7% share. Fertilizer manufacturing runs on ammonia, which runs on hydrogen. Global food security concerns have made fertilizer supply chains a strategic priority for governments, locking in stable hydrogen demand from this segment regardless of energy transition timelines.
Methanol Production is a growing application as methanol gains traction as a marine fuel and chemical feedstock. The shipping sector’s decarbonization commitments are creating demand for green methanol, which pulls through demand for green hydrogen. This cross-sector linkage means hydrogen suppliers serving methanol producers are indirectly exposed to maritime fuel transition economics.
Transportation is the application most directly tied to fuel cell vehicle adoption. Plug Power had deployed more than 250 hydrogen fueling stations and more than 69,000 fuel cell systems by 2024, establishing the infrastructure baseline needed to support mobility demand growth. The segment’s scale-up pace depends heavily on vehicle fleet adoption rates and the cost trajectory of fuel cells relative to battery alternatives.
Power Generation represents hydrogen’s long-term role as a grid balancing tool. Germany’s analysis showed that its planned electrolyzer fleet could theoretically cover 100% of balancing-capacity market demand, with participation in those markets reducing electrolyzer electricity costs by 13%. This dual-revenue model — selling hydrogen while providing grid services — materially improves project economics for large-scale electrolysis operators.
Distribution Channel Insights
Pipeline dominates with 49.3% due to the lowest per-unit delivery cost at scale for industrial buyers.
In 2025, Pipeline held a dominant position in the By Distribution Channel segment of the Hydrogen Generation Market, with a 49.3% share. Once a pipeline network is built, it delivers hydrogen at a marginal cost that no truck or cylinder can match. Large industrial clusters — chemical parks, refinery complexes — are almost always pipeline-served, which concentrates volume and reinforces the channel’s dominance.
Merchant/Bulk Delivery bridges the gap between pipeline users and cylinder users. It serves mid-sized industrial customers with consistent but moderate demand. Truck-based bulk delivery is more expensive than pipeline on a per-unit basis, but the capital cost to connect new users to a pipeline network often makes bulk delivery the more practical choice for buyers outside existing pipeline corridors.
End-User Insights
Chemical Industry dominates with 42.9% due to hydrogen’s role as a non-substitutable feedstock in core chemical processes.
In 2025, Chemical Industry held a dominant position in the By End-User segment of the Hydrogen Generation Market, with a 42.9% share. Ammonia, methanol, and refining chemicals cannot be produced without hydrogen. This embedded, process-level dependency creates a demand base that does not respond to price signals the way discretionary applications do — the industry buys hydrogen because it has no alternative.
Metals & Steel is the segment with the most structural growth potential over the forecast period. Green hydrogen direct-reduction steelmaking is moving from pilot to early commercial scale. In 2024, Hysata and POSCO announced an electrolyzer development partnership targeting steel decarbonization applications, a deal that signals major steel producers are willing to commit to supply chain development rather than just watch from the sidelines.
Glass Manufacturing uses hydrogen as an atmosphere gas and reducing agent in float glass production. Demand here is steady and predictable, linked directly to construction activity. It is not a high-growth segment but provides stable, recurring volume that strengthens the economics of regional supply infrastructure.
Market Segments Covered in the Report
By Systems Type
- Captive Generation
- Merchant Generation
By Technology
- Coal Gasification
- Steam Methane Reforming
- Electrolysis
- Partial Oxidation
By Raw Material
- Coal
- Natural Gas
- Water
- Biomass
By Application
- Ammonia Production
- Methanol Production
- Petroleum Refinery
- Transportation
- Power Generation
- Others
By Distribution Channel
- Pipeline
- Cylinder
- Merchant/Bulk Delivery
- On-site Supply
By End-User
- Chemical Industry
- Metals & Steel
- Electronics
- Glass Manufacturing
Regional Insights
Asia Pacific Dominates the Hydrogen Generation Market with a Market Share of 37.2%, Valued at USD 69.28 Billion
Asia Pacific leads all regions with a 37.2% share worth USD 69.28 Billion in 2025, driven by China’s massive coal gasification base and Japan’s advanced hydrogen mobility programs. China alone accounted for approximately 60% of global electrolyzer manufacturing capacity in 2023, giving the region a cost and scale advantage in equipment supply that no other geography can match in the near term.
North America Market Trends
North America is accelerating hydrogen investment through a combination of federal tax policy and direct grants. The U.S. Treasury finalized Section 45V clean hydrogen tax credits in January 2025, unlocking multi-billion-dollar commitments across hydrogen hubs and electrolyzer projects. Planned U.S. electrolyzer projects totaled 4,524 MW of capacity, with expected annual output of approximately 0.72 million metric tonnes of hydrogen.
Europe Market Trends
Europe is pursuing the most ambitious hydrogen import and production targets globally. The European Union’s 2030 goal of 10 million tonnes of domestic renewable hydrogen plus 10 million tonnes of imports has mobilized EUR 18.8 billion in EU funding for renewable hydrogen projects. Germany is the most active national market, having increased electrolysis capacity by 68% to 111 MW in 2024 and committing EUR 24 billion to hydrogen backbone financing.
Latin America Market Trends
Latin America holds significant untapped potential as a low-cost renewable hydrogen production region. Countries with abundant solar and wind resources — particularly Chile and Brazil — are attracting export-oriented green hydrogen project interest from European and Asian off-takers seeking to meet their import targets. Infrastructure development and financing access remain the primary constraints on project timelines in this region.
Middle East & Africa Market Trends
The Middle East is repositioning existing fossil fuel export infrastructure toward hydrogen and its derivatives. Saudi Aramco and other national energy companies are studying large-scale blue and green hydrogen production using their low-cost energy base and proximity to Asian and European import markets. The region’s long-term role as a hydrogen exporter depends on how quickly import terminal infrastructure develops in target markets.
Key Regions and Countries
North America
- US
- Canada
Europe
- Germany
- France
- The UK
- Spain
- Italy
- Rest of Europe
Asia Pacific
- China
- Japan
- South Korea
- India
- Australia
- Rest of APAC
Latin America
- Brazil
- Mexico
- Rest of Latin America
Middle East & Africa
- GCC
- South Africa
- Rest of MEA
Regulatory Landscape
The U.S. Treasury finalized Section 45V Clean Hydrogen Production Tax Credit rules in January 2025. The rules require strict lifecycle emissions accounting, temporal matching, deliverability, and incrementality for projects to qualify. Meeting these standards determines whether a project receives up to USD 3 per kilogram in production incentives — making regulatory compliance a direct financial outcome, not just a legal obligation.
The U.S. also clarified Investment Tax Credit scope in December 2024 to include a broader range of hydrogen storage applications. This extension beyond production-stage support signals a policy intent to fund the full hydrogen value chain, reducing investor risk across storage, distribution, and end-use infrastructure segments. Projects that previously could not access federal support became eligible under the updated guidance.
The European Union maintained its 2030 renewable hydrogen targets under the Renewable Energy Directive framework, requiring member states to incorporate hydrogen production and import planning into national energy plans. Germany’s EUR 24 billion hydrogen backbone financing package reflects direct compliance with EU infrastructure mandates. EU-level targets are now creating enforceable national obligations that translate directly into project pipelines and procurement demand across member states.
At the global level, national hydrogen strategies grew from 23 in 2021 to 60 by 2024. This rapid spread of formal hydrogen policy frameworks is standardizing the regulatory environment across markets that previously had no hydrogen-specific rules, reducing entry barriers for multinational project developers and equipment suppliers operating across multiple jurisdictions.
Drivers
U.S. Section 45V Tax Credits and EU Renewable Hydrogen Targets Unlock Coordinated Multi-Billion-Dollar Investment Commitments Across Production and Infrastructure
The U.S. Treasury’s finalization of Section 45V clean hydrogen tax credits in January 2025 removed the policy uncertainty that had stalled investment decisions across North American hydrogen projects. By attaching production incentives of up to USD 3 per kilogram to verified low-emissions output, the rules converted a conditional opportunity into a fundable business case. This is the single most significant near-term catalyst for electrolyzer deployment and hydrogen hub development in the U.S. market.
On the European side, the EU’s 2030 mandate for 10 million tonnes of domestic renewable hydrogen production plus 10 million tonnes of imports has forced member states to fund infrastructure and sign offtake agreements at a pace that market forces alone would not have driven. EU funding of EUR 18.8 billion for renewable hydrogen projects creates a visible, funded demand pipeline for equipment and engineering providers operating in European markets.
Together, these two frameworks — one production-linked in the U.S. and one volume-targeted in the EU — are synchronizing the largest hydrogen investment cycles in history. Vendors who can qualify projects under both frameworks are positioned to capture disproportionate share of a global equipment market where supply chains are still catching up with committed demand.
Restraints
More Than 90% of Announced Projects Stuck in Early-Stage Development as Financing, Offtake, and Investment Decision Bottlenecks Persist
The headline project pipeline dramatically overstates near-term deliverable capacity. More than 90% of announced global hydrogen projects remain in early development stages, blocked by a combination of financing gaps, unresolved offtake agreements, and pending final investment decisions. Only 4% of announced global electrolyzer capacity had reached final investment decision or entered construction by 2024 — a conversion rate that signals systemic barriers, not temporary delays.
The compliance burden under the finalized U.S. 45V rules adds a further layer of friction. Requirements for strict lifecycle emissions accounting, temporal matching of renewable electricity to hydrogen production, deliverability verification, and incrementality assessments create a compliance architecture that smaller developers lack the capacity to navigate without specialist legal and technical support.
Research tracking 137 green hydrogen projects found that only 2% completed on schedule, a delivery record that raises serious questions about the reliability of announced timelines. For buyers building offtake commitments into supply chain plans, this execution risk translates into procurement uncertainty that pushes some toward conventional hydrogen sources even when they prefer low-emissions alternatives on principle.
Growth Factors
Gigawatt-Scale Electrolyzer Manufacturing Capacity and New Storage Tax Credit Coverage Materially Improve Green Hydrogen Project Economics
Global electrolyzer installation investment grew from USD 0.3 billion in 2021 to an estimated USD 7.0 billion in 2024. This roughly 23-fold increase in annual investment over three years reflects a step-change in capital commitment to electrolysis infrastructure, not incremental market growth. At this investment rate, the cost reduction curve for electrolyzers is accelerating — making green hydrogen cost-competitive with grey alternatives faster than most market forecasts assumed two years ago.
De Nora’s new Italian facility entered construction with a 2 GW/year annual production capacity and an existing order backlog, confirming that demand is already committed ahead of supply coming online. Similarly, approximately 6.5 GW of electrolyzer capacity reached final investment decision during the twelve months preceding October 2024, with Europe accounting for 32% of that total. These are not announced intentions — they are funded, under-construction projects that will generate installation revenue within the forecast window.
In November 2025, JSW Energy commissioned a green hydrogen facility and signed a long-term offtake arrangement with JSW Steel covering 3,800 TPA of green hydrogen and 30,000 TPA of green oxygen. Deals of this structure — where production and consumption are contracted together — provide the project-level revenue certainty that unlocks project financing, creating a replicable commercial model for other steel decarbonization partnerships globally.
Emerging Trends
Electrolyzer Manufacturing Localization and PEM Technology Scale-Up Are Reshaping Equipment Supply Chains and Operator Cost Structures
The global electrolyzer development pipeline reached 1.2 TW of capacity, with 55.2 GW of new projects added within just six months during 2024. This rate of pipeline expansion — averaging roughly 9 GW of new projects per month — confirms that announced capacity is not slowing despite conversion rates remaining low. The implication for equipment vendors is that the order book will remain large even as many projects are delayed or restructured.
Regional manufacturing localization is accelerating as governments attach domestic content requirements to production incentives. New gigafactories in India, Europe, and Australia are individually targeting more than 2 GW of annual output, creating geographically distributed supply chains that reduce exposure to single-region manufacturing concentration. In 2023, China held approximately 60% of global electrolyzer manufacturing capacity — a share that localization trends are actively working to reduce as importing regions seek to build domestic industrial bases.
The shift toward high-efficiency PEM electrolyzer technology is redefining performance benchmarks for commercial operators. In May 2025, Plug Power announced that its Georgia plant produced 300 metric tons of liquid hydrogen in April 2025 using its proprietary GenEco PEM technology — a new U.S. production benchmark. Multi-megawatt PEM systems across industrial, mobility, and export projects are proving that PEM is no longer a premium-price niche technology but a commercially scalable platform capable of setting national production records.
Research Methodology Framework and Report Scope
Market Definitions and Key Coverage
Our study defines the global hydrogen generation market as every technology, process, and system employed in the commercial and industrial production of hydrogen gas across all feedstock sources and production pathways. Covered categories include green hydrogen generation via proton exchange membrane (PEM) and alkaline electrolyzers powered by renewable energy, blue hydrogen production through steam methane reforming (SMR) and autothermal reforming (ATR) with carbon capture and storage (CCS), grey hydrogen from natural gas reforming without carbon abatement, coal gasification-based hydrogen production, biomass gasification systems, and emerging thermochemical and photoelectrochemical generation technologies.
All market values are expressed in constant 2025 US dollars to eliminate currency-driven distortions and enable consistent cross-regional and cross-technology comparability.
We exclude hydrogen purification, compression, storage, and distribution infrastructure where generation is not the primary commercial activity, hydrogen derivative products such as ammonia, methanol, and synthetic fuels where hydrogen serves solely as an intermediate input, end-use applications including fuel cell vehicles, industrial burners, and power generation equipment, standalone hydrogen monitoring and simulation software platforms, and pre-commercial laboratory-scale generation technologies that have not achieved demonstrated pilot or commercial-stage deployment.
Key Companies Insights
Air Liquide S.A. operates one of the world’s largest hydrogen production and distribution networks, serving industrial customers across chemicals, refining, and mobility. The company’s integrated model — covering production, storage, and on-site supply — allows it to offer buyers full supply chain solutions rather than point-source hydrogen.
Linde plc combines large-scale industrial gas production with proprietary electrolyzer technology and hydrogen fueling infrastructure. Its ability to serve both legacy industrial hydrogen demand and emerging green hydrogen applications makes it less exposed to technology transition risk than pure-play vendors.
Air Products and Chemicals, Inc. has committed to some of the largest green hydrogen megaprojects globally, including export-oriented facilities in the Middle East and North America. Its strategy centers on owning the production asset rather than just supplying the equipment — a higher-capital approach that generates long-term contracted revenue streams but concentrates project execution risk.
Messer Group GmbH focuses on European and Asian industrial gas markets with a strong emphasis on specialty applications including electronics, glass, and metals. Its customer base skews toward high-purity hydrogen segments where switching costs are high and relationships are sticky.
Key Companies
- Air Liquide S.A.
- Linde plc
- Air Products and Chemicals, Inc.
- Messer Group GmbH
- INOX Air Products Ltd.
- Iwatani Corporation
- Cummins Inc.
- Nel ASA
- Taiyo Nippon Sanso Corporation
- Matheson Tri-Gas, Inc.
- Sinopec
- Shell plc
- Saudi Arabian Oil Company (Aramco)
- McPhy Energy S.A.
- ITM Power PLC
- Siemens Energy AG
- Plug Power Inc.
Recent Industry Developments
- In March 2025, ANDRITZ and HydrogenPro advanced their collaboration through a planned 100 MW green hydrogen project in Rostock, Germany, where ANDRITZ intends to supply the plant on an EPC basis using HydrogenPro’s pressurized alkaline electrolyzer technology.
- In April 2025, VNG announced plans to begin test operations of a 30 MW electrolyzer facility in Bad Lauchstaedt, Germany during Q3 2025, supplying green hydrogen to the Leuna chemicals and oil park.
- In May 2025, Plug Power announced that its Georgia hydrogen plant produced 300 metric tons of liquid hydrogen during April 2025, establishing a new U.S. production benchmark using the company’s proprietary GenEco PEM electrolyzer technology.
- In November 2025, JSW Energy commissioned a green hydrogen facility and signed a long-term offtake arrangement with JSW Steel covering 3,800 TPA of green hydrogen and 30,000 TPA of green oxygen, alongside an MoU targeting significantly larger volumes by 2030.
Market Scope
| Report Features | Description |
|---|---|
| Market Value (2025) | USD 186.24 Billion |
| Forecast Revenue (2035) | USD 516.26 Billion |
| CAGR (2026-2035) | 10.74% |
| Base Year for Estimation | 2025 |
| Historic Period | 2020-2024 |
| Forecast Period | 2026-2035 |
| Report Coverage | Revenue Forecast, Market Dynamics, Competitive Landscape, Recent Developments |
| Segments Covered | By Systems Type (Captive Generation, Merchant Generation), By Technology (Coal Gasification, Steam Methane Reforming, Electrolysis, Partial Oxidation), By Raw Material (Coal, Natural Gas, Water, Biomass), By Application (Ammonia Production, Methanol Production, Petroleum Refinery, Transportation, Power Generation, Others), By Distribution Channel (Pipeline, Cylinder, Merchant/Bulk Delivery, On-site Supply), By End-User (Chemical Industry, Metals & Steel, Electronics, Glass Manufacturing) |
| Regional Analysis | North America (US and Canada), Europe (Germany, France, The UK, Spain, Italy, and Rest of Europe), Asia Pacific (China, Japan, South Korea, India, Australia, and Rest of APAC), Latin America (Brazil, Mexico, and Rest of Latin America), Middle East & Africa (GCC, South Africa, and Rest of MEA) |
| Competitive Landscape | Air Liquide S.A., Linde plc, Air Products and Chemicals, Inc., Messer Group GmbH, INOX Air Products Ltd., Iwatani Corporation, Cummins Inc., Nel ASA, Taiyo Nippon Sanso Corporation, Matheson Tri-Gas, Inc., Sinopec, Shell plc, Saudi Arabian Oil Company (Aramco), McPhy Energy S.A., ITM Power PLC, Siemens Energy AG, Plug Power Inc. |
| Customization Scope | Customization for segments, region/country-level will be provided. Moreover, additional customization can be done based on the requirements. |
| Purchase Options | We have three licenses to opt for: Single User License, Multi-User License (Up to 5 Users), Corporate Use License (Unlimited User and Printable PDF) |