What is the Renewable Diesel Market Size?
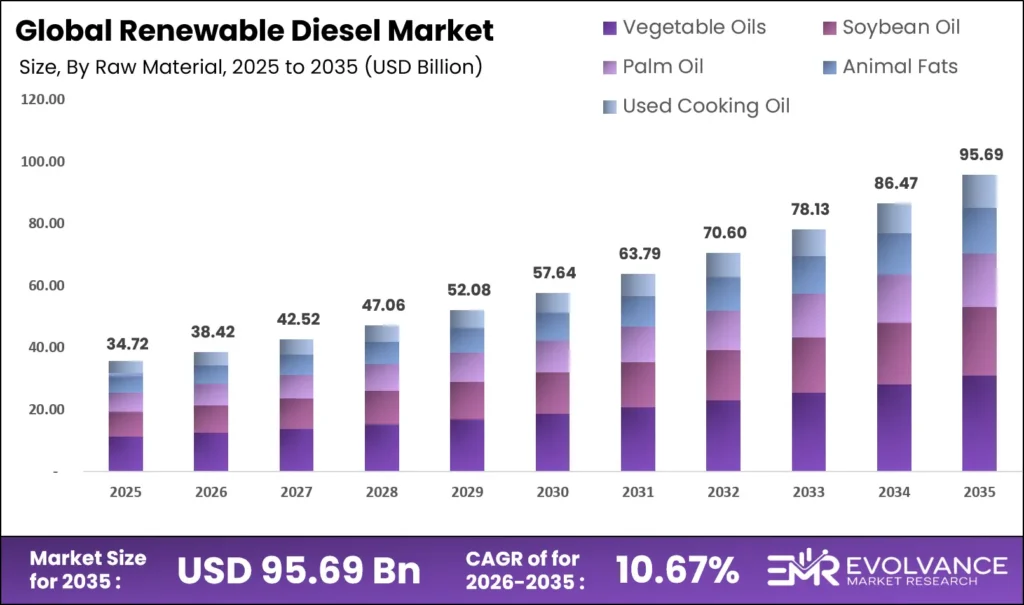
The Global Renewable Diesel Market size will be worth around USD 95.69 Billion by 2035 from USD 34.72 Billion in 2025, growing at a CAGR of 10.67% during the forecast period 2026 to 2035. Regulatory mandates including U.S. EPA volume obligations and the EU’s RED III greenhouse gas targets are locking in refinery compliance spending that would otherwise stay discretionary. Fleet operators and airlines are signing long-term offtake deals as carbon credit prices make renewable diesel financially attractive over petroleum diesel. However, feedstock supply constraints and catalyst shortages are already compressing producer margins and cutting effective plant run rates.
Market Highlights
- North America leads with a 47.2% market share, valued at USD 16.38 Billion.
- Vegetable Oils dominate the By Raw Material segment with a 63.1% share.
- Pure Renewable Diesel (HVO100) leads the By Type segment with a 54.5% share.
- Oil Refineries and Blenders account for 53.6% of the By Industry Vertical segment.
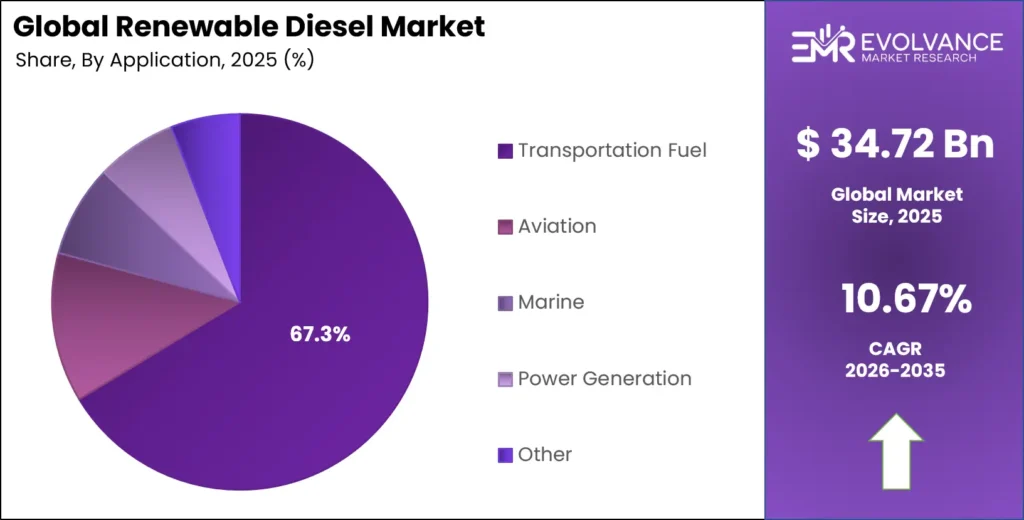
- Transportation Fuel holds a 67.3% share in the By Application segment.
- Hydrotreating leads the By Production Technology segment with 48.9% share.
Market Overview
Renewable diesel is a drop-in replacement for petroleum diesel. It is produced by treating biological feedstocks including vegetable oils, animal fats, and used cooking oil through hydrotreating or other thermal processes. Unlike biodiesel, it meets ASTM D975 diesel specs without blending limits, allowing fleet operators to switch fuels without engine modifications.
The market covers pure renewable diesel (HVO100), blended grades, and co-processed variants. End users span road transport, marine shipping, power generation, and aviation through sustainable aviation fuel (SAF). Each segment carries different carbon-intensity requirements, credit values, and procurement timelines, making feedstock selection and carbon scoring central to producer strategy.
Policy frameworks have moved from voluntary targets to hard mandates. The EU’s RED III directive enforces a 14.5% transport greenhouse gas reduction by 2035, locking in multi-year offtake agreements with refiners. U.S. Renewable Volume Obligations require 6.8 billion gallons of advanced sustainable biofuel blending by 2026, forcing compliance spending regardless of oil price cycles. These mandates reduce demand uncertainty for producers and support long-term capital investment.
According to the U.S. Energy Information Administration, total U.S. renewable diesel and related renewable fuel production capacity reached 4,719 million gallons per year as of January 2025. This is not just a supply milestone it signals that the U.S. industry has crossed the threshold where renewable diesel is a mainstream infrastructure input, not a niche product. Producers with cost-efficient feedstock access will capture margin before new capacity tightens spreads.
The Clean Fuels Alliance America, renewable diesel and biodiesel reduce greenhouse-gas emissions by more than 70% on average compared with petroleum diesel. This performance gap is decisive in markets where carbon credit revenue is a second income stream. Producers who can certify lower carbon intensity pathways particularly below 15 gCO2e/MJ will command premium pricing in California and EU-regulated channels. In April 2024, Phillips 66 advanced its Rodeo Renewable Energy Complex, achieving approximately 30,000 barrels/day of renewable diesel output, signaling how quickly scale advantages are concentrating among well-capitalized players.
Raw Material Insights
Vegetable Oils dominate with 63.1% due to established supply chains and refinery compatibility.
In 2025, Vegetable Oils held a dominant position in the By Raw Material segment of the Renewable Diesel Market, with a 63.1% share. This dominance reflects decades of commodity infrastructure built around soybean and palm oil storage, crushing, and logistics networks that renewable diesel producers can use without new capital.
Soybean Oil is the primary feedstock for U.S. producers because domestic crush capacity has expanded to meet biofuel demand. Fifteen new crush facilities are currently under construction, shifting soybean oil from export markets to domestic biofuel supply chains. This structural shift reduces import dependency but also tightens soybean oil availability for food processors, creating price tension that will affect renewable diesel production costs through the forecast period.
Animal Fats carry lower carbon intensities than virgin vegetable oils, making them valuable for producers targeting California LCFS credits or EU incentive tiers. Their supply is inelastic tied to meat processing volumes so competition for animal fat feedstocks is intensifying as more producers pursue premium carbon scores. Buyers who secure long-term animal fat supply contracts now face a structural cost advantage later.
Type Insights
Pure Renewable Diesel (HVO100) dominates with 54.5% due to full fuel specification compliance without blending constraints.
In 2025, Pure Renewable Diesel (HVO100) held a dominant market position in the By Type segment of the Renewable Diesel Market, with a 54.5% share. Its advantage is structural: HVO100 meets ASTM D975 without any blending requirement, letting fleet operators switch fuels without engine or infrastructure changes. This zero-friction adoption path is why commercial fleets which cannot tolerate downtime favor HVO100 over blended alternatives when price parity is achievable.
Renewable Diesel Blends serve as entry-level carbon compliance tools for fleets not ready to commit to full HVO100 pricing. Blends allow refiners to stretch limited pure renewable diesel supply across a wider customer base, preserving margin by mixing with cheaper petroleum diesel. However, blend economics shift as carbon credit prices rise the California LCFS credit floor of $200 per MT creates a $2.00+ per gallon premium that makes pure grades financially attractive for credit-generating buyers.
Other type variants include emerging thermochemical pathways and blendstocks produced via pyrolysis or gasification. These routes are not yet commercially dominant but are attracting R&D investment because they can process lower-cost waste feedstocks that hydrotreating cannot handle. Their commercial viability will depend on how quickly producers can reduce per-gallon production costs to compete with established hydrotreating economics.
Industry Vertical Insights
Oil Refineries and Blenders dominate with 53.6% due to existing infrastructure and compliance-driven conversion investments.
In 2025, Oil Refineries and Blenders held a dominant market position in the By Industry Vertical segment of the Renewable Diesel Market, with a 53.6% share. Their dominance is structural refiners already own the hydrotreating units, storage, and distribution networks that renewable diesel production requires. Imperial Oil’s completion of the Strathcona facility in Alberta targeting 20,000 barrels per day at full capacity shows how major refinery owners are converting assets rather than building greenfield plants.
Airlines are the fastest-shifting vertical as sustainable aviation fuel (SAF) mandates emerge in the EU and corporate decarbonization targets drive airline procurement decisions. Renewable diesel processed into SAF at facilities like Phillips 66’s Rodeo complex which has initial SAF output of approximately 150 million gallons per year is moving airlines from voluntary purchases to mandatory offtake agreements. Airlines that lock in long-term SAF supply contracts now face lower price risk as mandates tighten after 2027.
Application Insights
Transportation Fuel dominates with 67.3% due to scale of road fleet demand and direct fuel specification compatibility.
In 2025, Transportation Fuel held a dominant market position in the By Application segment of the Renewable Diesel Market, with a 67.3% share. Road transport produces the largest single pool of diesel demand, and HVO100’s drop-in compatibility means adoption requires no new infrastructure. U.S. renewable diesel production averaged approximately 170,000 barrels per day in Q1 2025, with the majority flowing to road transport. The gap between capacity and output production fell 12% year-over-year despite capacity growing 20% points to feedstock and catalyst constraints, not demand weakness, as the binding limit on transportation fuel supply growth.
Aviation (Sustainable Aviation Fuel – SAF) is the segment where premium pricing is most defensible. Airlines pay above-market prices for certified low-carbon SAF because no electrification alternative exists for long-haul flight. Renewable diesel’s 75% well-to-wake carbon intensity reduction gives it a clear compliance argument in EU ETS and CORSIA frameworks. Producers who can certify sub-15 gCO2e/MJ pathways using green hydrogen in hydrotreating or ultra-low-carbon feedstocks will command the highest SAF price premiums available in the market.
Marine fuel use is growing as IMO 2020-compliant shipping fleets target 0.1% sulfur caps and the International Maritime Organization’s 2050 net-zero ambition pressures ship owners to act earlier than regulators require. Renewable diesel’s naturally low sulfur content and direct compatibility with existing marine engines makes it one of the few scalable decarbonization fuels available to the shipping sector today, without vessel retrofits.
Production Technology Insights
Hydrotreating dominates with 48.9% due to commercial maturity and compatibility with existing refinery assets.
In 2025, Hydrotreating held a dominant market position in the By Production Technology segment of the Renewable Diesel Market, with a 48.9% share. Hydrotreating is the only pathway currently operating at commercial scale with proven cost curves and established catalyst supply chains. However, catalyst scarcity is extending plant maintenance turnarounds to 45 to 60 days and pushing annual effective operating rates below 85%. This is not a temporary problem it signals that catalyst manufacturers have not scaled procurement to match the speed of new plant construction, creating a hidden constraint on effective capacity utilization.
Gasification converts solid waste biomass including agricultural residues and municipal solid waste into synthesis gas, which is then processed into diesel-range hydrocarbons. Gasification opens feedstock options that hydrotreating cannot access, but higher capital costs and process complexity mean commercial scale projects are limited. Producers pursuing gasification are betting on long-term feedstock diversification as vegetable oil prices remain volatile.
Pyrolysis converts biomass or plastic waste into bio-oil that can be upgraded into renewable diesel. It appeals to producers looking to monetize low-cost waste streams, but pyrolysis bio-oil requires significant upgrading before it meets fuel specs. Green hydrogen integration into pyrolysis upgrading a pathway that can achieve sub-15 gCO2e/MJ carbon intensities is attracting investment from producers targeting California and EU premium markets.
Market Segments Covered in the Report
By Raw Material
- Vegetable Oils
- Soybean Oil
- Palm Oil
- Animal Fats
- Used Cooking Oil
By Type
- Pure Renewable Diesel (HVO100)
- Renewable Diesel Blends
- Co-processed Renewable Diesel
- Other
By Industry Vertical
- Oil Refineries and Blenders
- Airlines
By Application
- Transportation Fuel
- Aviation (Sustainable Aviation Fuel – SAF)
- Marine
- Power Generation
- Other
By Production Technology
- Hydrotreating
- Gasification
- Pyrolysis
- Other
Regional Insights
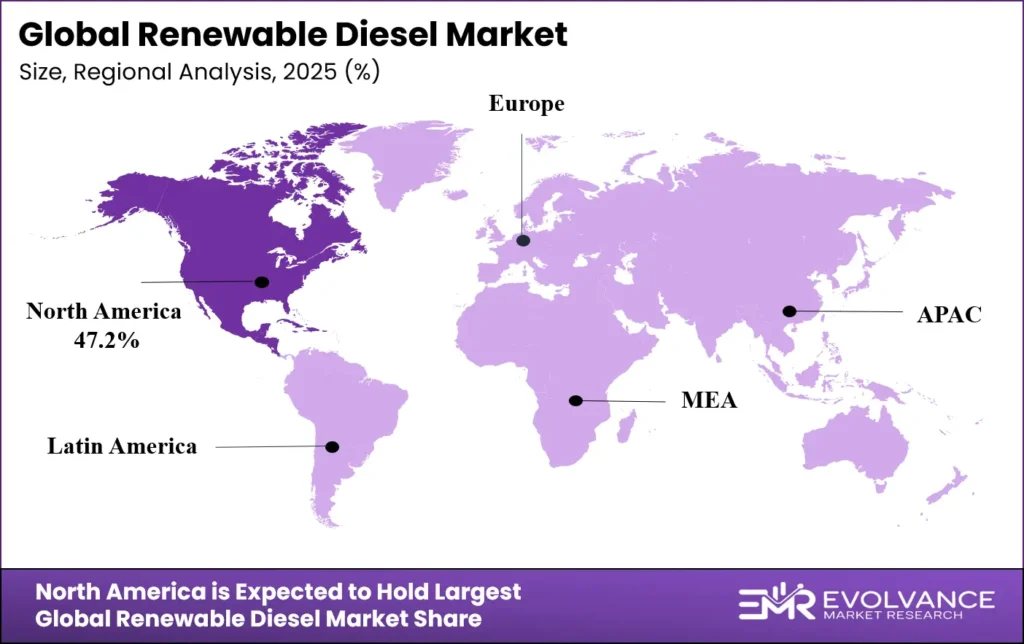
North America Dominates the Renewable Diesel Market with a Market Share of 47.2%, Valued at USD 16.38 Billion
North America leads with a 47.2% share, valued at USD 16.38 Billion in 2025. The region’s dominance reflects a combination of hard regulatory mandates including U.S. EPA Renewable Volume Obligations and California’s LCFS credit floor of $200 per MT and the fastest-expanding production base globally. The U.S. alone operated 19 renewable diesel plants with total capacity of 4,719 million gallons per year as of January 2025, giving North American producers a scale advantage that will be difficult for other regions to close before 2030.
Europe Market Trends
Europe is the second-largest market, driven by the EU’s RED III mandate enforcing a 14.5% transport greenhouse gas reduction target by 2035. Member states are implementing national blending obligations that lock in long-term refiner demand. Sweden’s Preem AB and Spain’s Repsol are converting conventional refinery capacity to renewable diesel, reflecting a region-wide structural shift that extends well beyond voluntary corporate targets.
Asia Pacific Market Trends
Asia Pacific is the most dynamic growth region, with Japan, South Korea, and Australia emerging as active renewable diesel importers. In October 2024, a consortium including ITOCHU and INPEX commenced commercial production and supply of RD40 renewable diesel in Japan, marking a direct entry into fleet transport markets. Southeast Asia presents a supply-side constraint as Indonesia and Malaysia tighten palm oil exports to protect domestic B35 and B40 mandates.
Middle East & Africa Market Trends
The Middle East and Africa currently represent a small share of renewable diesel demand, but GCC producers are exploring co-processing opportunities within their large petroleum refinery complexes. The region’s lack of binding carbon mandates slows adoption, but export-oriented producers particularly in the UAE are investing in renewable fuel capabilities to meet the regulatory requirements of their European and Asian export markets.
Key Regions and Countries
North America
- US
- Canada
Europe
- Germany
- France
- The UK
- Spain
- Italy
- Rest of Europe
Asia Pacific
- China
- Japan
- South Korea
- India
- Australia
- Rest of APAC
Latin America
- Brazil
- Mexico
- Rest of Latin America
Middle East & Africa
- GCC
- South Africa
- Rest of MEA
Regulatory Landscape
The U.S. EPA’s Renewable Fuel Standard sets Renewable Volume Obligations requiring 6.8 billion gallons of advanced biofuel blending by 2026. Refiners who fail to meet these volumes must purchase Renewable Identification Numbers (RINs) at market prices. The U.S. industry generated approximately 5.03 billion RINs in 2025, down 16% from 2024 a shortfall that tightened RIN prices and increased compliance costs for non-producing obligated parties.
California’s Low Carbon Fuel Standard, administered by CARB, sets a credit price floor of $200 per metric ton of CO2 equivalent. This translates to a structural $2.00+ per gallon price premium for renewable diesel over petroleum diesel in the California market. Producers who can certify carbon intensities below 15 gCO2e/MJ using green hydrogen or ultra-low-carbon feedstocks qualify for the highest credit tiers, creating a direct financial return on low-carbon technology investment.
The EU’s Renewable Energy Directive RED III, effective from 2023 with 2035 compliance targets, mandates a 14.5% reduction in transport greenhouse gas intensity. Member states must transpose these targets into national blending obligations by 2025. The directive also sets sustainability criteria for feedstock certification, which directly affects which feedstocks qualify for compliance credit restricting high-ILUC palm oil and tightening rules on waste-based feedstock verification.
Drivers
Mandatory Blending Volumes and Carbon Credit Floors Lock In Refinery Capital Spending on Renewable Diesel Capacity
The U.S. EPA’s Renewable Volume Obligation mandates 6.8 billion gallons of advanced biofuel blending by 2026. Refiners who cannot blend face open-market RIN purchases that cost more than compliance infrastructure. This regulatory arithmetic is converting discretionary capital spending into mandatory investment, removing demand uncertainty that would otherwise delay production decisions.
California’s LCFS credit floor of $200 per metric ton adds a structural $2.00+ per gallon revenue premium on top of fuel sales revenue. This premium exists independent of oil price movements, making renewable diesel financially attractive to produce even when petroleum diesel margins are thin. Gevo’s $210 million acquisition of Red Trail Energy’s ethanol and carbon sequestration assets in September 2024 shows how producers are acquiring low-carbon infrastructure specifically to qualify for these premium credit tiers.
The EU’s RED III greenhouse gas reduction target of 14.5% by 2035 is driving long-term offtake agreements between European fuel retailers and renewable diesel producers. These multi-year contracts reduce volume risk for producers and justify large capital commitments for new capacity. Twelve new standalone renewable diesel facilities have been announced across the U.S. Gulf Coast and Singapore since 2023, each underwritten by the expectation that regulatory mandates will sustain demand through the contract period.
Restraints
Feedstock Price Inflation and Catalyst Shortages Compress Producer Margins and Cut Effective Plant Run Rates
Corn oil prices rose 40% and used cooking oil prices rose 25% over 24 months as more renewable diesel producers competed for the same feedstock pool. This inflation is not cyclical it reflects a structural supply-demand imbalance where feedstock capacity expansion lags renewable diesel plant construction. Producers without long-term feedstock supply agreements face margin erosion that worsens as more capacity comes online.
Hydrotreating catalyst scarcity is extending plant maintenance shutdowns to 45 to 60 days per cycle, pushing annual effective operating rates below 85%. This is a hidden capacity constraint that does not appear in nameplate capacity figures. U.S. renewable diesel production in Q1 2025 was 25% lower than Q4 2024, partly reflecting these maintenance pressures a direct signal that nominal capacity numbers overstate deliverable output in the near term.
The combination of feedstock inflation and catalyst downtime compresses the economics for smaller, single-asset producers who cannot spread fixed costs across multiple facilities. As feedstock procurement and catalyst supply chains favor large integrated producers with purchasing power, the market is structurally favoring consolidation. Independent producers without scale advantages face a narrowing window before margin pressure forces asset sales or operational changes.
Growth Factors
Co-Processing Agreements and Alternative Feedstock Development Expand Profitable Production at Lower Capital Cost
Co-processing agreements allow conventional refiners to inject bio-feedstocks into existing FCC units, converting 50,000 to 100,000 barrels per day of underutilized refinery capacity into renewable diesel output. This approach requires far less capital than greenfield plants, enabling mid-sized refiners to enter the market without the multi-billion-dollar commitments that standalone facilities require. It also absorbs stranded refinery assets that would otherwise face closure as petroleum fuel demand declines.
Non-soy and non-corn feedstock development on pennycress and camelina crops across more than 2 million fallow U.S. farm acres offers a path to lower-cost, domestically controlled supply. Global Clean Energy Holdings secured a $75 million revolving credit facility in June 2024 specifically to advance its alternative feedstock renewable fuels project in Bakersfield, California demonstrating that capital markets are backing non-traditional supply chains that reduce price exposure to commodity markets.
Green hydrogen integration into hydrotreating processes can push carbon intensities below 15 gCO2e/MJ, unlocking the highest credit tiers under California’s LCFS and the EU’s premium feedstock classifications. At Rodeo, a 30.2-megawatt solar facility entered commercial operation in 2025, cutting grid electricity demand by 50% and avoiding approximately 33,000 metric tons of CO2 annually. This shows how energy integration not just feedstock switching is becoming a competitive tool for producers targeting premium carbon scores.
Emerging Trends
North American Capacity Expansion and Carbon Intensity Scoring Create a Two-Tier Market Between Premium and Commodity Producers
North American renewable diesel production capacity is on track to triple from 3.4 billion to 10.5 billion gallons annually between 2023 and 2027. The U.S. alone expanded capacity from 4,580 million gallons in January 2025 to 5,014 million gallons by November 2025. This pace of supply growth will commoditize standard-grade renewable diesel, narrowing margins for producers who cannot differentiate on carbon intensity or feedstock certification.
The Biden Administration’s 45Z Clean Fuel Production Tax Credit creates a quarter-by-quarter carbon intensity scoring race. Producers who optimize carbon scores more frequently and across more production assets will accumulate higher credits per gallon, funding further technology investment. Those who treat carbon scoring as an annual compliance exercise rather than a continuous operating variable will fall behind peers who embed carbon intensity management into daily production decisions.
Marine bunker fuel conversion is taking shape as a distinct growth channel. IMO 2020-compliant fleets targeting 0.1% sulfur caps are using renewable diesel as a low-friction compliance fuel, since it requires no vessel modification. Renewable diesel’s 75% well-to-wake carbon intensity reduction positions it as a bridge fuel while methanol and ammonia marine alternatives develop at commercial scale giving producers a multi-year demand window in marine applications before next-generation marine fuels reach cost parity.
Research Methodology Framework and Report Scope
Market Definitions and Key Coverage
This report covers the global renewable diesel market, defined as hydrocarbon-based diesel fuel produced from biological feedstocks through hydrotreating, gasification, or pyrolysis processes. Included categories span pure renewable diesel (HVO100), renewable diesel blends, and co-processed renewable diesel across all end-use applications including road transport, aviation (SAF), marine, and power generation. Market values are stated in constant U.S. dollars with 2025 as the base year, eliminating currency fluctuation effects on multi-year comparisons. The report covers both feedstock types (vegetable oils, animal fats, used cooking oil) and production technologies, with revenue attributed at the point of fuel sale.
This report excludes first-generation biodiesel (FAME/B100) produced via transesterification, which has different fuel specifications and regulatory treatment. It does not cover ethanol-to-jet fuel pathways, hydrogen-derived synthetic fuels, or electrofuels (e-fuels) that do not use biological feedstocks. Software platforms for carbon credit management, standalone feedstock trading, and agricultural input markets upstream of feedstock production are also out of scope. The geographic scope covers North America, Europe, Asia Pacific, Latin America, and the Middle East and Africa.
Key Companies Insights
Neste holds the strongest carbon-intensity positioning in the global renewable diesel market. Its MY Renewable Diesel product achieves lifecycle greenhouse-gas reductions of more than 60%, and in certain pathways up to 75%, compared with fossil diesel. Neste’s R99 certification produced from 100% renewable raw materials gives it direct access to the highest LCFS and EU credit tiers. Its feedstock diversification strategy, which spreads procurement across waste fats, UCO, and vegetable oils, reduces its exposure to any single commodity price spike. This approach positions Neste as the benchmark for carbon performance among large-scale producers.
Valero Energy Corporation operates Diamond Green Diesel as its primary renewable diesel vehicle, one of the largest standalone renewable diesel producers in the United States. Valero’s competitive advantage lies in integrating renewable diesel production with existing refinery logistics shared storage, blending terminals, and distribution networks that reduce per-gallon operating costs versus pure-play renewable fuel companies. This infrastructure advantage allows Valero to compete on cost in standard-grade renewable diesel markets while its scale generates RIN volumes that independent producers cannot match.
Marathon Petroleum Corporation has positioned its renewable diesel assets within a broader refinery conversion strategy, co-processing bio-feedstocks in existing units to minimize capital outlay. Marathon’s approach reflects a calculated bet that co-processing economics will outperform dedicated plants as feedstock prices remain elevated. By spreading renewable diesel production across multiple refinery sites rather than concentrating it in one flagship facility, Marathon reduces single-asset operational risk while maintaining flexibility to scale output based on feedstock availability and credit market conditions.
Chevron Corporation is advancing renewable diesel through technology investment focused on green hydrogen integration and feedstock innovation. Its partnership approach working with agricultural and waste feedstock suppliers to develop lower-carbon input streams targets the sub-15 gCO2e/MJ threshold that unlocks premium California and EU credits. Chevron’s scale in petroleum refining gives it access to hydrogen infrastructure that smaller renewable diesel producers cannot replicate, making green hydrogen co-processing a realistic near-term competitive tool rather than a long-term R&D aspiration.
Key Companies
- Neste
- Valero Energy Corporation
- Marathon Petroleum Corporation
- Chevron Corporation
- Phillips 66
- BP
- Shell
- Diamond Green Diesel
- World Energy
- REG (Renewable Energy Group)
- TotalEnergies
- Repsol
- Preem AB
- Cargill
- Eni
- Gevo
- Imperial Oil
- Petrobras
Recent Industry Developments
- In 2025, Imperial Oil completed its major investment in the Strathcona renewable diesel facility in Alberta. The plant reached commercial production and is expected to become Canada’s largest renewable diesel facility at full capacity of 20,000 barrels per day.
- In September 2025, Shell launched Shell Renewable Diesel and Renewable Diesel Blend R33 in Hong Kong. The move expanded commercial availability of low-carbon diesel alternatives for fleet operators in the Asia Pacific region.
- In October 2024, ITOCHU, ITOCHU ENEX, INPEX, and partners commenced commercial production and supply of RD40 renewable diesel fuel in Japan. The launch expanded renewable diesel deployment across transportation applications in the Japanese market.
- In September 2024, Gevo announced a $210 million acquisition of Red Trail Energy’s ethanol and carbon sequestration assets. The deal strengthened Gevo’s feedstock capabilities and low-carbon fuel production supporting renewable fuels output.
- In June 2024, Global Clean Energy Holdings secured a new $75 million revolving credit facility from Vitol. The financing supported restructuring of arrangements tied to its renewable fuels project in Bakersfield, California.
Market Scope
| Report Features | Description |
|---|---|
| Market Value (2025) | USD 34.72 Billion |
| Forecast Revenue (2035) | USD 95.69 Billion |
| CAGR (2026-2035) | 10.67% |
| Base Year for Estimation | 2025 |
| Historic Period | 2020-2024 |
| Forecast Period | 2026-2035 |
| Report Coverage | Revenue Forecast, Market Dynamics, Competitive Landscape, Recent Developments |
| Segments Covered | By Raw Material (Vegetable Oils, Animal Fats, Used Cooking Oil), By Type (Pure Renewable Diesel HVO100, Renewable Diesel Blends, Co-processed Renewable Diesel, Other), By Industry Vertical (Oil Refineries and Blenders, Airlines), By Application (Transportation Fuel, Aviation SAF, Marine, Power Generation, Other), By Production Technology (Hydrotreating, Gasification, Pyrolysis, Other) |
| Regional Analysis | North America (US and Canada), Europe (Germany, France, The UK, Spain, Italy, and Rest of Europe), Asia Pacific (China, Japan, South Korea, India, Australia, and Rest of APAC), Latin America (Brazil, Mexico, and Rest of Latin America), Middle East & Africa (GCC, South Africa, and Rest of MEA) |
| Competitive Landscape | Neste, Valero Energy Corporation, Marathon Petroleum Corporation, Chevron Corporation, Phillips 66, BP, Shell, Diamond Green Diesel, World Energy, REG (Renewable Energy Group), TotalEnergies, Repsol, Preem AB, Cargill, Eni, Gevo, Imperial Oil, Petrobras |
| Customization Scope | Customization for segments, region/country-level will be provided. Moreover, additional customization can be done based on the requirements. |
| Purchase Options | We have three licenses to opt for: Single User License, Multi-User License (Up to 5 Users), Corporate Use License (Unlimited User and Printable PDF) |