What is the Sustainable Biofuels Market Size?
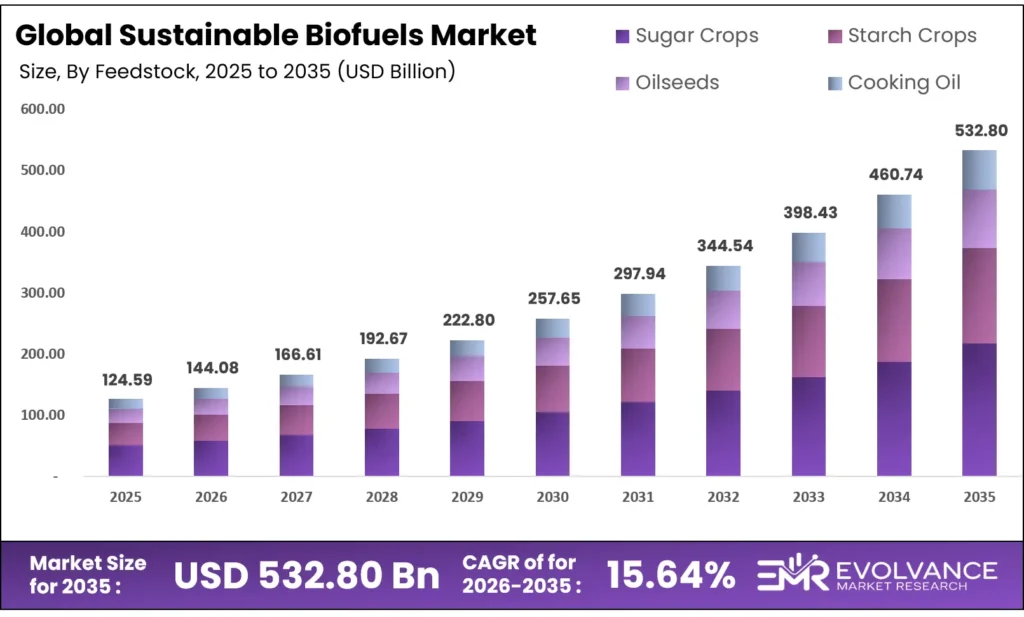
The Global Sustainable Biofuels Market size will be worth around USD 532.80 Billion by 2035 from USD 124.59 Billion in 2025, growing at a CAGR of 15.64% during the forecast period 2026 to 2035. Low-carbon fuel mandates and aviation sector blending requirements are pulling procurement decisions toward certified biofuel supplies. Corporate net-zero timelines are redirecting offtake contracts away from fossil fuels and toward verified sustainable alternatives. Feedstock competition from food and feed markets, however, introduces cost pressure that smaller producers may struggle to absorb.
Market Highlights
- The global sustainable biofuels market will grow from USD 124.59 Billion in 2025 to USD 532.80 Billion by 2035, at a CAGR of 15.64%.
- North America leads all regions with a 38.6% market share, valued at USD 48.09 Billion in 2025.
- Sugar Crops dominate the feedstock segment with a 40.3% share.
- Liquid form leads product form at 46.3%.
- Bioethanol leads fuel type at 42.1%.
- Biochemical Conversion leads technology at 47.6%.
- Lignocellulosic Biomass leads material type at 37.2%.
- Transportation leads industry verticals at 53.7%.
Market Overview
The sustainable biofuels market covers fuels derived from biological feedstocks that meet certified carbon reduction thresholds. This includes bioethanol, biodiesel, biogas, biojet fuel, biobutanol, bio-oil, and syngas produced from crops, waste oils, algae, and lignocellulosic biomass. The market serves transport, power, heating, and industrial energy buyers seeking fossil fuel alternatives tied to measurable carbon outcomes.
These fuels differ from conventional biofuels in one critical way: lifecycle emissions certification. Buyers in regulated sectors must document carbon savings from feedstock to combustion. This verification requirement raises the bar for suppliers and filters out low-quality producers, which concentrates market value among certified, traceable supply chains. That dynamic rewards early movers who built compliance infrastructure ahead of mandates.
Government mandates across major economies are setting hard floor volumes for sustainable fuel use. The European Union’s ReFuelEU Aviation Regulation set a mandatory blending requirement, and national-level renewable energy fuel standards in the US have scaled cellulosic and advanced biofuel volumes to commercially significant levels. These rules remove discretionary purchasing from the equation buyers must comply or face penalties.
According to the International Air Transport Association, sustainable aviation fuels can cut lifecycle CO₂ emissions by up to 80% compared with conventional jet fuel. This matters because aviation faces the steepest decarbonization pressure of any transport mode, and biofuels represent the only drop-in option at scale today. As per IATA, SAF could deliver roughly 65% of the emissions cuts aviation needs to reach net-zero by 2050, giving this fuel category a structural role that synthetic alternatives cannot yet match at cost.
The International Civil Aviation Organization approved updates to CORSIA eligible fuel guidance, including changes to sustainable fuel methods and eligibility rules. These updates tighten the compliance framework for international aviation biofuel use, signaling that regulators are moving toward stricter traceability standards a shift that will pressure marginal producers while benefiting certified suppliers with auditable feedstock sourcing.
Feedstock Insights
Sugar Crops (Sugarcane, Sugar Beet) dominate with 40.3% due to established fermentation infrastructure and proven ethanol yield economics.
In 2025, Sugar Crops (Sugarcane, Sugar Beet) held a dominant market position in the By Feedstock segment of the Sustainable Biofuels Market, with a 40.3% share. Sugarcane and sugar beet feedstocks reach commercial-scale bioethanol production faster than any other crop category because fermentation infrastructure already exists in Brazil, the EU, and India. Buyers procuring certified bioethanol from sugar crops face lower supply chain risk, which explains why this feedstock class anchors blending mandates in multiple jurisdictions.
Starch Crops (Corn, Wheat, Cassava) serve as the primary feedstock base for bioethanol production in North America, where corn-based ethanol underpins the US Renewable Fuel Standard. The US EPA set a total renewable fuel requirement of 22.33 billion gallons (ethanol-equivalent) for 2025. This mandatory floor volume effectively guarantees demand for starch crop-derived fuels and locks in offtake for large corn ethanol producers for the near term.
Oilseeds (Soy, Rapeseed, Palm) supply the feedstock base for biodiesel and HEFA-pathway jet fuel production. Soy and rapeseed dominate in Western markets due to existing crushing and esterification capacity. However, palm oil faces increasing restriction in European sustainability certification frameworks, which is redirecting oilseed procurement toward higher-cost soy and rapeseed alternatives and raising feedstock costs for European biodiesel producers.
Product Form Insights
Liquid dominates with 46.3% due to direct compatibility with existing fuel distribution and vehicle systems.
In 2025, Liquid biofuels held a dominant market position in the By Product Form segment of the Sustainable Biofuels Market, with a 46.3% share. Liquid fuels primarily bioethanol and biodiesel require no infrastructure change at the point of end use. This drop-in compatibility is not a minor convenience; it removes the single largest adoption barrier for fleet operators and fuel distributors, who face no conversion costs when shifting from fossil to certified liquid biofuels.
Solid biofuels, including wood pellets and compressed biomass, serve heat and power generation markets where combustion infrastructure already exists. Demand is stable in European residential and industrial heating, supported by renewable energy mandates. Solid biofuels face limited growth in transport, where liquid and gaseous alternatives are better suited so their market share is likely to remain concentrated in stationary energy applications.
Gaseous biofuels, principally biomethane and biohydrogen, are gaining procurement interest from heavy transport, shipping, and industrial users that cannot run on liquid alternatives. Grid injection of biomethane in Europe is accelerating under renewable gas targets, which creates a dual revenue pathway for producers direct sale and utility grid contracts. As hard-to-abate sectors intensify decarbonization efforts, gaseous biofuel demand from non-road segments will grow faster than the broader market average.
Fuel Type Insights
Bioethanol dominates with 42.1% due to mature blending mandates and low-cost production from sugar and starch crops.
In 2025, Bioethanol held a dominant market position in the By Fuel Type segment of the Sustainable Biofuels Market, with a 42.1% share. Bioethanol benefits from decades of regulatory support, production scale, and blending infrastructure in North America, Brazil, and Europe. Its dominance reflects mandated volume floors not discretionary choice making it the most predictable revenue stream in the biofuels portfolio for producers with certified supply chains.
Biodiesel serves road transport and marine applications where diesel engines dominate fleets. The EPA’s 2025 Renewable Fuel Standard set a biomass-based diesel requirement of 3.35 billion gallons, establishing a mandatory baseline that supports producer economics regardless of oil price movements. European B7 and B10 blending requirements add further floor demand, positioning biodiesel as a low-risk revenue segment for refiners with oilseed processing capacity.
Biogas primarily targets power generation and gas grid injection markets, with biomethane upgrading technologies enabling direct pipeline use. Waste-to-biogas projects are gaining momentum in municipal and agricultural settings where feedstock is available at near-zero cost. The economic case for biogas strengthens as natural gas prices remain volatile buyers in industrial heating and power are willing to sign long-term biomethane offtake agreements to lock in supply price certainty.
Biojet Fuel / Renewable Aviation Fuel is the fastest-scaling fuel type by policy attention and investment volume. Based on data from EASA, SAF represented only 0.53% of global jet fuel use as of 2024, while the mandatory SAF supply requirement under ReFuelEU Aviation rose to 2% in 2025. This gap between current use and mandated levels signals that supply must scale rapidly creating a narrow but high-value window for producers who can deliver certified SAF volumes before the market tightens further.
Biobutanol offers higher energy density than ethanol and blends with gasoline at higher ratios without engine modification. Commercial production remains limited, but biobutanol’s superior fuel properties make it a differentiated product for premium blending applications. Producers able to achieve cost-competitive biobutanol output from waste feedstocks stand to capture specialty pricing in markets where energy density per liter carries a price premium.
Technology Insights
Biochemical Conversion dominates with 47.6% due to lower capital intensity and established fermentation process infrastructure.
In 2025, Biochemical Conversion held a dominant market position in the By Technology segment of the Sustainable Biofuels Market, with a 47.6% share. Fermentation and enzymatic hydrolysis processes have decades of operating history in ethanol production, giving biochemical conversion a cost and reliability advantage over competing technologies. Research by IATA confirms that 11 ASTM-certified SAF production pathways are currently approved, several of which rely on biochemical routes validating this technology class as the compliance-ready option for aviation fuel producers seeking rapid certification.
Thermochemical Conversion processes including gasification, pyrolysis, and hydrothermal liquefaction handle a wider range of feedstocks than biochemical methods, including lignocellulosic biomass and mixed municipal waste. This feedstock versatility is a structural advantage as food-based feedstock costs rise. Thermochemical plants carry higher upfront capital costs, but their ability to run on low-cost waste inputs improves long-run economics for producers in regions with strong waste aggregation systems.
Material Type Insights
Lignocellulosic Biomass dominates with 37.2% due to abundant supply, non-food feedstock status, and policy preference for advanced biofuel certification.
In 2025, Lignocellulosic Biomass held a dominant market position in the By Material Type segment of the Sustainable Biofuels Market, with a 37.2% share. Agricultural residues, forestry waste, and energy crops avoid food-versus-fuel conflicts that restrict first-generation feedstocks. Regulators in the EU and US specifically incentivize lignocellulosic inputs through advanced biofuel credit classifications, making them commercially attractive despite higher conversion complexity. The EPA’s 2025 cellulosic biofuel requirement of 1.38 billion gallons (ethanol-equivalent) sets a mandatory demand floor that directly rewards producers who can process this feedstock class at commercial scale.
Algae offers high theoretical yield per hectare and can grow on non-arable land using brackish or wastewater, avoiding competition for agricultural resources entirely. Commercial algae biofuel production remains limited by high energy inputs for cultivation and harvesting. However, co-location with industrial CO₂ emitters where algae can use exhaust gases as feedstock is emerging as a cost-reduction pathway that could shift algae from a research category to a commercial one within this forecast period.
Industry Vertical Insights
Transportation dominates with 53.7% due to blending mandates, fleet decarbonization pressure, and liquid fuel compatibility with existing engines.
In 2025, Transportation held a dominant market position in the By Industry Vertical segment of the Sustainable Biofuels Market, with a 53.7% share. Road transport, aviation, and marine shipping collectively drive the majority of sustainable biofuel demand because regulatory mandates target these sectors directly. Transport buyers from logistics fleets to airlines face legally binding emissions reduction timelines that make certified biofuel procurement a compliance necessity, not a discretionary sustainability gesture.
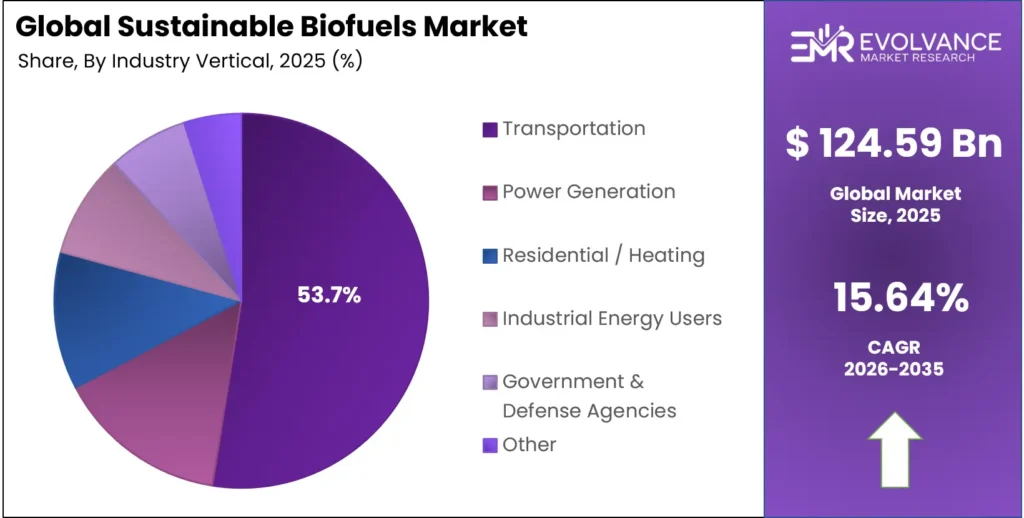
Power Generation buyers use biogas, bio-oil, and solid biomass to meet renewable electricity targets in markets where solar and wind integration faces grid stability constraints. Co-firing biomass with coal in existing power plants offers a low-cost transition pathway for utilities under carbon price pressure. As carbon markets mature, power generators that can credibly document biofuel-sourced electricity will capture premium pricing in green energy contracting.
Automotive Manufacturers and Fleet Operators are adopting biofuel blending strategies as a bridge solution while electric vehicle infrastructure matures. Fleet operators with large diesel assets face pressure from corporate emissions reporting frameworks to reduce fuel-related carbon intensity now before electrification is practical at scale. Biofuel blending offers a lower-cost and faster-to-implement emissions reduction pathway than premature fleet replacement, making this vertical a reliable near-term demand source.
Market Segments Covered in the Report
By Feedstock
- Sugar Crops
- Sugarcane
- Sugar Beet
- Starch Crops
- Corn
- Wheat
- Cassava
- Oilseeds
- Soy
- Rapeseed
- Palm
- Used Cooking Oil and Animal Fat
By Product Form
- Liquid
- Solid
- Gaseous
By Fuel Type
- Bioethanol
- Biodiesel
- Biogas
- Biojet Fuel / Renewable Aviation Fuel
- Biobutanol
- Bio-oil
- Syngas
By Technology
- Biochemical Conversion
- Thermochemical Conversion
- Chemical Conversion
- Hybrid Technologies
By Material Type
- Lignocellulosic Biomass
- Algae
- Waste Oils & Fats
- Non-edible Oils
By Industry Vertical
- Transportation
- Power Generation
- Residential / Heating
- Industrial Energy Users
- Government & Defense Agencies
- Agriculture
- Automotive Manufacturers & Fleet Operators
Regional Insights
North America Dominates the Sustainable Biofuels Market with a Market Share of 38.6%, Valued at USD 48.09 Billion
North America leads with a 38.6% share valued at USD 48.09 Billion built on the US Renewable Fuel Standard, established corn ethanol infrastructure, and a large domestic transport fuel market. The RFS creates mandatory annual volume floors that guarantee producer revenue. These conditions give North American biofuel companies a structural cost and scale advantage that newer markets are still working to replicate.
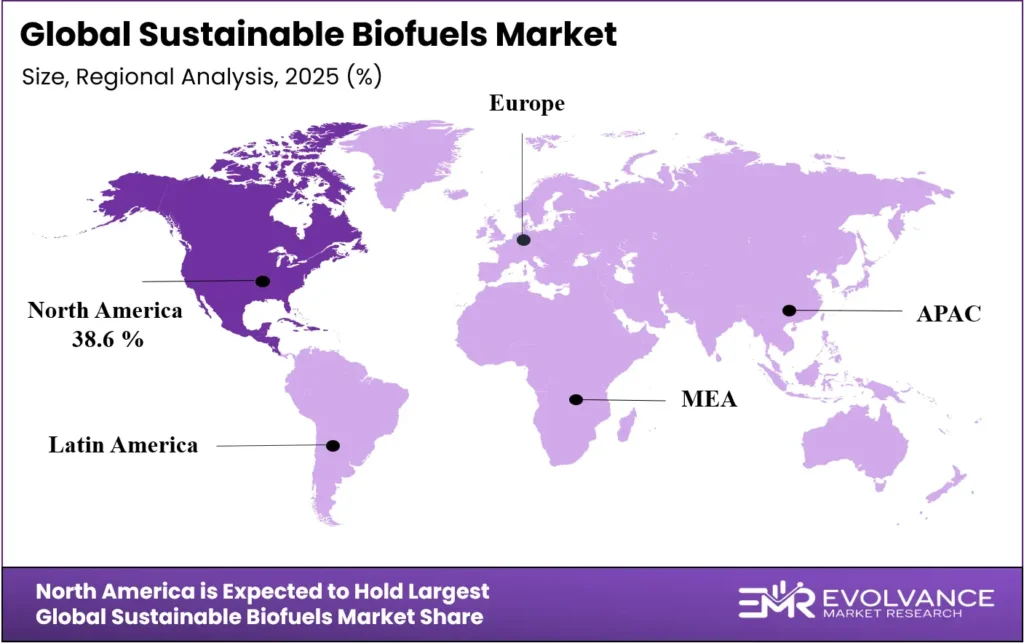
Europe Market Trends
Europe’s sustainable biofuel market is shaped by the ReFuelEU Aviation Regulation, the Renewable Energy Directive, and national blending mandates that collectively target both transport and heating fuels. The EU’s binding SAF supply requirement and advanced biofuel sub-targets create strong incentives for waste feedstock processing. Producers with certified used cooking oil supply chains are especially well-positioned in this regulatory environment, where double-counting credits raise the effective value of waste-derived fuels.
Asia Pacific Market Trends
Asia Pacific is the fastest-growing regional market for sustainable biofuels, led by mandate-driven expansion in India, China, and Southeast Asia. India’s ethanol blending program is targeting 20% blending with petrol by 2025 as a national energy security measure. China is building domestic SAF production capacity ahead of tightening civil aviation emissions standards. These policy shifts are creating new greenfield production opportunities for domestic and international producers across the region.
Key Regions and Countries
North America
- US
- Canada
Europe
- Germany
- France
- The UK
- Spain
- Italy
- Rest of Europe
Asia Pacific
- China
- Japan
- South Korea
- India
- Australia
- Rest of APAC
Latin America
- Brazil
- Mexico
- Rest of Latin America
Middle East & Africa
- GCC
- South Africa
- Rest of MEA
Regulatory Landscape
The European Union’s ReFuelEU Aviation Regulation took effect in 2025, requiring fuel suppliers in Europe to provide SAF equal to 2% of total aviation fuel supplied. This mandate escalates to 6% by 2030 and sets a dedicated synthetic e-fuel sub-target of 0.7% from 2030. Producers who cannot demonstrate certified sustainability credentials will be locked out of European aviation fuel supply chains.
ICAO’s Carbon Offsetting and Reduction Scheme for International Aviation (CORSIA) issued updated eligible fuel guidance on 27 June 2025, revising sustainable fuel methods and operational eligibility rules for international aviation. Airlines using CORSIA-compliant SAF receive emissions offset credits against their international flight obligations. These updates tighten documentation standards and raise the compliance bar for SAF producers seeking CORSIA recognition.
The Renewable Energy Directive III (RED III) in the European Union reinforces binding targets for advanced biofuels in transport, including a 5.5% sub-target for advanced biofuels and renewable fuels of non-biological origin by 2030. This directive creates a two-tier market first-generation biofuels face caps while advanced and waste-based fuels receive preferred regulatory treatment reshaping procurement incentives across the EU biofuel supply chain.
Drivers
Low-Carbon Fuel Standards and Blending Mandates Are Institutionalizing Biofuel Procurement Across Aviation and Surface Transport
Blending mandates have converted biofuel demand from discretionary to mandatory in major economies. The EU’s ReFuelEU Aviation Regulation required fuel suppliers to deliver SAF equal to 2% of aviation fuel in 2025, per EASA data. This is not a voluntary commitment it is a legally enforced volume floor. Producers with certified supply chains now have guaranteed access to one of the world’s largest fuel markets.
Consequently, producers who built compliance infrastructure traceability systems, sustainability certification, carbon reporting ahead of these mandates are now collecting structural market access premiums. The window to capture that advantage is narrowing as more producers qualify. Companies investing in certification now will lock in supply contracts before the compliance pool widens and pricing pressure increases.
Corporate Net-Zero Commitments Are Redirecting Industrial Offtake Agreements Toward Certified Sustainable Fuel Alternatives
Large corporate buyers airlines, logistics operators, shipping companies are signing long-term sustainable fuel offtake agreements to meet publicly disclosed net-zero targets. These agreements are no longer driven by goodwill alone; procurement teams face board-level accountability against carbon intensity metrics. Biofuel suppliers who can deliver certified volumes with documented lifecycle emissions data are winning multi-year contracts that small and uncertified producers cannot access.
Additionally, airlines forming strategic alliances with energy companies and agricultural suppliers to secure feedstock-to-fuel supply chains are vertically integrating biofuel procurement. This model locks in feedstock access and production capacity years ahead of delivery a competitive move that reduces spot market exposure and shields buyers from supply price volatility. Producers entering these alliance structures gain revenue visibility that standalone spot sellers cannot match.
Restraints
Feedstock Availability Constraints Driven by Competing Demand From Food, Feed, and Biobased Industries Limit Production Scalability
First-generation feedstocks corn, soy, sugarcane, palm face competing demand from food processors, animal feed producers, and biobased materials manufacturers. When food commodity prices rise, biofuel producers face higher input costs that compress margins or force price increases that reduce blending volumes. This feedstock competition creates a ceiling on how fast first-generation biofuel capacity can scale without disrupting food market pricing.
However, the most binding near-term constraint is used cooking oil and animal fat supply. These waste inputs command regulatory premiums that make them highly attractive, but their physical availability is finite. Multiple biofuel sectors SAF, biodiesel, HEFA refining are competing for the same limited waste oil volumes. Without new feedstock pathways reaching commercial scale, this competition will push waste feedstock prices higher and erode the margin advantage these inputs currently provide.
Capital-Intensive Refinery Construction and Long Project Development Timelines Suppress Speed-to-Scale Economics
Building a commercial-scale advanced biofuel refinery requires capital commitments of hundreds of millions of dollars and development timelines of five to eight years from planning to first production. This long lead time means production decisions made today must be based on projected demand and policy environments nearly a decade out. Policy risk the possibility that mandates change or carbon pricing weakens makes project finance more expensive and equity investors more cautious.
Consequently, this capital concentration is shaping the competitive structure of the market. The biofuels sector is consolidating around large players who can bear development costs and absorb early-stage losses. Niche producers who identified differentiated feedstocks or technologies but lack capital scale are becoming acquisition targets a trend that will likely intensify as mandated volumes require rapid capacity additions that only large balance sheets can finance.
Growth Factors
Marine Shipping Decarbonization and Refinery Integration Are Opening New High-Volume Demand Channels for Sustainable Biofuels
Marine shipping faces binding decarbonization pressure from the International Maritime Organization’s 2050 net-zero target and the EU’s FuelEU Maritime regulation. Drop-in biofuel blends that work in existing ship engines offer the fastest compliance pathway for shipping operators who cannot wait for hydrogen or ammonia propulsion to reach commercial readiness. Biofuel producers with high-energy-density fuel products HVO, biodiesel, bio-oil are gaining traction in early marine offtake conversations.
Moreover, integrating biofuel production within existing petroleum refineries removes the single largest capital barrier to new supply. Refiners with hydroprocessing units can co-process biogenic feedstocks alongside crude oil fractions, producing HEFA jet fuel and renewable diesel without building standalone plants. This approach cuts capital costs sharply and accelerates time to commercial production. Figures from IATA confirm that advanced feedstock conversion pathways can achieve lifecycle emissions reductions of more than 90%, validating the premium pricing these fuels can command from aviation and shipping buyers.
Cross-Border Sustainability Certification and Government R&D Investment Are Expanding Market Access for Certified Producers
The synthetic e-fuel sub-target of 0.7% established under the ReFuelEU Aviation Regulation for 2030 reported by EASA signals that regulators are actively creating a market for advanced biofuel alternatives beyond HEFA. This forward-looking mandate gives producers of electrofuels and power-to-liquid fuels a defined demand signal to invest against, reducing the commercial risk of building capacity for a product category that does not yet have mandatory market access.
Furthermore, government R&D investment in second and third-generation biofuel technologies is reducing the cost gap between advanced and conventional biofuels. Public funding programs in the US, EU, and China are supporting demonstration plants for algae, lignocellulosic ethanol, and thermochemical conversion at a scale that private capital alone would not fund at this stage. Each successful demonstration plant de-risks the next wave of private investment and compresses the timeline to commercial cost parity.
Emerging Trends
HEFA Pathway Dominance and AI-Enabled Feedstock Optimization Are Reshaping Production Competitive Dynamics
The HEFA production pathway which converts waste oils and fats into jet fuel and renewable diesel has become the default technology for SAF producers seeking fast market entry. HEFA’s ASTM certification, proven performance in aircraft, and refinery compatibility give it a speed-to-market advantage over competing production pathways. The ICAO’s collective vision calls for a 5% reduction in international aviation CO₂ by 2030 through SAF and cleaner aviation energies, and HEFA is the only pathway currently capable of delivering certified volume at the scale required.
Additionally, book-and-claim accounting mechanisms are expanding as a procurement model for buyers who cannot physically receive sustainable fuel at their operating location. Under book-and-claim, a buyer purchases a SAF certificate corresponding to fuel delivered elsewhere in the supply chain allowing airlines operating in airports without SAF supply to claim certified fuel use for reporting purposes. This model is widening the addressable buyer pool beyond locations with direct SAF access, which supports demand growth for certified producers supplying any point in the global aviation fuel network.
Research Methodology Framework and Report Scope
Market Definitions and Key Coverage
This report covers the global sustainable biofuels market, defined as fuels derived from biological feedstocks that meet certified sustainability and lifecycle carbon reduction criteria. Included product categories span bioethanol, biodiesel, biogas, biojet fuel and renewable aviation fuel, biobutanol, bio-oil, and syngas.
The study covers five feedstock classes sugar crops, starch crops, oilseeds, used cooking oil and animal fat, lignocellulosic biomass, algae, waste oils and fats, and non-edible oils and four conversion technology categories: biochemical, thermochemical, chemical, and hybrid conversion. All market valuations are expressed in constant US dollars using 2025 as the base year to eliminate currency fluctuation effects on trend analysis across the 2026–2035 forecast period.
The scope excludes fossil-derived fuels marketed with minor renewable content that do not meet sustainability certification thresholds. It also excludes software-only energy management platforms, non-biogenic hydrogen, and conventional fossil fuel blending operations not linked to certified renewable content. Market data covers end-use demand from transportation, power generation, residential heating, industrial energy users, government and defense agencies, agriculture, and automotive manufacturers and fleet operators across North America, Europe, Asia Pacific, Latin America, and the Middle East and Africa.
Key Companies Insights
Archer Daniels Midland Company operates one of the most integrated grain-to-biofuel supply chains in North America, combining origination, crushing, fermentation, and distribution within a single corporate structure. This vertical reach gives ADM feedstock cost visibility that standalone biofuel producers cannot match. As corn ethanol margins tighten under higher feedstock competition, ADM’s ability to offset losses in one part of the value chain with gains in another keeps it competitive through commodity price cycles that force weaker producers to idle capacity.
CropEnergies AG focuses on European bioethanol production from sugar beet and cereals, operating in a regulatory environment where RED III sub-targets and national blending mandates create a stable demand floor. The company’s European production footprint positions it to serve compliance buyers directly in the region with the world’s most detailed advanced biofuel certification framework. CropEnergies’ ability to co-produce food-grade protein alongside bioethanol gives it a margin diversification advantage that pure-play fuel producers lack.
Air Liquide brings industrial gas and hydrogen expertise into the sustainable biofuels space through biogas upgrading and hydrogen production from biomass. As biomethane and green hydrogen gain traction in transport and industrial decarbonization strategies, Air Liquide’s distribution infrastructure and gas handling capabilities translate into a supply chain advantage. The company is well-positioned to benefit from the EU’s accelerating biomethane targets under REPowerEU, which set a goal of producing 35 billion cubic meters of biomethane annually by 2030.
Green Plains Inc. is transforming its US corn ethanol network from a commodity fuel producer into a high-protein co-product platform. By extracting high-protein distillers corn oil and ultra-high-protein animal feed alongside ethanol, Green Plains is reducing its dependence on fuel margin alone. This strategy improves economics at existing facilities without requiring new capital deployment, and positions the company to weather ethanol margin compression while it expands into higher-value bio-based products that benefit from the same production infrastructure.
Key Companies
- Archer Daniels Midland Company
- CropEnergies AG
- Air Liquide
- Green Plains Inc.
- Petrobras
- Abengoa
- Valero Energy Corp.
- Alto Ingredients Inc.
- Renewable Energy Group, Inc.
- Bunge North America, Inc.
- Gevo Butamax Advanced Biofuels LLC
- Wilmar International Ltd.
- Royal Dutch Shell Plc
- Scandinavian Biogas Fuels International AB
Recent Industry Developments
- In 2025, Nexgen Energia secured a US$1 billion growth-equity round to expand biofuel production capacity in India. The financing was the largest reported biofuels equity transaction of 2025 and was aimed at accelerating commercial deployment and scaling operations.
- In 2025, SkyNRG raised US$282 million in late-stage funding to advance Sustainable Aviation Fuel (SAF) projects. The Dutch SAF developer used the capital to support commercialization and project execution.
- In 2025, Montana Renewables obtained US$700 million in debt financing for renewable fuel deployment. The funding supported industrial-scale expansion of renewable fuel assets.
Market Scope
| Report Features | Description |
|---|---|
| Market Value (2025) | USD 124.59 Billion |
| Forecast Revenue (2035) | USD 532.80 Billion |
| CAGR (2026-2035) | 15.64% |
| Base Year for Estimation | 2025 |
| Historic Period | 2020-2024 |
| Forecast Period | 2026-2035 |
| Report Coverage | Revenue Forecast, Market Dynamics, Competitive Landscape, Recent Developments |
| Segments Covered | By Feedstock (Sugar Crops, Starch Crops, Oilseeds, Used Cooking Oil and Animal Fat), By Product Form (Liquid, Solid, Gaseous), By Fuel Type (Bioethanol, Biodiesel, Biogas, Biojet Fuel / Renewable Aviation Fuel, Biobutanol, Bio-oil, Syngas), By Technology (Biochemical Conversion, Thermochemical Conversion, Chemical Conversion, Hybrid Technologies), By Material Type (Lignocellulosic Biomass, Algae, Waste Oils & Fats, Non-edible Oils), By Industry Vertical (Transportation, Power Generation, Residential / Heating, Industrial Energy Users, Government & Defense Agencies, Agriculture, Automotive Manufacturers & Fleet Operators) |
| Regional Analysis | North America (US and Canada), Europe (Germany, France, The UK, Spain, Italy, and Rest of Europe), Asia Pacific (China, Japan, South Korea, India, Australia, and Rest of APAC), Latin America (Brazil, Mexico, and Rest of Latin America), Middle East & Africa (GCC, South Africa, and Rest of MEA) |
| Competitive Landscape | Archer Daniels Midland Company, CropEnergies AG, Air Liquide, Green Plains Inc., Petrobras, Abengoa, Valero Energy Corp., Alto Ingredients Inc., Renewable Energy Group Inc., Bunge North America Inc., Gevo Butamax Advanced Biofuels LLC, Wilmar International Ltd., Royal Dutch Shell Plc, Scandinavian Biogas Fuels International AB |
| Customization Scope | Customization for segments, region/country-level will be provided. Moreover, additional customization can be done based on the requirements. |
| Purchase Options | We have three licenses to opt for: Single User License, Multi-User License (Up to 5 Users), Corporate Use License (Unlimited User and Printable PDF) |