What is the Low-Carbon Construction Materials Market Size?
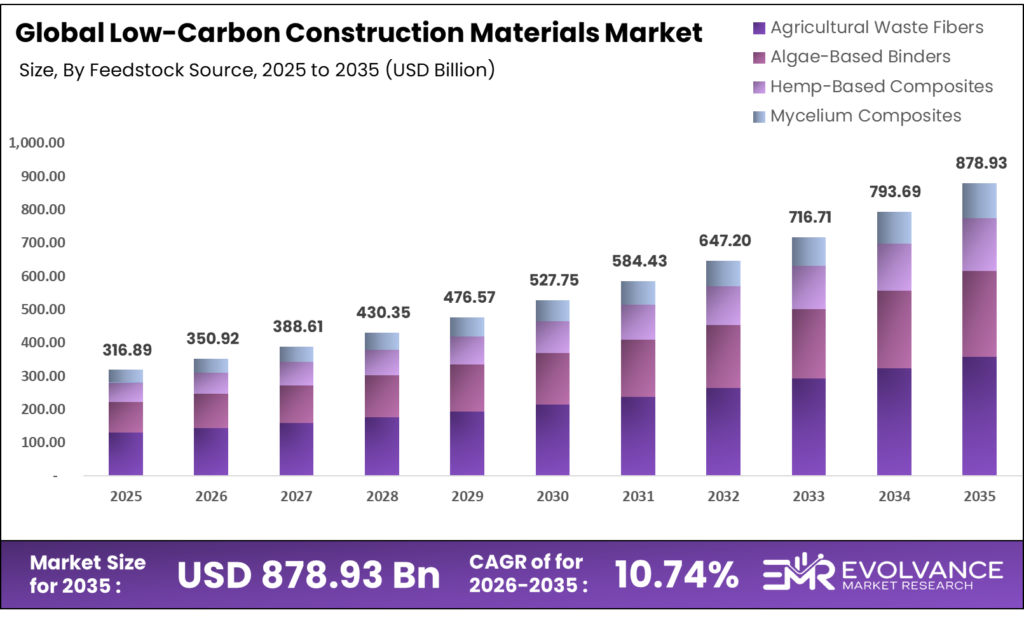
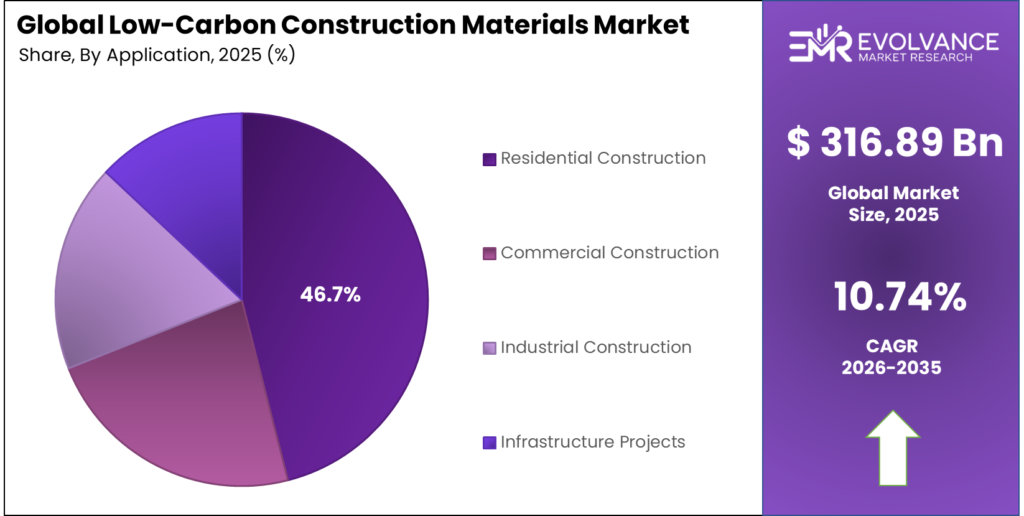
The Global Low-Carbon Construction Materials Market size will be worth around USD 878.93 Billion by 2035 from USD 316.89 Billion in 2025, growing at a CAGR of 10.74% during the forecast period 2026 to 2035. Mandatory green building codes and public procurement rules are pushing builders to replace high-emission materials with verified low-carbon alternatives. Enterprise buyers are moving spend toward certified products, creating a direct revenue channel for companies that can prove embodied carbon reductions. Supply-side constraints persist as industrial-scale carbon capture infrastructure in cement plants remains capital-intensive with long build timelines.
Market Highlights
- The Global Low-Carbon Construction Materials Market will grow from USD 316.89 Billion in 2025 to USD 878.93 Billion by 2035, at a CAGR of 10.74%.
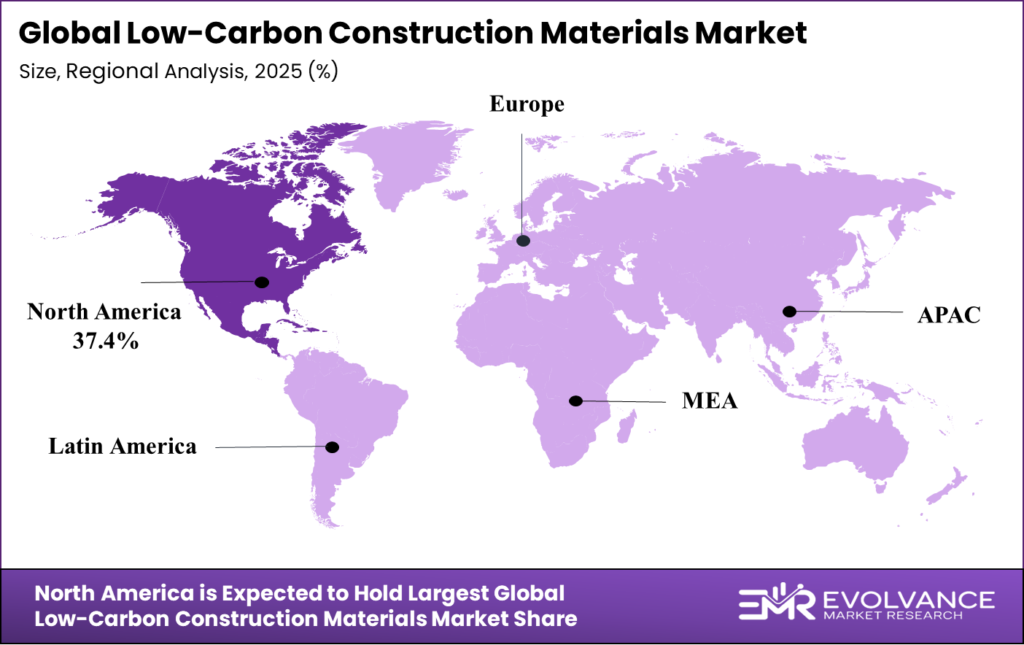
- North America leads all regions with a 37.4% market share, valued at USD 118.51 Billion.
- Low-Carbon Cement holds 40.3% share by material type.
- Material Substitution leads carbon reduction strategy at 41.2%.
- Ready-Mix Concrete Production dominates deployment at 54.2%.
- LEED-Certified Materials lead compliance at 48.1%.
- Residential Construction accounts for 46.7% of applications.
- Agricultural Waste Fibers lead feedstock at 51.6%.
- Mineralization-Based Materials lead carbon storage at 57.4%.
- Recycled Content Materials dominate circularity at 62.9%.
Market Overview
The low-carbon construction materials market covers products and systems that reduce embodied carbon across the full building lifecycle. It includes CCS-enabled cement, bio-based insulation, mass timber, recycled content concrete, and carbon-negative structural materials. These products serve residential, commercial, industrial, and public infrastructure projects where carbon reduction is now a procurement requirement.
Demand is no longer driven by voluntary sustainability goals alone. Green building codes, public procurement mandates, and carbon pricing regimes are converting environmental intent into binding commercial requirements. Builders who cannot document embodied carbon reductions face disqualification from major contracts — and that structural shift is what makes this market different from prior green building cycles.
Low-Carbon Construction Materials significantly reduce greenhouse gas emissions compared to conventional alternatives like standard concrete or virgin steel. Options such as fly ash concrete, cross-laminated timber, and hempcrete are gaining traction across the industry. These materials work hand-in-hand with Climate-Resilient Construction Materials and support the overarching vision of a greener built environment through Green Building Materials.
Traditional cement manufacturing contributes roughly 8% of global CO2 emissions. That single figure explains why regulators and institutional buyers are targeting this sector with binding requirements rather than voluntary frameworks. Any supplier that can offer verified carbon reduction at commercial scale holds a structural pricing advantage over standard producers operating under rising carbon removal compliance costs.
Government funding is accelerating supply-side investment at a scale the private sector alone could not sustain. Norway’s Longship program, the U.S. Inflation Reduction Act, and the EU Innovation Fund have collectively directed billions into low-carbon cement and CCS infrastructure. These are not pilot grants — they are commercial-scale programs that de-risk first-mover investment for industrial producers. Heidelberg Materials pre-sold 100% of its planned 2025 evoZero low-carbon cement output before the Brevik CCS facility reached full operation, proving that buyer demand at this price point is real and committed.
Material Type Insights
Low-Carbon Cement dominates with 40.3% due to universal structural demand and active CCS deployment.
In 2025, Low-Carbon Cement held a dominant market position in the By Material Type segment of the Low-Carbon Construction Materials Market, with a 40.3% share. Cement is embedded in virtually every construction project, which means demand is structurally non-discretionary. As reported by The Times, cement manufacturing globally emits approximately 1.6 billion tonnes of CO2 each year — making it the single largest decarbonization target in construction. Producers that can deliver verified low-carbon cement at volume hold the most commercially defensible position in this market.
Carbon-Negative Concrete captures and permanently mineralizes CO2 during production, creating materials that remove more carbon than they emit. CarbonCure Technologies surpassed 500,000 metric tons of CO2 savings through its carbon-injected concrete technology deployed across 7.5 million truckloads globally, demonstrating that this segment is beyond proof-of-concept and operating at commercial scale. This positions carbon-negative concrete as the highest-value product category for buyers with net-zero procurement commitments.
Green Concrete serves as the primary delivery format for low-carbon cement in commercial and infrastructure projects. Its market position strengthens as ready-mix producers integrate CO2 mineralization and supplementary cementitious materials into standard mix designs. Buyers benefit from carbon reduction without changing procurement workflows, which lowers the switching cost and accelerates adoption across large-scale projects.
Mass Timber is gaining traction in mid-rise residential and commercial construction as an alternative to concrete-framed structures. Its appeal is twofold: it stores biogenic carbon during the building’s lifespan and requires less energy-intensive production than steel or concrete. However, its adoption is constrained by fire code restrictions and limited regional supply chains for engineered wood products outside North America and Northern Europe.
Carbon Reduction Strategy Insights
Material Substitution dominates with 41.2% due to low switching costs and immediate carbon reduction results.
In 2025, Material Substitution held a dominant market position in the By Carbon Reduction Strategy segment, with a 41.2% share. Replacing high-carbon inputs with lower-carbon alternatives — such as supplementary cementitious materials in concrete or recycled aggregates in asphalt — delivers immediate carbon reductions without new infrastructure investment.
Recycled Material Usage reduces both embodied carbon and raw material costs, making it commercially attractive independent of carbon pricing signals. It is particularly strong in concrete and steel, where recycled aggregates and electric arc furnace production are well-established. The strategy benefits from circular economy policy mandates that are now codified in EU construction regulations.
Renewable Energy Utilization in Production addresses Scope 2 emissions from materials manufacturing. It is most effective in electricity-intensive processes like aluminum and glass production, where switching to renewable power grids or on-site generation directly reduces the carbon footprint of finished materials.
Deployment and Manufacturing Process Insights
Ready-Mix Concrete Production dominates with 54.2% due to its central role in nearly all construction project types.
In 2025, Ready-Mix Concrete Production held a dominant market position in the By Deployment and Manufacturing Process segment, with a 54.2% share. Ready-mix plants are the primary distribution point for low-carbon concrete technologies, including CO2 injection and supplementary cementitious material blends. Because these plants already serve the full construction supply chain, integrating low-carbon production at this point reaches the widest possible buyer base without requiring changes to downstream construction processes.
Prefabrication and Off-Site Manufacturing is the fastest-growing process category because it combines quality control with carbon optimization. Controlled factory environments allow precise mix design, curing optimization, and integration of recycled content at levels difficult to achieve on-site. Vattenfall and Cemvision’s partnership to supply near-zero emission cement with up to 95% lower CO2 emissions directly targets this segment, creating a major supply opportunity for prefabricated construction systems across renewable energy infrastructure.
Certification and Compliance Insights
LEED-Certified Materials dominate with 48.1% due to their established global recognition and procurement influence.
In 2025, LEED-Certified Materials held a dominant market position in the By Certification and Compliance segment, with a 48.1% share. LEED certification is the most widely recognized green building standard globally, and its material credits create direct pull for low-carbon products. Developers pursuing LEED certification are required to document material inputs, which makes LEED compliance a self-reinforcing demand driver for certified low-carbon suppliers.
BREEAM Standards dominate in the UK and parts of Northern Europe, where BREEAM is the default compliance framework for commercial real estate. As BREEAM updates its materials assessment credits to require Environmental Product Declarations, it creates structured procurement demand for materials with verified embodied carbon data.
ISO 14001 Environmental Management certification signals supply chain credibility rather than product-level carbon performance. It is increasingly required as a pre-qualification criterion for public infrastructure procurement, making it a baseline commercial requirement rather than a differentiator for materials producers.
Application Insights
Residential Construction dominates with 46.7% due to its scale and the growing role of building energy codes.
In 2025, Residential Construction held a dominant market position in the By Application segment, with a 46.7% share. Housing accounts for the largest share of total construction activity by volume in most major markets. As residential building codes in Europe, North America, and parts of Asia Pacific begin to include embodied carbon limits alongside operational energy requirements, the residential segment becomes the primary volume driver for low-carbon materials at scale.
Commercial Construction is where premium low-carbon materials find their strongest immediate buyer base. Corporate occupiers with net-zero commitments are actively specifying low-carbon concrete, steel, and insulation into new office and logistics developments. This segment offers the highest per-project carbon documentation requirements, which directly rewards suppliers with certified Environmental Product Declarations.
Infrastructure Projects represent the largest single procurement opportunity for low-carbon cement and steel when measured by volume per project. The U.S. EPA’s Low Embodied Carbon Construction Materials Label Program, backed by USD 100 Million in Inflation Reduction Act funding, creates a verified procurement pathway for verified low-carbon concrete, steel, asphalt, and glass used in public infrastructure.
Feedstock Source Insights
Agricultural Waste Fibers dominate with 51.6% due to low input costs and wide regional availability.
In 2025, Agricultural Waste Fibers held a dominant market position in the By Feedstock Source segment, with a 51.6% share. Rice husks, straw, and crop residues are available at near-zero cost in major agricultural economies, making them the most commercially accessible bio-based feedstock for insulation and composite materials. Their use converts a disposal problem into a production input, which appeals to both cost-focused manufacturers and sustainability-focused buyers.
Algae-Based Binders are still primarily in the research and pilot stage, but they represent one of the few feedstocks capable of combining carbon capture with structural material production. Commercial scaling requires consistent algae cultivation infrastructure, which limits near-term market penetration to regions with established aquaculture or bioenergy industries.
Hemp-Based Composites are gaining acceptance in European bio-construction markets, particularly for hempcrete wall systems in residential renovation. Regulatory clarification around hemp cultivation across the EU and UK is removing prior barriers to supply chain development, supporting steady adoption through 2030.
Carbon Storage Mechanism Insights
Mineralization-Based Materials dominate with 57.4% due to permanent, verifiable carbon storage in finished products.
In 2025, Mineralization-Based Materials held a dominant market position in the By Carbon Storage Mechanism segment, with a 57.4% share. Mineral carbonation permanently bonds CO2 into the crystalline structure of cementitious materials, creating a storage mechanism that survives the full lifecycle of the building. This permanence is critical for buyers seeking to meet long-term net-zero commitments, as it eliminates the reversal risk associated with biological carbon storage.
Bio-Sequestration Materials store carbon in biological form — in wood, bamboo, hemp, and other plant-based construction elements. While effective over typical building lifespans of 50-100 years, bio-sequestration carries end-of-life uncertainty that mineral carbonation does not. Certification bodies are developing standardized accounting methods to make bio-sequestration credits tradeable and bankable for net-zero reporting purposes.
CO2-Injected Concrete combines ready-mix production with in-process carbon injection, permanently mineralizing CO2 into the concrete matrix during mixing. CarbonCure Technologies produced 50 million cubic yards of lower-carbon concrete using this approach, contributing to nearly 400,000 metric tons of avoided emissions. This makes CO2-injected concrete one of the most commercially proven carbon storage technologies in the construction materials market.
Circularity Model Insights
Recycled Content Materials dominate with 62.9% due to cost competitiveness and established supply chains.
In 2025, Recycled Content Materials held a dominant market position in the By Circularity Model segment, with a 62.9% share. Recycled aggregates, supplementary cementitious materials, and electric arc furnace steel have mature supply chains and well-understood performance characteristics. Their carbon advantage over virgin materials is well documented, and their cost position is often equal to or better than primary materials — removing the price premium barrier that limits adoption of other low-carbon alternatives.
Reusable Modular Components are gaining traction as design-for-disassembly requirements appear in European building regulations. The ability to recover and reuse structural elements across multiple project lifecycles dramatically reduces embodied carbon on a per-use basis, but requires standardization in connection systems and a functioning secondary market for recovered components.
Market Segments Covered in the Report
By Material Type
- Low-Carbon Cement
- Green Concrete
- Mass Timber
- Low-Carbon Bricks
- Bio-Based Insulation
- Carbon-Negative Concrete
By Carbon Reduction Strategy
- Material Substitution
- Carbon Capture Integration
- Recycled Material Usage
- Renewable Energy Utilization in Production
- Circular Construction Practices
By Deployment and Manufacturing Process
- Ready-Mix Concrete Production
- On-Site Production
- Prefabrication / Off-Site Manufacturing
- Modular Assembly
By Certification and Compliance
- LEED-Certified Materials
- BREEAM Standards
- ISO 14001 Environmental Management
- GreenPro Certification
By Application
- Residential Construction
- Commercial Construction
- Industrial Construction
- Infrastructure Projects
By Feedstock Source
- Agricultural Waste Fibers
- Algae-Based Binders
- Hemp-Based Composites
- Mycelium Composites
By Carbon Storage Mechanism
- Mineralization-Based Materials
- Bio-Sequestration Materials
- CO2-Injected Concrete
By Circularity Model
- Recycled Content Materials
- Reusable Modular Components
- Urban Mining Materials
Regional Insights
North America Dominates the Low-Carbon Construction Materials Market with a Market Share of 37.4%, Valued at USD 118.51 Billion
North America holds 37.4% of the global market, valued at USD 118.51 Billion in 2025. The region leads because early regulatory mandates — including the U.S. EPA’s Low Embodied Carbon Label Program backed by USD 100 Million in IRA funding — created verified procurement channels before other regions. Mature green building certification infrastructure through LEED and an active base of alternative cement startups in the U.S. reinforces North America’s structural lead.
Europe Low-Carbon Construction Materials Market Trends
Europe is the most active region for industrial-scale CCS deployment in cement, anchored by Norway’s Longship program and the EU Innovation Fund. Heidelberg Materials’ Brevik facility and Holcim’s planned Lägerdorf plant represent the first two commercial-scale low-carbon cement operations globally. EU ETS carbon pricing between €70 and €100 per metric ton in 2026 makes unabated cement production commercially punishing, accelerating procurement of CCS-enabled alternatives.
Asia Pacific Low-Carbon Construction Materials Market Trends
Asia Pacific represents the largest volume opportunity by construction activity but lags in regulatory mandates for embodied carbon. India’s planned green steel procurement framework and three-tier classification system signal that the region’s largest infrastructure buyer is beginning to formalize low-carbon material requirements. China’s continued urbanization at scale means even modest policy shifts translate into massive volume demand for verified low-carbon materials.
Latin America Low-Carbon Construction Materials Market Trends
Latin America’s low-carbon construction materials market is in early development, with adoption concentrated in major urban centers where LEED-certified commercial projects drive product demand. Brazil and Mexico show the strongest near-term potential, supported by large cement producer bases that are beginning to evaluate supplementary cementitious materials and alternative kiln fuels as cost-effective carbon reduction tools.
Middle East and Africa Low-Carbon Construction Materials Market Trends
The Middle East and Africa market is driven by large-scale urban development programs and growing adoption of green building standards in Gulf Cooperation Council countries. Saudi Arabia’s Vision 2030 construction pipeline and the UAE’s Estidama green building program are creating structured procurement demand for LEED-aligned low-carbon materials. Africa’s market remains nascent but holds long-term potential as infrastructure investment rises.
Key Regions and Countries
North America
- US
- Canada
Europe
- Germany
- France
- The UK
- Spain
- Italy
- Rest of Europe
Asia Pacific
- China
- Japan
- South Korea
- India
- Australia
- Rest of APAC
Latin America
- Brazil
- Mexico
- Rest of Latin America
Middle East & Africa
- GCC
- South Africa
- Rest of MEA
Regulatory Landscape
The U.S. EPA launched the Low Embodied Carbon Construction Materials Label Program in 2024, backed by USD 100 Million in Inflation Reduction Act funding. This program creates a federal verification standard for low-carbon concrete, steel, asphalt, and glass used in public infrastructure. It converts voluntary carbon reporting into a procurement requirement for federally funded projects, directly expanding the commercial addressable market for certified producers.
Norway’s Longship CCS program committed approximately USD 3.4 Billion over 10 years to support industrial-scale carbon capture in the cement sector. The government covered roughly USD 2.2 Billion of total project costs, establishing a public co-investment model that other jurisdictions — including the UK, Netherlands, and Canada — are now replicating for their own industrial decarbonization programs.
Drivers
Carbon Pricing and Public Procurement Mandates Force Material Substitution at Industrial Scale
EU ETS carbon pricing between €70 and €100 per metric ton in 2026 makes conventional cement production a direct financial liability for European producers. When carbon compliance costs exceed the price premium for low-carbon alternatives, procurement decisions shift without waiting for voluntary sustainability commitments. This is the mechanism that converts policy into market demand — and it is now active across Europe’s largest construction markets.
In July 2024, the U.S. EPA announced nearly USD 160 Million in grants to 38 recipients supporting low-carbon steel, concrete, asphalt, glass, and construction material manufacturing under the Inflation Reduction Act. This funding directly de-risks production scale-up for U.S.-based producers. It also signals to buyers that a verified domestic supply chain for low-carbon construction materials is being built with federal backing.
Public infrastructure programs in the U.S. and Europe now require documented embodied carbon performance from material suppliers. This procurement shift creates a hard commercial barrier for producers without Environmental Product Declarations or third-party carbon certifications. Companies investing in certification infrastructure today are building an access credential that competitors without it will lack entirely.
Restraints
High Capital Intensity and Long Build Timelines Delay Economically Viable Low-Carbon Cement at Scale
Industrial-scale carbon capture infrastructure for cement plants requires multi-billion-dollar capital commitments and build timelines extending five to eight years. Norway’s Longship program covered roughly two-thirds of the Brevik project’s total cost — meaning that without comparable public co-investment, most cement producers cannot justify CCS deployment on commercial returns alone. This limits the pace at which CCS-enabled low-carbon cement can reach mass-market pricing.
Holcim’s Carbon2Business project in Germany targets full net-zero cement production only from 2029 onward, following large-scale CO2 capture deployment exceeding 1.2 million tons annually. That timeline means the supply of commercially priced, CCS-enabled cement remains constrained through 2028 — creating a bottleneck for projects requiring certified low-carbon concrete at scale before then. Buyers with near-term embodied carbon targets will need to rely on material substitution strategies while CCS infrastructure completes.
Persistent dependence on public subsidies is a structural vulnerability for this market. If carbon pricing stalls or subsidy programs face political reversals — as seen in some jurisdictions during 2024 — the commercial case for high-cost CCS investment weakens materially. Producers building business models that depend on continued subsidy flows carry higher revenue risk than those achieving cost parity through production scale alone.
Growth Factors
Alternative Cement Technologies and Near-Zero Emission Feedstocks Unlock New Commercial Supply Channels
Vattenfall and Cemvision’s partnership to supply near-zero emission cement with up to 95% lower CO2 emissions creates a procurement option for renewable energy infrastructure and prefabricated construction that bypasses conventional CCS infrastructure entirely. By using alternative chemistry rather than post-emission capture, this approach dramatically shortens the path to commercial-scale low-carbon cement supply — and targets the prefabrication segment directly, where controlled factory environments support rapid adoption.
Figures from the Financial Times show Norway committed approximately USD 3.4 Billion over 10 years to the Longship CCS program, with the government covering about USD 2.2 Billion of total project costs. This co-investment model — where public funding absorbs first-mover risk and private capital scales the proven technology — is being replicated in the UK, Netherlands, and Canada. Each new jurisdiction that adopts this model creates a new commercial market for low-carbon cement producers with CCS capabilities.
Material Evolution’s UK factory, which launched production in October 2024, targets 150,000 tons of ultra-low carbon cement annually with up to 85% lower embodied CO2 by recycling industrial byproducts. This demonstrates that industrial byproduct recycling offers a scalable, capital-efficient path to low-carbon cement production that does not require CCS infrastructure. For markets where CCS funding is unavailable, this approach unlocks supply at lower capital intensity.
Emerging Trends
Environmental Product Declarations and Branded Low-Carbon Materials Shift Buyer Specifications Toward Traceable Carbon Credentials
Environmental Product Declarations are becoming mandatory procurement tools for green buildings and public infrastructure projects across North America and Europe during 2024 procurement cycles. EPDs function as a carbon nutrition label for construction materials — and once buyers require them for contract qualification, every supplier without one loses access to a growing share of premium project opportunities. This shifts competitive advantage from product performance alone to documented, third-party verified carbon data.
Data from the global steel decarbonization pipeline shows that 93% of newly announced steel projects in 2024 shifted away from coal blast furnace technology toward electric arc furnace production. That concentration of new capacity in low-carbon technology means the steel supply chain is structurally repricing its carbon footprint — and construction buyers sourcing structural steel will encounter a market where low-carbon options are the default, not the premium exception, within this decade.
Branded low-carbon products such as Tokyo Steel’s enso Green Steel, launched in June 2024, signal that traceable carbon identity is becoming a commercial differentiator in the construction materials market. Builders and original equipment manufacturers are demanding materials with verified embodied carbon histories — not just certifications. Producers that invest in carbon traceability infrastructure now are building a brand asset that will command a premium as circular economy compliance requirements expand globally.
Key Companies Insights
Holcim Ltd. is executing the most capital-intensive low-carbon cement strategy in the market through its Carbon2Business project in Lägerdorf, Germany. The facility, built in partnership with thyssenkrupp using pure oxyfuel technology, is designed to capture more than 1.2 million tons of CO2 annually and deliver full net-zero cement production from 2029. Holcim also secured a combined USD 75 Million investment and offtake commitment alongside CRH for Sublime Systems’ true-zero cement technology in September 2024, demonstrating a dual strategy of building CCS infrastructure while hedging toward chemistry-based alternatives.
Heidelberg Materials AG operates the world’s first industrial-scale CCS facility for cement production at Brevik, Norway. The plant captures 400,000 metric tons of CO2 annually and stores it permanently beneath the North Sea through the Northern Lights project. Heidelberg pre-sold 100% of its planned 2025 evoZero cement output before full commercial operation, and began delivering near-zero carbon captured cement to construction customers across Europe in October 2025. Real project applications include Oslo’s Skøyen Station and the DREIHAUS 3D-printing housing project in Germany.
CEMEX S.A.B. de C.V. positions itself as a global leader in low-carbon concrete through its proprietary Vertua product line and active deployment of supplementary cementitious materials across its ready-mix network. CEMEX operates in over 50 countries, giving it a geographic reach advantage over regional CCS-focused competitors. Its strategy focuses on material substitution at scale — a lower-capital approach that delivers near-term carbon reductions across its existing production and distribution infrastructure without waiting for CCS commercialization.
CRH plc combines its position as one of the world’s largest building materials producers with active investment in alternative cement technologies. Its USD 75 Million commitment to Sublime Systems alongside Holcim signals a strategic bet on limestone-free cement chemistry as a complement to CCS-based approaches. CRH’s scale in North American construction markets gives it direct access to the federally funded low-carbon procurement channels created by the Inflation Reduction Act, which it is positioned to leverage as verified supply chains develop through 2026 and beyond.
Key Companies
- Holcim Ltd.
- Heidelberg Materials AG
- CEMEX S.A.B. de C.V.
- CRH plc
- Sika AG
- Saint-Gobain S.A.
- James Hardie Industries plc
- Vulcan Materials Company
- CarbonCure Technologies Inc.
- Solidia Technologies, Inc.
- Ecocem Ireland Ltd.
- Boral Limited
- Others
Recent Development
- In June 2025, Heidelberg Materials inaugurated the Brevik CCS facility in Norway — the cement industry’s first industrial-scale carbon capture plant. The facility captures 400,000 metric tons of CO2 annually from a plant with over 1 million tons of annual cement production capacity.
- In October 2024, CarbonCure Technologies announced it had surpassed 500,000 metric tons of CO2 savings through its carbon-injected concrete technology deployed across 7.5 million truckloads of concrete globally, reaching 50 million cubic yards of lower-carbon concrete production.
- In April 2024, Holcim Germany and thyssenkrupp launched construction of a carbon-neutral cement facility in Lägerdorf, Germany, designed to capture around 1.2 million tons of CO2 annually using pure oxyfuel technology and targeting full net-zero production from 2029.
- In May 2026, Denmark’s Aalborg Portland announced plans to capture 1.25 million tonnes of CO2 annually from cement production by 2030, positioning it as one of Europe’s largest single-site cement decarbonization initiatives.
- In April 2024, ArcelorMittal published Environmental Product Declarations showing up to 67% embodied carbon reduction in its XCarb steel construction products, increasing adoption of low-carbon structural materials across green building projects globally.
Market Scope
| Report Features | Description |
|---|---|
| Market Value (2025) | USD 316.89 Billion |
| Forecast Revenue (2035) | USD 878.93 Billion |
| CAGR (2026-2035) | 10.74% |
| Base Year for Estimation | 2025 |
| Historic Period | 2020-2024 |
| Forecast Period | 2026-2035 |
| Report Coverage | Revenue Forecast, Market Dynamics, Competitive Landscape, Recent Developments |
| Segments Covered | By Material Type (Low-Carbon Cement, Green Concrete, Mass Timber, Low-Carbon Bricks, Bio-Based Insulation, Carbon-Negative Concrete), By Carbon Reduction Strategy (Material Substitution, Carbon Capture Integration, Recycled Material Usage, Renewable Energy Utilization in Production, Circular Construction Practices), By Deployment & Manufacturing Process (Ready-Mix Concrete Production, On-Site Production, Prefabrication / Off-Site Manufacturing, Modular Assembly), By Certification & Compliance (LEED-Certified Materials, BREEAM Standards, ISO 14001 Environmental Management, GreenPro Certification), By Application (Residential Construction, Commercial Construction, Industrial Construction, Infrastructure Projects), By Feedstock Source (Agricultural Waste Fibers, Algae-Based Binders, Hemp-Based Composites, Mycelium Composites), By Carbon Storage Mechanism (Mineralization-Based Materials, Bio-Sequestration Materials, CO2-Injected Concrete), By Circularity Model (Recycled Content Materials, Reusable Modular Components, Urban Mining Materials) |
| Regional Analysis | North America (US and Canada), Europe (Germany, France, The UK, Spain, Italy, and Rest of Europe), Asia Pacific (China, Japan, South Korea, India, Australia, and Rest of APAC), Latin America (Brazil, Mexico, and Rest of Latin America), Middle East & Africa (GCC, South Africa, and Rest of MEA) |
| Competitive Landscape | Holcim Ltd., Heidelberg Materials AG, CEMEX S.A.B. de C.V., CRH plc, Sika AG, Saint-Gobain S.A., James Hardie Industries plc, Vulcan Materials Company, CarbonCure Technologies Inc., Solidia Technologies, Inc., Ecocem Ireland Ltd., Boral Limited, Others |
| Customization Scope | Customization for segments, region/country-level will be provided. Moreover, additional customization can be done based on the requirements. |
| Purchase Options | We have three licenses to opt for: Single User License, Multi-User License (Up to 5 Users), Corporate Use License (Unlimited User and Printable PDF) |