What is the Carbon Capture, Utilization And Storage Market Size?
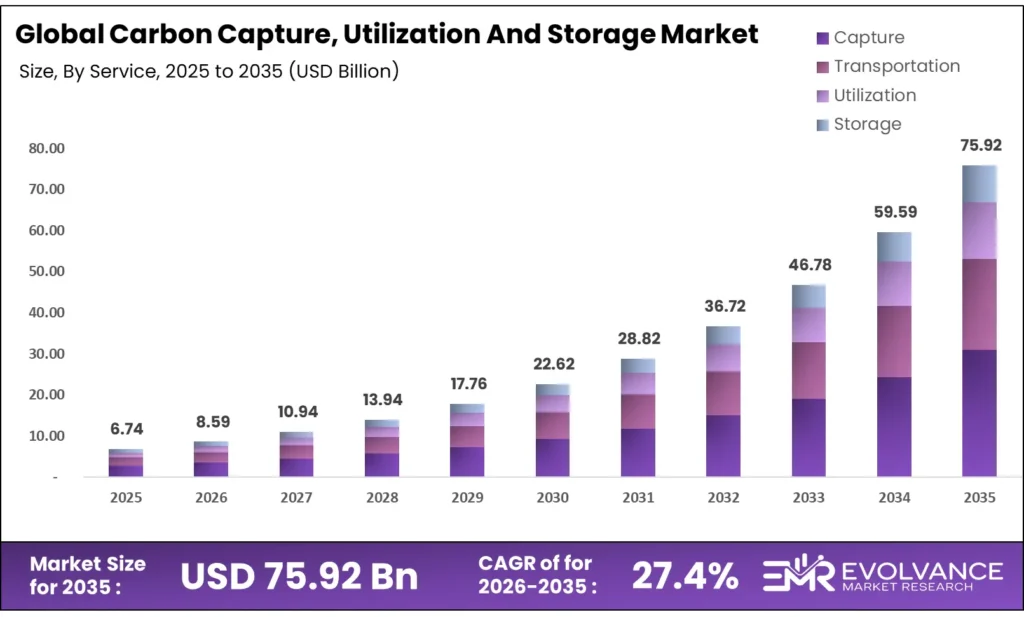
The Global Carbon Capture, Utilization And Storage Market size will be worth around USD 75.92 Billion by 2035 from USD 6.74 Billion in 2025, growing at a CAGR of 27.4% during the forecast period 2026 to 2035. Federal funding mandates and corporate carbon removal contracts are pulling capital into commercial-scale capture infrastructure at a pace that outstrips current supply. Enterprise buyers — including Microsoft and AT&T — are signing long-term offtake contracts, shifting CCUS from a public subsidy play to a private demand market. On the supply side, energy intensity and high build costs remain real constraints that slow deployment even as project pipelines widen.
Market Highlights
- The Global Carbon Capture, Utilization And Storage Market valued at USD 6.74 Billion in 2025, forecast to reach USD 75.92 Billion by 2035 at a CAGR of 27.4%
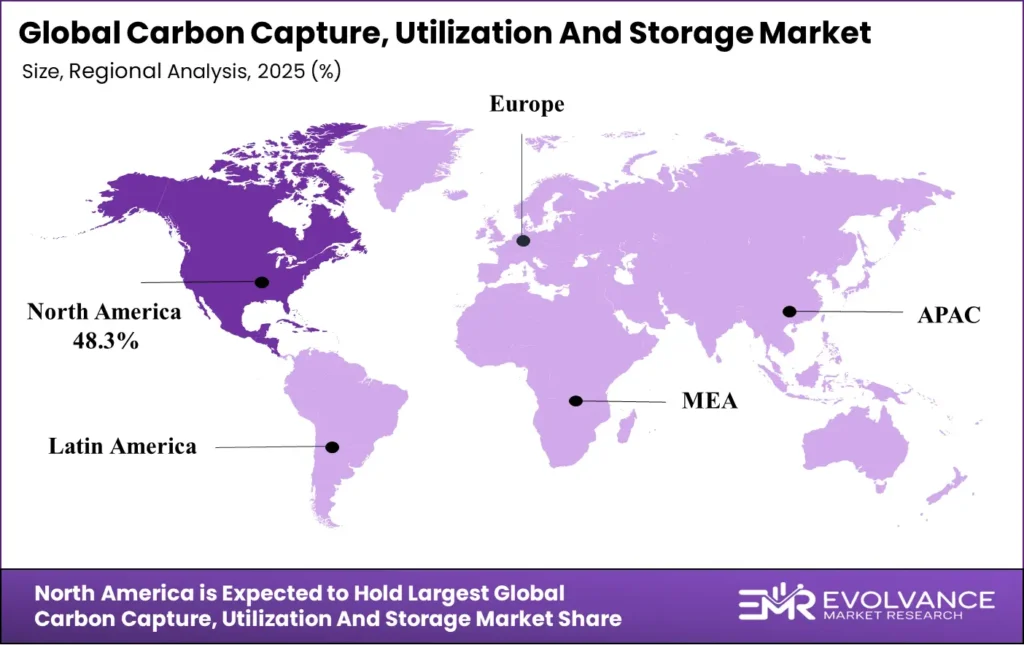
- North America leads with 48.3% market share, valued at USD 3.3 Billion in 2025.
- Capture dominates the By Service segment with a 54.2% share.
- Chemical Looping leads the By Technology segment with a 32.7% share.
- Enhanced Oil Recovery holds the top position in By Application with a 43.1% share.
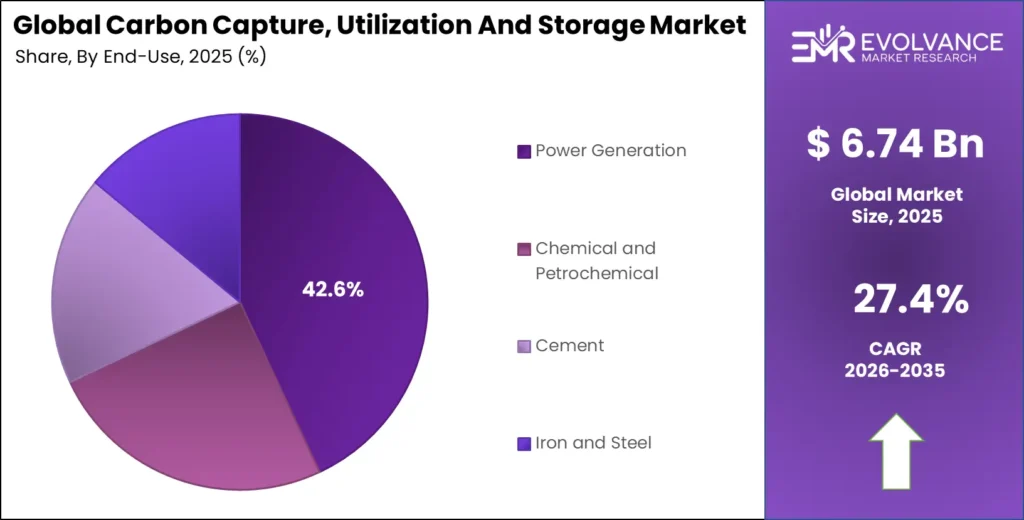
- Power Generation leads the By End-Use segment with a 42.6% share.
Market Overview
The Carbon Capture, Utilization And Storage market covers the full chain of removing CO₂ from industrial or atmospheric sources, moving it through dedicated pipelines, and either storing it underground or converting it into useful products. This chain spans four linked service types: capture, transportation, utilization, and storage. Each stage has distinct technology, cost, and risk profiles that shape where capital flows and where bottlenecks form.
The Carbon Capture, Utilization And Storage is driven by rising demand from hard-to-abate industries such as cement, steel, and power generation, along with growing investments in direct air capture technologies. The market is also gaining momentum alongside the Green Hydrogen Production and Storage, as shared carbon transport and storage infrastructure supports low-carbon hydrogen production and industrial decarbonization initiatives.
Government programs are the primary catalyst for commercial-scale CCUS. The U.S. Department of Energy has deployed a $3.5 Billion Direct Air Capture Hub program targeting four commercial facilities, each capturing 1 Million metric tons annually. Alongside this, an additional $1.8 Billion was announced in December 2024 to extend the program’s reach — a signal that federal commitment to DAC infrastructure is hardening, not softening, despite shifting political cycles.
Operational and under-construction CCUS capture capacity was more than 10% higher between Q1 2025 and Q1 2026. This rate of growth shows that project pipelines are converting into real infrastructure faster than most forecasts assumed. For equipment vendors and engineering firms, this acceleration compresses the window for early positioning before larger players lock in long-term contracts.
CCUS storage capacity increased around 25% between Q1 2025 and Q1 2026. Storage is the part of the chain that has historically lagged capture development — this jump indicates that geological permitting and injection infrastructure are catching up. For project developers, storage constraints have been the primary risk to full-chain viability; their easing opens the door to more bankable project structures.
Service Insights
Capture dominates with 54.2% due to its role as the first and most capital-intensive step.
In 2025, Capture held a dominant market position in the By Service segment of the Carbon Capture, Utilization And Storage Market, with a 54.2% share. Capture commands the largest share because every downstream function — transport, storage, utilization — depends on it. Buyers direct most early capital here, and vendors with proven capture technology hold pricing power.
Transportation is the connective tissue of the CCUS value chain, and its capacity directly constrains how much captured CO₂ can actually reach permanent storage. Northern Lights Phase 1, a European transport and storage project, holds 1.5 million tonnes per year of CO₂ transport and storage capacity. It also received a permit to inject and store 37.5 million tonnes of CO₂ over 25 years — a level of long-term commitment that de-risks the investment case for upstream capture projects that need reliable transport offtake.
Storage is the final and most permanent link in the chain. CF Industries’ Donaldsonville CCS facility can permanently sequester up to 2 million metric tons of CO₂ annually, representing one of the largest single-site industrial storage operations in the U.S. CF Industries invested approximately USD 200 million in the CO₂ dehydration and compression unit that makes this possible — a capital commitment that reflects how seriously industrial emitters are treating permanent storage as a compliance and reputational asset.
Technology Insights
Chemical Looping dominates with 32.7% due to its integrated combustion and capture efficiency.
In 2025, Chemical Looping held a dominant market position in the By Technology segment of the Carbon Capture, Utilization And Storage Market, with a 32.7% share. Chemical looping separates CO₂ during combustion rather than capturing it afterward, which reduces the energy penalty that plagues most post-combustion systems.
Solvents and Sorbents represent the most commercially mature capture method, widely deployed across industrial facilities and post-combustion applications. Their established supply chains and well-understood operating profiles make them the default choice for emitters seeking lower-risk first deployment. However, high regeneration energy costs are pushing buyers toward next-generation alternatives as operating budgets tighten.
Oxy-fuel Combustion burns fuel in pure oxygen rather than air, producing a flue gas that is almost entirely CO₂ and water — dramatically simplifying the capture process. The high cost of producing pure oxygen at scale has limited adoption, but projects integrating on-site air separation with oxy-fuel combustion are beginning to improve the cost profile for large industrial emitters.
Direct Air Capture removes CO₂ directly from ambient air rather than from point sources, making it the only technology that can address historical emissions. DAC costs remain high, but modular deployment and renewable energy integration are improving unit economics. KAIST reported over 95% high-purity CO₂ capture using only smartphone-charging-level power, pointing to a potential step-change in energy efficiency that could reshape DAC’s cost curve.
Application Insights
Enhanced Oil Recovery dominates with 43.1% due to its immediate commercial revenue offset.
In 2025, Enhanced Oil Recovery held a dominant market position in the By Application segment of the Carbon Capture, Utilization And Storage Market, with a 43.1% share. EOR uses injected CO₂ to increase oil extraction from mature fields, meaning the carbon has a direct commercial use that partially funds capture and transport costs. This built-in revenue model makes EOR the most financially self-sustaining application in the CCUS portfolio, explaining why it attracted capital long before other applications became viable at scale.
Dedicated Geological Storage is the permanent disposal option for CO₂ that has no commercial use case. It depends entirely on regulatory mandates and carbon pricing to fund operating costs, making it more sensitive to policy shifts than EOR. However, its long-term importance to climate targets is non-negotiable — without large-scale permanent storage, the total volume of CO₂ that can be removed from the economy is fundamentally limited.
Industrial CO₂ Utilization covers food-grade CO₂, industrial gas applications, and chemical feedstock uses. This segment provides a near-term revenue stream for capture operators, but market size is limited by the actual industrial demand for CO₂ as a feedstock. As utilization infrastructure scales, this segment is expected to grow beyond its current niche role.
End-Use Insights
Power Generation dominates with 42.6% due to its large point-source emissions and regulatory pressure.
In 2025, Power Generation held a dominant market position in the By End-Use segment of the Carbon Capture, Utilization And Storage Market, with a 42.6% share. Power plants emit CO₂ at concentrations and volumes that make post-combustion capture economically viable at scale. Regulatory decarbonization timelines for the power sector are firm in most major markets, forcing utilities to act within defined timeframes rather than waiting for further cost reductions in capture technology.
Chemical and Petrochemical facilities represent the second-largest end-use group. These operations produce high-concentration CO₂ streams from refining and chemical synthesis, which lowers the capture cost compared to dilute flue gas sources. As carbon pricing tightens, petrochemical operators face growing pressure to add CCS to existing facilities or accept higher compliance costs.
Cement is one of the hardest sectors to decarbonize because CO₂ is released through the chemical process of calcination — not just from burning fuel. This makes fuel-switching ineffective and CCUS essential. Cement plants adopting CCS are investing in a long-term structural advantage, since competitors without capture infrastructure will face escalating carbon costs as regulatory frameworks tighten.
Iron and Steel producers face similar structural constraints. The carbon released during steelmaking is embedded in the production chemistry, not just the energy source. CCUS gives steel producers a pathway to maintain blast furnace-based production while meeting emissions targets — relevant for markets where switching to green hydrogen-based direct reduction is too costly or too slow.
Market Segments Covered in the Report
By Service
- Capture
- Transportation
- Utilization
- Storage
By Technology
- Chemical Looping
- Solvents and Sorbents
- Membranes
- Oxy-fuel Combustion
- Direct Air Capture
- Others
By Application
- Enhanced Oil Recovery
- Dedicated Geological Storage
- Industrial CO₂ Utilization
- Synthetic Fuels and Chemicals
- Mineralization / Building Materials
By End-Use
- Power Generation
- Chemical and Petrochemical
- Cement
- Iron and Steel
Regional Insights
North America Dominates the Carbon Capture, Utilization And Storage Market with a Market Share of 48.3%, Valued at USD 3.3 Billion
North America holds 48.3% of the global CCUS market, valued at USD 3.3 Billion in 2025. Federal programs like the $3.5 Billion DAC Hub initiative and Section 45Q tax credits have created a funding infrastructure that no other region matches in depth or speed. This policy density is attracting private capital at a scale that makes the U.S. the default home for first-mover commercial DAC and geological storage projects.
Europe Market Trends
Europe is the global leader in CCUS commercial bank financing, accounting for around 85% of the more than USD 15 Billion in commercial CCUS debt raised over the past two years. The UK’s contract-for-difference support mechanism for CCUS clusters has made British projects bankable in ways that continental projects have not yet replicated. Norway’s Northern Lights infrastructure adds a cross-border storage dimension that further strengthens the region’s competitive position.
Asia Pacific Market Trends
Asia Pacific is building real operational track record in CCUS. Australia’s Gorgon CCS project had stored more than 11 million tonnes of CO₂ as of July 2025, while the Moomba CCS project stored more than 1 million tonnes CO₂-equivalent in the same period. These operational milestones are valuable because they generate the performance data that governments and investors need to justify funding the next generation of larger projects across Japan, South Korea, and Southeast Asia.
Latin America Market Trends
Latin America is an early-stage CCUS market where activity centers on oil and gas operations with high CO₂ content streams, particularly in Brazil’s pre-salt offshore fields. Petrobras has piloted CO₂ reinjection at scale, providing a working model for the region. However, the absence of carbon pricing mechanisms and dedicated CCUS policy frameworks limits private capital deployment across most of the region’s industrial base.
Middle East & Africa Market Trends
The Middle East is positioning CCUS as a tool to maintain hydrocarbon export competitiveness under a decarbonizing global economy. Saudi Aramco and ADNOC have announced or are developing carbon capture infrastructure tied to upstream oil operations. For these national oil companies, CCUS is a strategic hedge — a way to extend the commercial life of fossil fuel assets while meeting international climate commitments from buyer nations.
Key Regions and Countries
North America
- US
- Canada
Europe
- Germany
- France
- The UK
- Spain
- Italy
- Rest of Europe
Asia Pacific
- China
- Japan
- South Korea
- India
- Australia
- Rest of APAC
Latin America
- Brazil
- Mexico
- Rest of Latin America
Middle East & Africa
- GCC
- South Africa
- Rest of MEA
Regulatory Landscape
The U.S. Inflation Reduction Act, enacted in 2022 and actively expanded through 2024–2025, raised the Section 45Q tax credit for permanent CO₂ storage to $85 per tonne and to $180 per tonne for direct air capture. These credits run for 12 years per project and have become the primary financial anchor for U.S. commercial CCUS development, shifting project viability from speculative to bankable across dozens of facilities.
The European Union’s Net Zero Industry Act, finalized in 2024, set a target of 50 million tonnes of annual CO₂ geological storage capacity by 2030. Member states must now develop national storage assessment plans, creating a binding policy floor that forces industry engagement. This target is ambitious relative to current European storage capacity, which means the regulatory pressure itself will drive investment whether or not cost thresholds are met.
Norway’s Petroleum Safety Authority issued permits for CO₂ injection at the Northern Lights storage site, with the most recent permit covering 37.5 million tonnes over 25 years. Norway’s regulatory process for offshore CO₂ storage is now the most advanced and legally tested in the world. Other nations seeking to develop offshore storage — including the UK and the Netherlands — are actively adapting Norway’s permitting model to their own frameworks.
Drivers
Federal DAC Funding and Corporate Offtake Contracts Accelerate Commercial Infrastructure Build-Out
The U.S. DOE’s $3.5 Billion DAC Hub program, extended with an additional $1.8 Billion in December 2024, is the single largest public commitment to carbon removal infrastructure in history. These programs target four commercial facilities, each capturing 1 million metric tons annually. For vendors and project developers, this is not a research grant — it is demand-side certainty that justifies committing to build.
Occidental’s 1PointFive subsidiary secured up to $500 million in DOE support for its South Texas DAC Hub, with potential total support rising to $650 million for regional carbon infrastructure expansion. This deal shows that the federal program is functioning as intended: attracting private capital at multiples of the public contribution. According to the IEA, more than USD 15 billion in commercial CCUS debt was raised over the past two years, confirming that institutional finance has moved beyond pilot interest into full project financing mode.
Corporate buyers are accelerating this shift. Microsoft, AT&T, and other large enterprises have signed long-term carbon removal procurement contracts with DAC developers, creating private offtake markets that operate independently of government grants. This buyer behavior marks a structural change — CCUS is now generating contracted revenue from private buyers, which makes project financing far more straightforward than subsidy-dependent models.
Restraints
High Energy and Capital Costs of Direct Air Capture Limit Commercial Viability Outside Subsidized Projects
Direct air capture remains one of the most energy-intensive industrial processes in use today. Pulling CO₂ from ambient air at concentrations of roughly 0.04% requires orders of magnitude more energy per tonne than capturing it from a concentrated industrial flue gas stream. This physics constraint cannot be engineered away — it can only be managed through cheaper energy inputs and improved sorbent materials.
DAC credits actually delivered stood at just 1,186 tonnes by mid-2025, representing around 0.05% of more than 2 million contracted DAC credits. This gap between contracted volume and actual delivery is a commercial risk signal. Buyers who have committed capital to carbon removal are not receiving the volumes they paid for — a credibility problem that could slow future procurement if not addressed by operational scale-up.
Additionally, environmental critics and some institutional investors are applying pressure to oil majors participating in CCUS, accusing them of using carbon capture to justify continued fossil fuel expansion. This reputational risk is not purely symbolic — it affects how banks and ESG-focused funds assess the credit quality of CCUS projects backed by fossil fuel companies, adding a financing premium that tightens already thin project margins.
Growth Factors
Multi-State Carbon Transport Networks and Renewable-Powered DAC Unlock New Project Economics
The expansion of U.S. regional DAC hub ecosystems into multi-state carbon transport and geological storage networks is creating infrastructure that serves multiple capture facilities from a shared pipeline and storage backbone. Federal support for these networks can rise to $650 million per project cluster, making shared infrastructure financially viable at a scale that individual projects could not reach alone. This model lowers per-tonne transport and storage costs for all users on the network.
Integration of renewable energy with carbon capture facilities is reshaping the cost structure for DAC. Texas-based wind-powered DAC projects target 50,000 tonnes of annual CO₂ removal before scaling toward 500,000 tonnes. When DAC runs on near-zero-cost renewable power, the energy penalty that makes it expensive shrinks significantly. KAIST research showed over 95% high-purity CO₂ capture using smartphone-charging-level power — if replicable at scale, this efficiency level changes the entire commercial case for low-energy DAC systems.
Technology consolidation is also creating structural cost reductions. Occidental’s $1.1 Billion acquisition of Carbon Engineering brought in-house DAC technology under one corporate roof, enabling faster iteration and cost reduction than a partnership model allows. Gevo agreed to acquire Red Trail Energy’s ethanol and carbon sequestration assets in North Dakota for $210 million in September 2024, combining biogenic CO₂ capture with sustainable aviation fuel production — a carbon utilization model that generates revenue from both the fuel and the carbon market.
Emerging Trends
Megaton-Scale DAC Facilities and Modular Architectures Redefine Commercial Deployment Expectations
The STRATOS facility in Texas is built to become the world’s largest operational direct air capture plant, with 500,000-tonne annual capacity targeted by 2025. STRATOS represents a proof point for the industry: that megaton-scale DAC is an engineering and finance problem, not a physics problem. Its operational performance will set the benchmark that buyers, investors, and policymakers use to evaluate every subsequent DAC project proposal.
Modular DAC architectures are changing how developers approach capacity expansion. Rather than building a single large facility and waiting for it to operate before adding more, modular systems allow incremental expansion with each new unit adding to total output. This approach reduces upfront capital risk and shortens the time between investment decision and first tonne captured. Climeworks’ Mammoth plant in Iceland, with 36,000-tonne annual capacity and a modular expansion strategy, is the clearest commercial example of this approach at scale.
Public-private partnerships are becoming the dominant financing structure for large CCUS networks. Trafigura agreed in January 2024 to purchase carbon dioxide removal credits from 1PointFive’s STRATOS facility, supporting its First Movers Coalition commitments. Partnerships like this — between commodity traders, energy majors, climate tech firms, and infrastructure investors including BlackRock — are creating the financing coalitions needed to fund projects that no single institution would back alone.
Key Companies Insights
Fluor Corporation is one of the most experienced engineering firms in carbon capture project delivery, with involvement in large-scale CCUS infrastructure across North America and Europe. Fluor’s strength lies in its full EPC capability — it can manage design, procurement, and construction of capture facilities under a single contract. In markets where project schedule and cost overruns are the primary commercial risk, this integrated delivery model is a real competitive advantage over pure technology licensors who rely on third-party builders.
Exxon Mobil Corporation is pursuing CCUS both as an emissions management tool and as a standalone business line. Exxon is developing a large-scale carbon capture and storage hub on the U.S. Gulf Coast targeting industrial emitters in the region, and expanded its joint carbon capture agreement with FuelCell Energy. Exxon’s scale gives it access to geological storage assets, pipeline networks, and balance sheet capacity that most CCUS specialists cannot match — positioning it to function as a carbon storage service provider rather than just an end-user.
Shell Plc is building CCUS positions across multiple continents, with particular focus on natural gas processing facilities where CO₂ separation is already part of operations. Shell’s Quest CCS project in Canada has stored more than 7 million tonnes of CO₂ since 2015, giving it one of the longest operational track records in the industry. This operating history matters because it provides real cost, performance, and reliability data that Shell uses to optimize future project designs and win customer confidence.
Equinor ASA is the operator behind Northern Lights, the world’s first commercial cross-border CO₂ transport and storage service. Northern Lights Phase 1 holds 1.5 million tonnes per year of storage capacity and received regulatory approval to inject and store 37.5 million tonnes over 25 years. Equinor’s position as storage infrastructure operator gives it a structural role in European CCUS — industrial emitters across the continent need its storage capacity to complete their own carbon compliance plans.
Key Companies
- Fluor Corporation
- Exxon Mobil Corporation
- Siemens AG
- Shell Plc
- Hitachi, Ltd.
- GE Vernova
- Equinor ASA
- TotalEnergies SE
- Linde Plc
- Mitsubishi Heavy Industries, Ltd.
- JGC Holdings Corporation
- Schlumberger Limited
- Aker Solutions
- Honeywell International
Recent Development
- In September 2024, 1PointFive secured up to $500 million in DOE funding for its South Texas Direct Air Capture Hub, with potential total support rising to $650 million for regional carbon infrastructure expansion. The project targets more than 1 million metric tons of annual CO₂ removal capacity.
- In November 2024, BP and partners announced a $7 billion investment in a CCUS-enabled gas development project in Papua, Indonesia. The project is designed to sequester approximately 15 million tonnes of CO₂ from the Tangguh LNG facility.
- In January 2024, Trafigura agreed to purchase carbon dioxide removal credits from 1PointFive generated by the STRATOS DAC facility in Texas, supporting Trafigura’s First Movers Coalition commitments. This deal marks one of the first large-scale corporate offtake agreements for DAC credits in the voluntary carbon market.
- In March 2024, SLB announced plans to acquire 80% majority ownership in Aker Carbon Capture through a combined carbon capture joint venture. The deal consolidates two significant capture technology portfolios under one operator focused on scaling commercial deployment.
Market Scope
| Report Features | Description |
|---|---|
| Market Value (2025) | USD 6.74 Billion |
| Forecast Revenue (2035) | USD 75.92 Billion |
| CAGR (2026-2035) | 27.4% |
| Base Year for Estimation | 2025 |
| Historic Period | 2020-2024 |
| Forecast Period | 2026-2035 |
| Report Coverage | Revenue Forecast, Market Dynamics, Competitive Landscape, Recent Developments |
| Segments Covered | By Service (Capture, Transportation, Utilization, Storage), By Technology (Chemical Looping, Solvents and Sorbents, Membranes, Oxy-fuel Combustion, Direct Air Capture, Others), By Application (Enhanced Oil Recovery, Dedicated Geological Storage, Industrial CO₂ Utilization, Synthetic Fuels and Chemicals, Mineralization / Building Materials), By End-Use (Power Generation, Chemical and Petrochemical, Cement, Iron and Steel) |
| Regional Analysis | North America (US and Canada), Europe (Germany, France, The UK, Spain, Italy, and Rest of Europe), Asia Pacific (China, Japan, South Korea, India, Australia, and Rest of APAC), Latin America (Brazil, Mexico, and Rest of Latin America), Middle East & Africa (GCC, South Africa, and Rest of MEA) |
| Competitive Landscape | Fluor Corporation, Exxon Mobil Corporation, Siemens AG, Shell Plc, Hitachi Ltd., GE Vernova, Equinor ASA, TotalEnergies SE, Linde Plc, Mitsubishi Heavy Industries Ltd., JGC Holdings Corporation, Schlumberger Limited, Aker Solutions, Honeywell International |
| Customization Scope | Customization for segments, region/country-level will be provided. Moreover, additional customization can be done based on the requirements. |
| Purchase Options | We have three licenses to opt for: Single User License, Multi-User License (Up to 5 Users), Corporate Use License (Unlimited User and Printable PDF) |
