What is the Bioenergy Market Size?
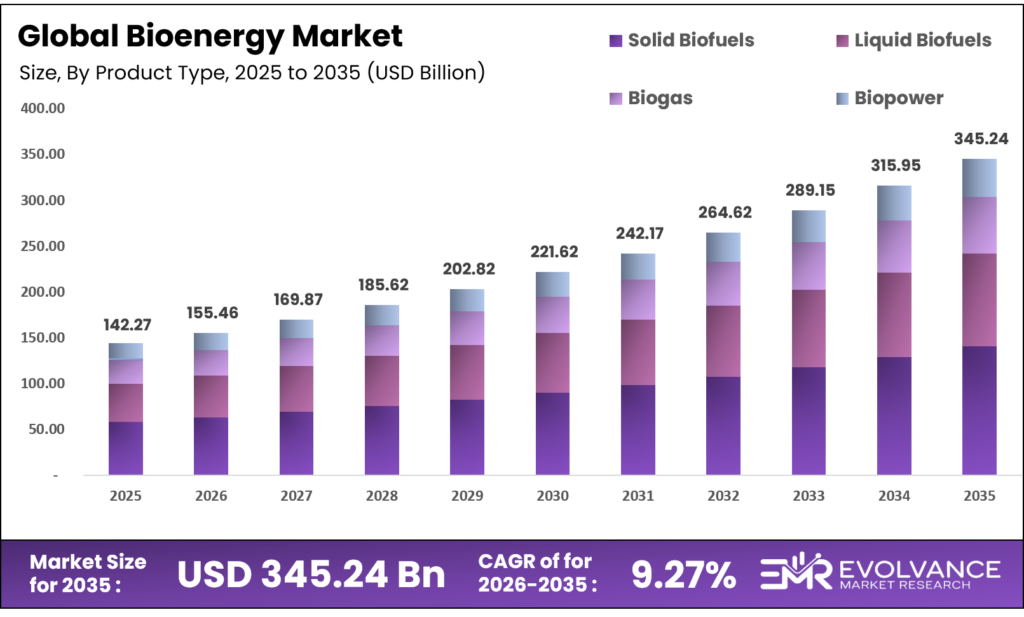
The Global Bioenergy Market size will be worth around USD 345.24 Billion by 2035 from USD 142.27 Billion in 2025, growing at a CAGR of 9.27% during the forecast period 2026 to 2035. Government renewable fuel mandates and corporate decarbonization targets are pulling bioenergy out of niche status and into core energy strategy. Enterprise buyers are shifting procurement toward certified low-carbon bioenergy to meet ESG and compliance obligations. Feedstock price volatility, however, remains a structural risk that constrains project financing across multiple regions.
Market Highlights
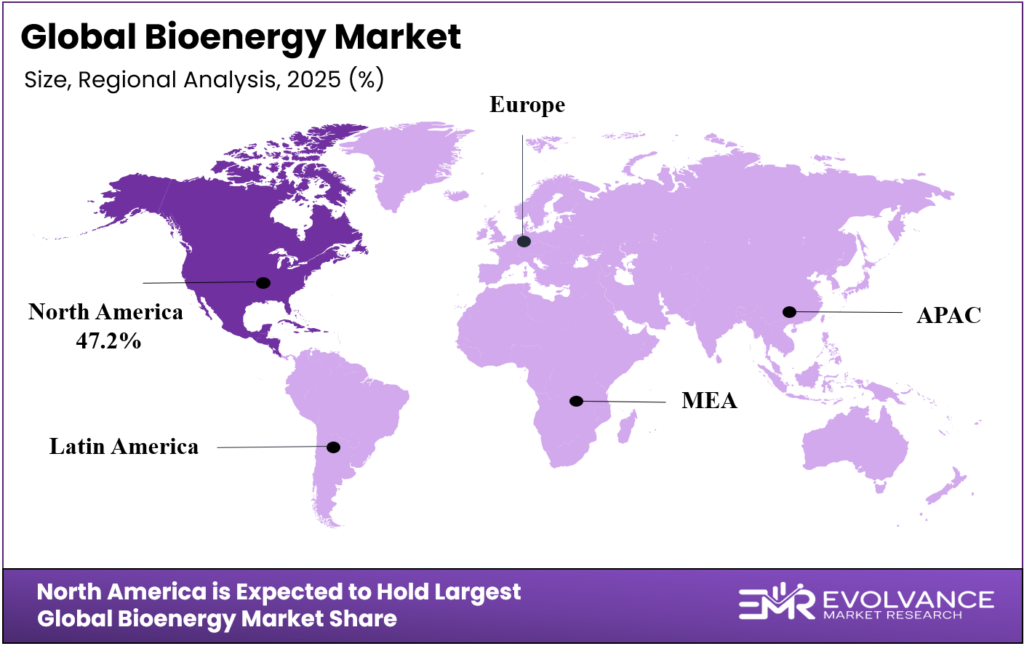
- North America leads all regions with a 47.2% share, valued at USD 67.15 Billion in 2025.
- Solid Biofuels dominate the product type segment with a 68.2% share.
- Direct Sales (B2B) leads distribution channels with a 54.7% share.
- Boilers and Turbines hold the top component position with a 42.6% share.
- Power Generation accounts for 43.9% of total application demand.
- Wood and Woody Biomass leads feedstock with a 39.7% share.
- Combustion dominates the process segment with a 59.1% share.
- Agricultural Residues lead material type with a 38.7% share.
Market Overview
Bioenergy covers energy produced from organic matter solid fuels such as wood pellets, liquid fuels such as biodiesel and ethanol, biogas, and biomass-based power. These products serve power utilities, industrial operators, transport fleets, and heating systems. The market spans the full value chain from raw feedstock sourcing through conversion, distribution, and end use.
Demand is no longer shaped by energy security alone. Corporate net-zero pledges and national emissions targets now drive procurement decisions. Bioenergy sits at the intersection of renewable energy policy and waste valorization giving it a structural role that neither wind nor solar alone can fill in sectors such as aviation, shipping, and heavy industry.
Policy frameworks are tightening and expanding simultaneously. The U.S. Environmental Protection Agency’s finalized Renewable Fuel Standard set the 2026 biomass-based diesel requirement at 8.86 billion RIN-equivalent gallons, rising to 8.95 billion in 2027. This signals that federal buyers of compliance credits will absorb larger volumes each year giving producers a visible, growing demand floor.
According to the International Energy Agency, more than 50 new biogas and biomethane policies were introduced globally since its first landmark report. This wave of regulation is not just adding compliance cost it is creating investable revenue streams for project developers and technology suppliers who can navigate certification requirements.
As reported by the EPA’s RIN tracking system, approximately 23.25 billion Renewable Identification Numbers were generated in 2025, reflecting the scale of production and compliance activity already underway. That volume proves the market is not a future-state story it is a live, operating commercial system with measurable throughput and growing infrastructure.
Product Type Insights
Solid Biofuels dominate with 68.2% due to established combustion infrastructure and wood pellet supply chains.
In 2025, Solid Biofuels held a dominant market position in the By Product Type segment of the Bioenergy Market, with a 68.2% share. Their lead reflects decades of industrial investment in co-firing, dedicated biomass power plants, and district heating networks. Utility operators prefer solid fuels because they integrate directly into existing thermal assets without major capital conversion a structural advantage that liquid and gas alternatives cannot easily replicate at scale.
Liquid Biofuels are gaining commercial ground as transport decarbonization timelines tighten. Soybean oil use in U.S. biomass-based diesel reached a forecast of 13.9 billion pounds in 2025, a 6% rise from the prior year, based on USDA data. Renewable jet fuel RINs jumped 157% year-on-year under EPA reporting, showing that liquid biofuels are moving fastest in the highest-value transport categories.
Biogas benefits from a unique dual role it manages organic waste while producing energy, giving it regulatory and commercial support that pure energy products lack. An IEA Bioenergy report identifies 53 distinct sustainability effects linked to biogas systems, spanning agriculture, waste, transport, and energy sectors. This breadth of benefit makes biogas a strong fit for ESG-aligned project financing.
Distribution Channel Insights
Direct Sales (B2B) dominates with 54.7% due to long-term offtake agreements and bulk volume procurement structures.
In 2025, Direct Sales (B2B) held a dominant market position in the By Distribution Channel segment of the Bioenergy Market, with a 54.7% share. Large utility operators, industrial energy buyers, and fuel blenders procure bioenergy directly from producers under multi-year contracts. This structure locks in volume, stabilizes producer revenue, and gives buyers supply certainty reducing the commercial risk that spot-market purchasing would expose both sides to.
Retail Fuel Stations deliver liquid biofuels to end consumers and fleet operators. The EU’s ReFuelEU Aviation regulation, which mandates a minimum 2% SAF blend at all EU airports beginning in 2025, is pulling SAF into aviation retail channels that previously carried only conventional jet fuel.
Component Insights
Boilers and Turbines dominate with 42.6% due to their central role in biomass combustion power generation.
In 2025, Boilers and Turbines held a dominant market position in the By Component segment of the Bioenergy Market, with a 42.6% share. Their lead reflects the combustion process holding a 59.1% share of total bioenergy processing the most widely deployed conversion method. Boilers and turbines are the core hardware enabling that process, so their demand moves in direct proportion to combustion capacity expansion globally.
Anaerobic Digesters are the enabling hardware for biogas production. Brazil alone operated 1,349 electricity-generating biogas facilities in 2025, as reported by the World Bioenergy Association illustrating the scale of digester deployment in high-feedstock-availability markets.
Application Insights
Power Generation dominates with 43.9% due to utility-scale biomass capacity and grid integration mandates.
In 2025, Power Generation held a dominant market position in the By Application segment of the Bioenergy Market, with a 43.9% share. Biomass power plants offer dispatchable capacity that governments value as a complement to intermittent renewables. Utilities holding renewable portfolio obligations treat biomass power as a firm-capacity solution one that satisfies compliance requirements while avoiding the grid storage costs that solar and wind require.
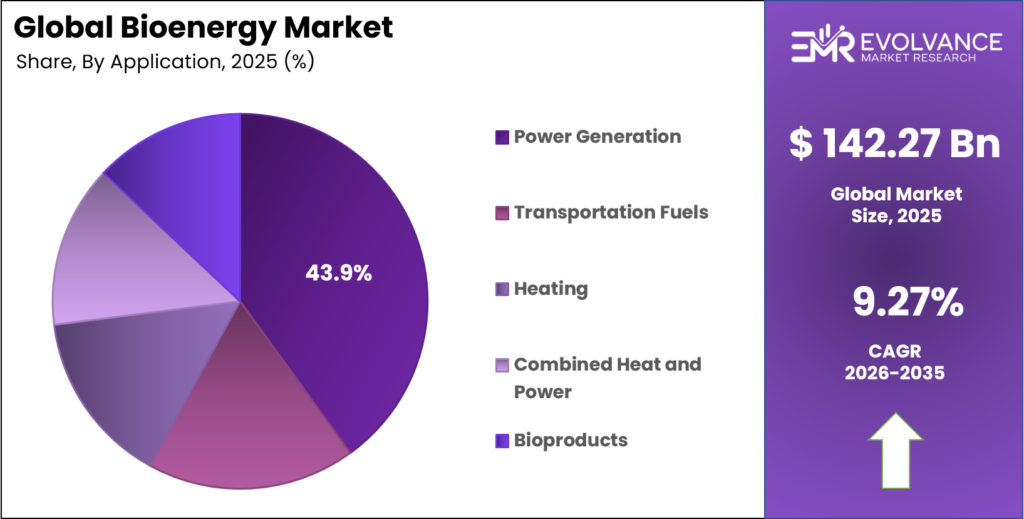
Transportation Fuels are the fastest-moving application by volume growth. Combined renewable diesel and biodiesel covered 9.6% of the 58-billion-gallon-per-year U.S. diesel market in 2025, per OSTI data. As that share rises, transport fuel becomes a larger commercial battleground for bioenergy producers competing on carbon intensity and feedstock cost.
Feedstock Insights
Wood and Woody Biomass dominates with 39.7% due to established forestry supply chains and high energy density.
In 2025, Wood and Woody Biomass held a dominant market position in the By Feedstock segment of the Bioenergy Market, with a 39.7% share. Forestry residues, sawmill by-products, and dedicated energy crops provide a reliable, high-density feedstock stream. Pellet producers and utility buyers have invested heavily in this supply chain over two decades making it the most commercially mature feedstock category in the market.
Solid Waste encompasses municipal solid waste and industrial organic residues. About 20% of methane from waste is currently captured as biogas, accounting for 75% of total biogas output from that feedstock category, as reported by the World Bioenergy Association. The remaining 80% represents a large untapped resource that waste-to-energy projects can target.
Vegetable Oils serve as the primary feedstock for biodiesel and renewable diesel. Canola oil use in biofuels is forecast to reach 4.3 billion pounds in 2025, a 0.4 billion pound increase per USDA data. In 2025, California hosted 5 renewable diesel plants with 1.684 billion gallons of annual capacity the largest state-level base in the U.S., largely fed by vegetable oil inputs.
Sugarcane is the dominant bioenergy feedstock in Brazil, where the country produced approximately 4.7 billion cubic metres of biogas in the latest reporting period, per the World Bioenergy Association. Sugarcane-based ethanol remains one of the lowest-carbon liquid fuels available at commercial scale globally.
Process Insights
Combustion dominates with 59.1% due to its proven thermal efficiency and compatibility with existing power infrastructure.
In 2025, Combustion held a dominant market position in the By Process segment of the Bioenergy Market, with a 59.1% share. Its lead reflects decades of industrial investment in boiler and turbine technology matched to solid biomass fuels. For utility operators converting coal assets to biomass, combustion requires the least technical modification making it the path of least resistance for near-term renewable capacity delivery.
Anaerobic Digestion converts organic waste into biogas and digestate. The IEA reports operational biogas plants emit methane equivalent to roughly 6% of their total gas output on average, with monitored facilities typically in the 2%–5% range. Closing this gap through monitoring and equipment upgrades is both a regulatory priority and a commercial opportunity for equipment suppliers.
Transesterification is the standard chemical process for biodiesel production from oils and fats. As of January 2025, the U.S. operated 48 biodiesel plants with 1.986 billion gallons of annual capacity, per EIA data. Iowa’s 8 plants alone held 427 million gallons of capacity reflecting geographic concentration around soybean feedstock supply.
Agricultural Residues dominate with 38.7% due to wide availability and low-cost supply from grain and oilseed production.
In 2025, Agricultural Residues held a dominant market position in the By Material Type segment of the Bioenergy Market, with a 38.7% share. Corn stover, wheat straw, and rice husks are available at minimal cost as by-products of food production, making them the most accessible low-cost feedstock for bioenergy projects. Their availability is directly tied to agricultural output giving them supply predictability that purpose-grown energy crops cannot match on cost.
Market Segments Covered in the Report
By Product Type
- Solid Biofuels
- Liquid Biofuels
- Biogas
- Biopower
By Distribution Channel
- Direct Sales (B2B)
- Wholesale/Distributors
- Retail Fuel Stations
By Component
- Boilers and Turbines
- Generators
- Anaerobic Digesters
- Gasifiers
- Feedstock Processing Equipment
By Application
- Power Generation
- Transportation Fuels
- Heating
- Combined Heat and Power (CHP)
- Bioproducts
By Feedstock
- Wood and Woody Biomass
- Agricultural Waste
- Solid Waste
- Vegetable Oils
- Sugarcane
- Algae
By Process
- Combustion
- Anaerobic Digestion
- Gasification
- Pyrolysis
- Transesterification
- Fermentation
- Direct Liquefaction
By Material Type
- Agricultural Residues
- Wood and Woody Biomass
- Municipal Solid Waste
- Energy Crops
- Animal Manure
- Industrial Waste
Regional Insights
North America Dominates the Bioenergy Market with a Market Share of 47.2%, Valued at USD 67.15 Billion
North America holds a 47.2% share valued at USD 67.15 Billion in 2025. This lead reflects the U.S. Renewable Fuel Standard, which generates mandatory compliance volume from fuel producers each year. The U.S. alone operated 19 renewable diesel plants with 4.719 billion gallons of annual capacity as of January 2025, per EIA data. No other region has built comparable infrastructure depth in this product category.
Europe Market Trends
Europe is the second-largest bioenergy region, anchored by the EU’s binding renewable energy targets and robust biomass power capacity. The ReFuelEU Aviation regulation, mandating a 2% SAF blend at all EU airports from 2025, is pulling new capital into European SAF production. The European Commission links SAF directly to its target of a 55% greenhouse gas cut by 2030 making bioenergy a policy-critical asset class for European energy investors.
Asia Pacific Market Trends
Asia Pacific is the fastest-growing bioenergy region, driven by energy access gaps, agricultural waste availability, and national renewable energy mandates. Brazil’s biogas model 1,349 electricity-generating biogas plants and 54 biomethane production sites per World Bioenergy Association data provides a replicable template for Southeast Asian and South Asian markets with comparable feedstock conditions.
Latin America Market Trends
Latin America’s bioenergy base is built on sugarcane ethanol and biogas from agricultural operations. Brazil produced approximately 4.7 billion cubic metres of biogas in its latest reporting period, per the World Bioenergy Association. That output positions Brazil as a global benchmark for agricultural-waste-to-energy conversion and creates export opportunities for technology suppliers targeting similar agro-industrial markets.
Middle East & Africa Market Trends
The Middle East and Africa region has the lowest current bioenergy penetration but the highest feedstock availability per capita in sub-Saharan Africa. Decentralized biomass and biogas facilities are the most commercially viable entry model serving off-grid communities where grid electricity costs are high and organic waste volumes are large enough to support small-scale digester economics.
Key Regions and Countries
North America
- US
- Canada
Europe
- Germany
- France
- The UK
- Spain
- Italy
- Rest of Europe
Asia Pacific
- China
- Japan
- South Korea
- India
- Australia
- Rest of APAC
Latin America
- Brazil
- Mexico
- Rest of Latin America
Middle East & Africa
- GCC
- South Africa
- Rest of MEA
Regulatory Landscape
The U.S. EPA finalized its Renewable Fuel Standard for 2026 and 2027, setting the advanced biofuel requirement at 10.82 billion RIN-equivalent gallons in 2026, rising to 10.98 billion in 2027. This rule directly links fuel producer compliance obligations to bioenergy output volumes creating a government-backed demand floor that reduces investment risk for new production capacity.
The EU’s ReFuelEU Aviation regulation took effect in 2025, mandating a minimum 2% SAF blend at all EU airports. Current certified aviation fuel systems can accept SAF blends of up to 50% without aircraft changes, per European Commission guidance. This regulatory pathway sets a clear trajectory for SAF blending to scale without requiring new aircraft certification lowering the adoption barrier for airlines.
The IEA documented more than 50 new biogas and biomethane policies introduced globally through 2025, covering production incentives, injection rights, and green gas certification. These policies are expanding the investable project pipeline beyond the established markets of Germany, Denmark, and the U.S. opening commercially viable biogas opportunities in markets that previously lacked the policy framework to attract project finance.
Carbon intensity thresholds are becoming a compliance condition rather than a marketing attribute. Maintaining a carbon intensity below 46 gCO2e/MJ for renewable propane is required to qualify for 2025 RIN credits, per published government specifications. Producers who cannot meet these thresholds are locked out of the compliance market making feedstock selection and process efficiency direct financial variables, not just operational choices.
Drivers
Government Renewable Fuel Mandates Accelerating Commercial Bioenergy Deployment
Mandatory renewable fuel standards create non-negotiable demand for bioenergy output. The EPA’s RFS generated approximately 23.25 billion RINs in 2025, covering ethanol, biodiesel, renewable diesel, and SAF. Producers who can supply compliant volumes hold a structurally advantaged position compliance demand does not contract with energy prices the way voluntary demand does.
Decarbonization commitments across power, transport, and industry are pulling bioenergy into sectors that previously had no renewable fuel pathway. The EU’s commitment to a 55% greenhouse gas cut by 2030 names SAF as a critical tool for aviation a sector where electrification is not commercially viable on that timeline. This policy positioning makes bioenergy investment in SAF production a low-regulatory-risk bet for the current decade.
Additionally, agricultural and forestry residue utilization is converting a cost center waste disposal into a revenue asset. Feedstock suppliers who previously paid to dispose of crop residues can now sell them into bioenergy supply chains. This reversal of cash flow in the feedstock tier strengthens the circular bioeconomy model and reduces the all-in cost of bioenergy production.
Restraints
Feedstock Price Volatility Constraining Project Margins and Investment Returns
Bioenergy project economics depend on stable feedstock costs. Soybean oil the largest single input for U.S. biomass-based diesel at 13.9 billion pounds of forecast use in 2025 competes directly with food, feed, and industrial buyers. When food or chemical demand spikes, bioenergy producers face input cost pressure that is difficult to pass through to fuel buyers locked into long-term contracts.
High capital intensity compounds this risk. A HEFA biorefinery processing 1 million standard cubic feet of fuel gas per day requires upfront investment with an estimated payback period of approximately 18 months at optimal operating conditions, per published cost modeling. However, that payback assumes stable feedstock prices and full utilization conditions that project developers cannot guarantee across multi-year timelines.
Extended project development timelines further limit capital deployment. Large-scale bioenergy infrastructure requires permitting, environmental review, offtake contract negotiation, and feedstock supply agreements processes that routinely extend project development to 5–7 years before first commercial output. Investors with shorter return horizons avoid the sector, limiting the capital pool available for new capacity.
Growth Factors
Sustainable Aviation Fuel and Waste Valorization Unlocking High-Value Revenue Streams
SAF is the highest-value application emerging from bioenergy’s advanced feedstock pipeline. Domestic U.S. SAF consumption reached 147 million gallons as of August 2025, per OSTI data. IATA projected total global SAF production of 2 million tonnes in 2025 representing a doubling year-on-year. That rate of growth signals a market moving from pilot volumes to commercial scale within this decade.
The DOE-supported SAF pilot facility processing corn stover is forecast to generate USD 83 million in economic impact and create 478 jobs when operational. It is also designed to achieve an 83% reduction in greenhouse gas emissions versus conventional jet fuel. Those metrics make the case that SAF production is not just environmentally beneficial it is a job-creating economic development tool that attracts public investment alongside private capital.
Bioenergy with carbon capture and storage (BECCS) and decentralized biogas systems extend the market into negative-emission energy and off-grid power. Scaling renewable propane recovery from 1 to 25 million standard cubic feet per day of fuel gas reduces project payback periods by 14 to 33 months, per cost analysis data. This economy-of-scale dynamic gives integrated bioenergy operators a clear pathway to superior returns as they grow.
Emerging Trends
Second-Generation Biofuels and Digital Supply Chain Tools Reshaping Market Structure
Second and third-generation biofuels are moving beyond demonstration plants into commercial production. Cellulosic ethanol RINs grew 93% year-on-year in 2025 under EPA data a signal that advanced fermentation and gasification pathways are achieving compliance-grade output volumes. As these technologies mature, they reduce bioenergy’s dependence on food-crop feedstocks and improve the sector’s social license.
Corporate power purchase agreements for biomass electricity are giving utilities and industrial buyers a procurement tool that combines renewable energy delivery with firm capacity commitments. This buying behavior is distinct from solar and wind PPAs biomass PPAs offer dispatchability that grid operators cannot get from intermittent sources, making them attractive additions to renewable energy portfolios.
Digital feedstock supply chain platforms are addressing one of bioenergy’s core operational vulnerabilities: feedstock traceability and sustainability certification. ESG reporting frameworks now require verified carbon intensity data for every tonne of bioenergy input. Operators who deploy digital traceability tools gain access to premium-priced, certified bioenergy markets that less-traceable competitors cannot serve.
Research Methodology Framework and Report Scope
Market Definitions and Key Coverage
This report covers the global bioenergy market, defined as energy derived from organic biological materials across four primary product forms: solid biofuels (wood pellets, wood chips, agricultural residue fuels), liquid biofuels (biodiesel, renewable diesel, ethanol, sustainable aviation fuel), biogas (including biomethane), and biopower (electricity generated from biomass combustion, gasification, or anaerobic digestion).
The market is valued in constant U.S. dollars using 2025 as the base year to eliminate currency fluctuation effects from cross-border comparisons. Segmentation covers product type, distribution channel, component, application, feedstock, process, and material type across all five major global regions.
This report excludes fossil fuel blending beyond the biofuel content, pure wind and solar power systems without biomass co-firing, synthetic fuels not derived from biological feedstocks, and software-only energy management platforms with no direct bioenergy production or distribution function. Agricultural commodity markets are referenced only as feedstock cost inputs, not as primary market scope. The historical period covered is 2020 to 2024, with forecast data spanning 2026 to 2035.
Key Companies Insights
Drax Group operates one of Europe’s largest biomass power stations in the UK, having converted multiple coal-fired generating units to compressed wood pellet fuel. This asset base gives Drax a structurally advantaged position in the UK’s Contracts for Difference scheme, which provides government-backed revenue certainty for low-carbon electricity generation. Drax’s vertical integration across pellet supply, shipping, and generation insulates its margins from spot-market feedstock price swings that affect competitors relying on third-party supply.
Enviva is the world’s largest industrial wood pellet producer, supplying utility customers across the U.S., Europe, and Asia. Its long-term take-or-pay contracts with utility buyers lock in revenue streams that provide cash flow visibility across multi-year delivery windows. This contract structure underpins its ability to finance new pellet plant capacity but it also concentrates revenue risk on a small number of large utility counterparties whose regulatory environments can shift independently of Enviva’s own operations.
POET is the largest U.S. cellulosic and conventional ethanol producer, operating a network of biorefineries across the Corn Belt. POET’s scale gives it feedstock procurement leverage and distribution cost advantages that smaller ethanol producers cannot match. Its investment in cellulosic ethanol positions it ahead of the regulatory curve as advanced biofuel mandates tighten the 93% year-on-year growth in cellulosic RINs in 2025 validates this strategic direction.
Neste Oyj is the world’s leading producer of renewable diesel and sustainable aviation fuel, operating refineries in Finland, the Netherlands, Singapore, and the U.S. Neste’s multi-feedstock flexibility processing used cooking oil, animal fats, and vegetable oils allows it to optimize input costs against a global supply base. Its SAF capacity expansion aligns directly with IATA’s projection of SAF production doubling in 2025, giving Neste first-mover commercial advantage as airline procurement volumes scale.
Key Companies
- Drax Group
- Enviva
- POET
- Green Plains Inc.
- Valero Energy Corporation (Diamond Green Diesel)
- Neste Oyj
- Renewable Energy Group (Chevron)
- Archer Daniels Midland Company (ADM)
- Bunge Global SA
- Ørsted A/S
- Eni S.p.A.
- Shell plc
- TotalEnergies SE
- Cargill, Incorporated
- BTG Bioliquids
- LanzaTech
- Abengoa
- Mitsubishi Heavy Industries
- Babcock & Wilcox
- ANDRITZ
Recent Industry Developments
- In 2025, the U.S. EPA finalized Renewable Fuel Standards setting the 2026 biomass-based diesel requirement at 8.86 billion RIN-equivalent gallons and the advanced biofuel requirement at 10.82 billion RIN-equivalent gallons, providing a binding commercial volume floor for bioenergy producers.
- In 2025, the EU’s ReFuelEU Aviation regulation took effect, requiring a minimum 2% SAF blend at all EU airports, with current certified fuel systems capable of accepting blends up to 50% without aircraft technology changes.
- In 2025, IATA projected global SAF production reached 2 million tonnes (2.5 billion liters), representing 0.7% of total airline fuel consumption and a doubling of output versus the prior year.
- In 2025, renewable jet fuel generated approximately 460.16 million RINs under the U.S. EPA compliance system, a 157% increase from the prior year, confirming rapid commercial-scale deployment of bio-based aviation fuels.
- In 2025, U.S. biodiesel facilities reached an 89% utilization rate in October, while renewable diesel facilities achieved a 77% utilization rate the highest for renewable diesel since July 2024.
Market Scope
| Report Features | Description |
|---|---|
| Market Value (2025) | USD 142.27 Billion |
| Forecast Revenue (2035) | USD 345.24 Billion |
| CAGR (2026-2035) | 9.27% |
| Base Year for Estimation | 2025 |
| Historic Period | 2020-2024 |
| Forecast Period | 2026-2035 |
| Report Coverage | Revenue Forecast, Market Dynamics, Competitive Landscape, Recent Developments |
| Segments Covered | By Product Type (Solid Biofuels, Liquid Biofuels, Biogas, Biopower), By Distribution Channel (Direct Sales B2B, Wholesale/Distributors, Retail Fuel Stations), By Component (Boilers and Turbines, Generators, Anaerobic Digesters, Gasifiers, Feedstock Processing Equipment), By Application (Power Generation, Transportation Fuels, Heating, CHP, Bioproducts), By Feedstock (Wood and Woody Biomass, Agricultural Waste, Solid Waste, Vegetable Oils, Sugarcane, Algae), By Process (Combustion, Anaerobic Digestion, Gasification, Pyrolysis, Transesterification, Fermentation, Direct Liquefaction), By Material Type (Agricultural Residues, Wood and Woody Biomass, Municipal Solid Waste, Energy Crops, Animal Manure, Industrial Waste) |
| Regional Analysis | North America (US and Canada), Europe (Germany, France, The UK, Spain, Italy, and Rest of Europe), Asia Pacific (China, Japan, South Korea, India, Australia, and Rest of APAC), Latin America (Brazil, Mexico, and Rest of Latin America), Middle East & Africa (GCC, South Africa, and Rest of MEA) |
| Competitive Landscape | Drax Group, Enviva, POET, Green Plains Inc., Valero Energy Corporation (Diamond Green Diesel), Neste Oyj, Renewable Energy Group (Chevron), Archer Daniels Midland Company (ADM), Bunge Global SA, Ørsted A/S, Eni S.p.A., Shell plc, TotalEnergies SE, Cargill Incorporated, BTG Bioliquids, LanzaTech, Abengoa, Mitsubishi Heavy Industries, Babcock & Wilcox, ANDRITZ |
| Customization Scope | Customization for segments, region/country-level will be provided. Moreover, additional customization can be done based on the requirements. |
| Purchase Options | We have three licenses to opt for: Single User License, Multi-User License (Up to 5 Users), Corporate Use License (Unlimited User and Printable PDF) |