What is the E-Fuels Market Size?
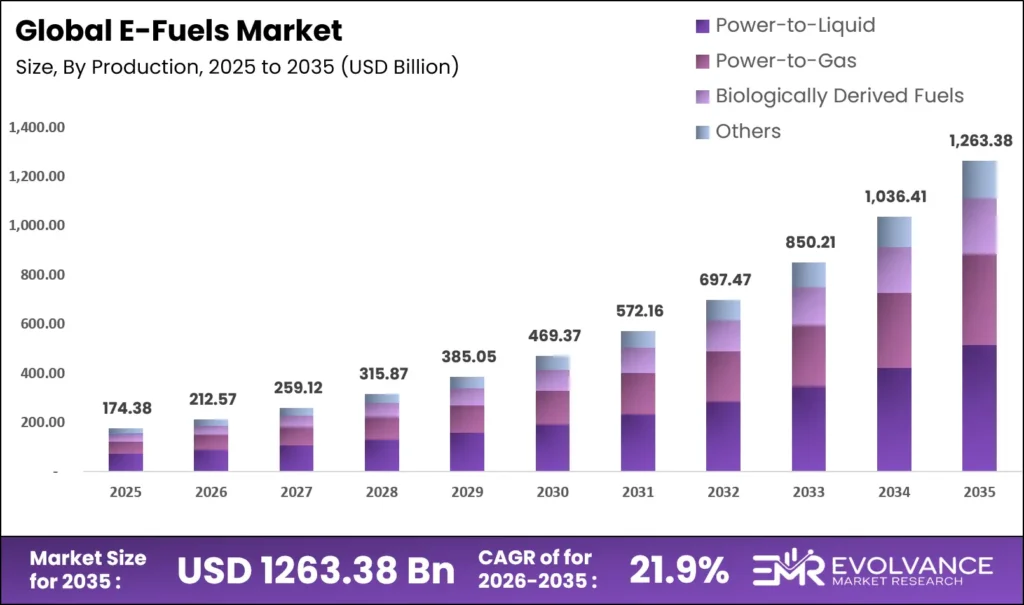
The Global E-Fuels Market size will be worth around USD 1,263.38 Billion by 2035 from USD 174.38 Billion in 2025, growing at a CAGR of 21.9% during the forecast period 2026 to 2035. Hard-to-abate sectors like aviation and shipping now treat synthetic fuels not as optional pilots but as core compliance tools. Enterprise buyers are shifting from small test volumes to long-term supply agreements that lock in future production capacity. This rapid demand signals a supply bottleneck risk for early offtakers if project financing does not accelerate at the same pace.
Market Highlights
- Thde Global E-Fuels Market size reached USD 174.38 billion in 2025 and will expand to USD 1,263.38 billion by 2035, achieving a 21.9% CAGR.
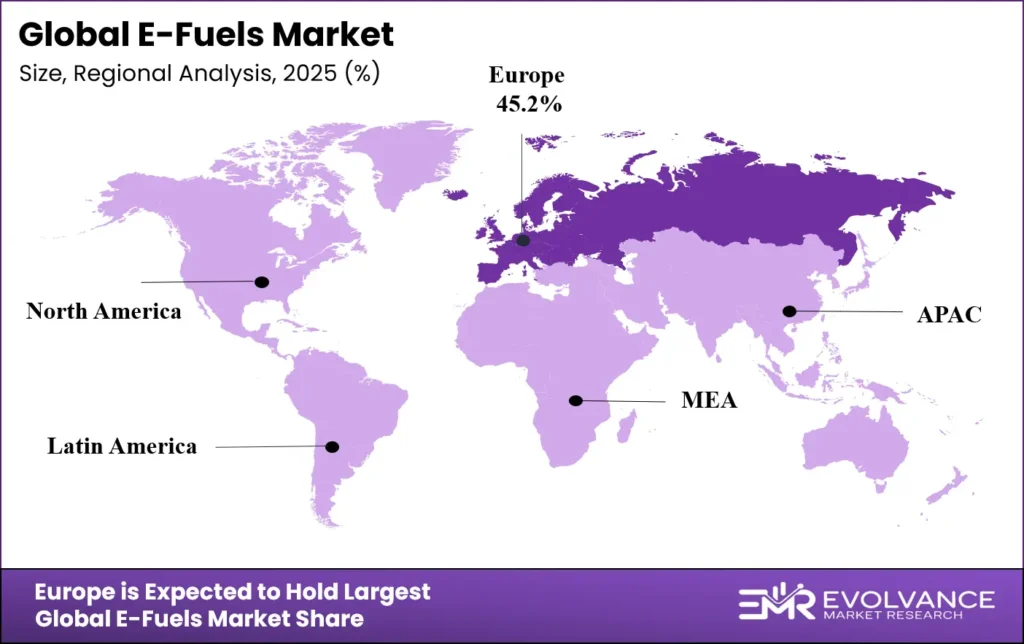
- Europe dominates the market with a 45.2% share, valued at USD 78.81 billion in 2025.
- The Point Source Carbon Capture segment leads the carbon source category with a 73.2% share.
- The Power-to-Liquid production method holds the largest share at 52.4%.
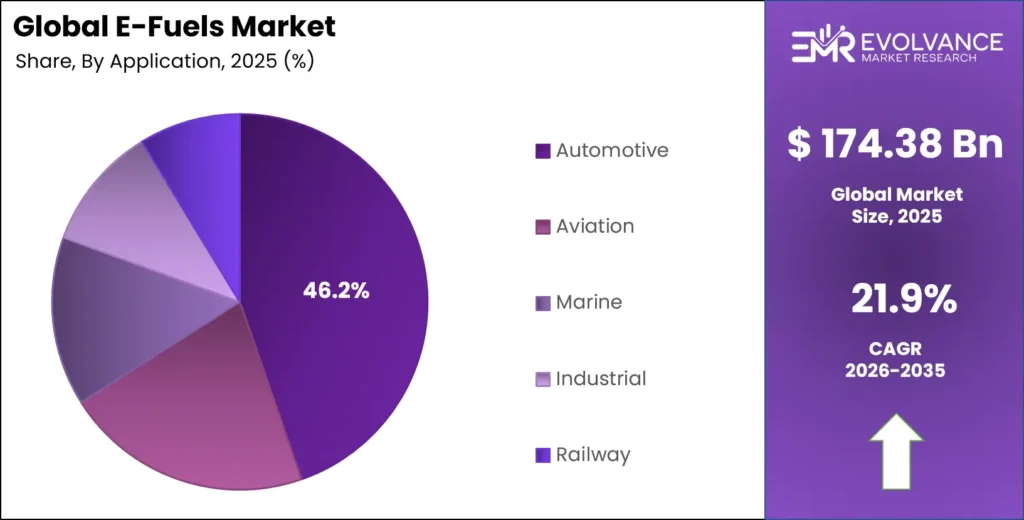
- Automotive applications account for the dominant share of 46.2%.
Market Overview
The E-Fuels market covers synthetic liquid and gaseous hydrocarbons produced using renewable electricity. These fuels include e-methanol, e-kerosene, e-diesel, and e-hydrogen. Producers combine captured carbon or nitrogen with green hydrogen to create drop-in energy carriers. End users in aviation, marine, and heavy transport value these products because they work in existing engines and fuel infrastructure.
Regulatory mandates now shape procurement strategies more than voluntary climate pledges. The European Union’s ReFuelEU Aviation and FuelEU Maritime rules compel fuel suppliers to blend rising shares of synthetic fuel through 2050. This legal requirement turns e-fuels from a premium niche into a must-have compliance input for airlines and shipping lines operating in European markets.
The Kassø facility in Denmark uses 52.5 MW of hydrogen electrolyser capacity for green hydrogen production. This single plant shows how renewable power hubs anchor commercial e-fuel output. Moreover, HIF Global’s Haru Oni facility received RFNBO certification in 2025, confirming that its e-fuels meet strict EU renewable energy criteria and validating the market’s regulatory readiness.
Project cancellations also reveal market pressures. In August 2024, Ørsted scrapped its planned e-methanol plant in Sweden. The company blamed weak long-term contracts and rising project costs. This event underscores that production economics remain fragile without guaranteed offtake agreements, even in supportive policy environments.
Data from Sasol indicates that next-generation catalysts will boost e-kerosene yield by 15%. This technical gain lowers the per-unit cost structure. For investors, catalyst advances directly improve plant margins and reduce the volume of renewable power needed per litre of fuel produced, making projects more bankable.
Carbon Source Insights
Point Source Carbon Capture dominates with 73.2% due to higher CO2 concentration and lower capture cost.
In 2025, Point Source Carbon Capture held a dominant position in the By Carbon Source segment, with a 73.2% share. This method captures CO2 directly from industrial flue gases at cement or ethanol plants. The concentrated CO2 stream reduces energy needed for separation compared to pulling it from ambient air. This efficiency gives project developers a lower-cost feedstock pathway.
Direct Air Capture serves projects where access to industrial CO2 sources is limited or fossil-free branding is critical. The technology pulls CO2 from ambient air, offering a fully circular carbon loop. However, energy requirements remain high, keeping costs elevated. Developers use DAC when proximity to renewable power is stronger than proximity to industrial emitters.
Fuel Type Insights
Ethanol dominates with 27.3% due to existing blending mandates and established engine compatibility.
In 2025, Ethanol led the By Fuel Type segment with a 27.3% share. Blending mandates in major auto markets already accept ethanol-gasoline mixes without engine changes. This existing infrastructure advantage shortens the path to market for e-ethanol compared to newer synthetic molecules. Producers leverage ethanol’s mature logistics network to achieve faster revenue generation.
E-Methanol gains traction as a marine fuel choice. Shipping lines order methanol-ready vessels to comply with carbon intensity rules. The Kassø facility produced first raw e-methanol in March 2025, achieving over 99.85% purity. This output proves that large-scale e-methanol production meets IMPCA specs required by the marine sector.
E-Kerosene serves the aviation sector where battery-electric propulsion remains decades away. Airlines sign long-term offtake agreements for synthetic aviation fuel to lock in future supply. Sasol’s catalyst improvement targeting 15% better e-kerosene yield will reduce the cost premium that currently limits airline adoption beyond pilot programs.
Production Method Insights
Power-to-Liquid dominates with 52.4% due to direct production of drop-in liquid fuels.
In 2025, Power-to-Liquid held a dominant position in the By Production Method segment, with a 52.4% share. This route uses electrolysis and Fischer-Tropsch synthesis to produce liquid hydrocarbons directly. The output requires minimal downstream refining, cutting operational steps. Aviation and auto sectors prefer this method because it yields fuels that directly replace kerosene and gasoline.
Power-to-Gas converts renewable electricity into gaseous fuels like e-hydrogen and e-methane. These products feed industrial heating systems and power plants. The process integrates with existing gas grids, offering storage and distribution advantages. German and Danish industrial clusters adopt this method to decarbonize process heat without full plant redesigns.
Application Insights
Automotive dominates with 46.2% due to legacy combustion engine fleet and ethanol blending policies.
In 2025, Automotive led the By Application segment with a 46.2% share. The vast existing fleet of combustion engine vehicles consumes e-gasoline and e-ethanol blends immediately. National blending mandates in Europe and the Americas create a guaranteed demand floor. Porsche’s deployment of e-gasoline from Haru Oni in May 2025 demonstrates how premium auto brands use synthetic fuels to extend combustion engine viability.
Aviation represents the highest-value growth segment. Airlines face the hardest decarbonization path and can afford premium pricing for certified e-kerosene. ETFuels develops six global projects targeting over 200,000 tonnes of e-Sustainable Aviation Fuel (SAF) yearly. This supply pipeline aims to meet airline offtake contract terms and regulatory blend mandates starting in the late 2020s.
Marine shipping operators adopt e-methanol and e-ammonia to satisfy IMO carbon intensity rules. Newbuild vessels increasingly specify methanol-capable engines. The Kassø facility’s output of 42,000 tonnes per year of e-methanol supplies this emerging marine demand pool directly from Denmark’s renewable grid.
Market Segments Covered in the Report
By Carbon Source
- Point Source Carbon Capture
- Industrial Flue Gas
- Biogenic CO2 Sources
- Direct Air Capture
By Fuel Type
- Ethanol
- E-Diesel
- E-Gasoline
- E-Kerosene
- E-Methanol
- E-Methane
- E-Ammonia
- E-Hydrogen
By Production Method
- Power-to-Liquid
- Power-to-Gas
- Biologically Derived Fuels
- Other
By Application
- Automotive
- Aviation
- Marine
- Industrial
- Railway
Regional Insights
Europe Dominates the E-Fuels Market with a Market Share of 45.2%, Valued at USD 78.81 Billion
Europe holds 45.2% of global market value at USD 78.81 billion. The ReFuelEU Aviation and FuelEU Maritime mandates create non-negotiable demand that no other region matches. Fuel suppliers must blend rising synthetic fuel volumes starting in 2025. This legal floor removes demand uncertainty, accelerating final investment decisions on European production plants.
Asia Pacific Market Trends
Asia Pacific builds industrial clusters linking hydrogen producers with carbon capture assets. Japan and South Korea invest in national hydrogen strategies that subsidize power-to-liquid projects. Australia channels stranded solar resources into export-oriented e-fuel mega-projects. These efforts aim to capture maritime bunkering demand along busy Asian shipping lanes.
Latin America Market Trends
Chile and Uruguay emerge as e-fuel export hubs using abundant wind and solar resources. HIF Global’s Haru Oni facility in Punta Arenas supplies e-gasoline to European automakers. The Paysandú project in Uruguay expects 1,400 construction jobs and 300 permanent roles. Latin America’s cost advantage lies in high-capacity renewable power at low generation cost.
Key Regions and Countries
North America
- US
- Canada
Europe
- Germany
- France
- The UK
- Spain
- Italy
- Rest of Europe
Asia Pacific
- China
- Japan
- South Korea
- India
- Australia
- Rest of APAC
Latin America
- Brazil
- Mexico
- Rest of Latin America
Middle East & Africa
- GCC
- South Africa
- Rest of MEA
Regulatory Landscape
The EU’s ReFuelEU Aviation mandate, effective from 2025, compels fuel suppliers to blend a minimum share of sustainable aviation fuel, rising to 70% by 2050. A specific sub-target mandates synthetic aviation fuel blending from 2030. This rule transforms e-kerosene from an experimental product into a legally required fuel component for all flights departing EU airports.
The FuelEU Maritime regulation sets greenhouse gas intensity reduction targets for ship energy use starting in 2025. The targets tighten every five years through 2050. Shipping companies that fail to comply face financial penalties. This creates immediate demand for e-methanol and e-ammonia from vessel operators seeking to avoid non-compliance fines.
In 2025, HIF Global received ISCC EU RFNBO certification for e-fuels produced at its Haru Oni plant. This certification verifies that the fuels meet EU Renewable Energy Directive criteria, including 70% greenhouse gas reduction versus fossil fuels. Certification unlocks access to European compliance markets and premium pricing tiers for certified synthetic fuel producers globally.
Drivers
EU Mandates Create Guaranteed Long-Term Demand for Synthetic Fuels
ReFuelEU Aviation and FuelEU Maritime regulations legally require fuel suppliers to blend synthetic fuels. These mandates set escalating targets through 2050, removing the demand uncertainty that has historically stalled project financing. Suppliers who fail to blend face penalties, turning e-fuel procurement into a compliance cost rather than an optional sustainability expense.
The mandates directly benefit project developers. A guaranteed buyer pool makes it easier to secure debt financing for capital-intensive power-to-liquid plants. Moreover, airlines and shipping companies now sign long-term offtake contracts because the regulatory requirement is certain. This contract visibility was missing when Ørsted canceled its Swedish project in August 2024.
Electrolyzer cost declines further improve project economics. Data from European Energy shows the Kassø facility uses 52.5 MW of electrolysis capacity feeding commercial methanol synthesis. As electrolyzer prices drop, the levelized cost of e-fuel falls, narrowing the premium gap against fossil fuels and expanding the addressable compliance market beyond early-adopter segments.
Restraints
High Renewable Electricity Intensity Creates Structural Cost Gap Versus Fossil Fuels
E-fuel synthesis requires massive renewable power input. This structural fact means production cost will always exceed conventional fuel cost in the absence of carbon pricing or mandates. Even with declining electrolyzer costs, the renewable electricity feedstock represents a permanent cost floor that fossil fuel extraction does not face.
Limited carbon capture infrastructure constrains feedstock access. Point-source capture projects need nearby industrial CO2 emitters, and pipeline networks remain underdeveloped. Without reliable CO2 supply at scale, plant utilization rates fall, raising per-unit costs. Developers in regions without existing capture clusters must invest in both capture and synthesis infrastructure simultaneously.
The Ørsted project cancellation in Sweden illustrates these combined pressures. Higher project costs and inability to secure long-term offtake agreements made the business case unworkable despite strong regional policy support. This signals that even favorable regulatory environments cannot offset fundamental feedstock cost disadvantages without guaranteed revenue contracts.
Growth Factors
Synthetic Aviation Fuel Supply Agreements Open Global Airline Compliance Pathways
Airlines seek long-term emissions compliance through synthetic fuel offtake deals. These agreements provide project developers with bankable revenue streams. ETFuels develops six global projects targeting over 200,000 tonnes per year of e-SAF. Each offtake contract signed with a major carrier de-risks subsequent project phases and attracts infrastructure investors.
Remote renewable energy hubs convert stranded wind and solar into exportable liquid fuels. Chile, Uruguay, and Australia host mega-projects that monetize excess renewable capacity. The Paysandú project in Uruguay will create 1,400 construction jobs, showing how these facilities generate local economic value while producing fuel for distant demand centers.
Industrial cluster integration links refineries, hydrogen plants, and carbon capture within shared ecosystems. This reduces logistics costs and enables shared infrastructure investment. The Kassø facility in Denmark co-locates with a 304 MW solar park, demonstrating how integrated design eliminates grid fees and transmission losses that would otherwise erode already-thin production margins.
Emerging Trends
Cross-Border Offtake Partnerships Accelerate Project Bankability for Developers
E-fuel developers and transport end users sign cross-border supply deals that de-risk project financing. In September 2024, Brookfield committed USD 1.1 billion to Infinium for global e-fuel projects, including Roadrunner in Texas. Capital commitments at this scale signal that institutional investors now view synthetic fuels as an infrastructure asset class rather than venture-stage technology bets.
Power-to-X mega-projects concentrate in high-renewable regions across the Middle East, South America, and Australia. These regions offer solar and wind capacity factors that materially lower the renewable power cost input. Norsk e-Fuel secured land in Finland’s Port of Rauma in October 2024 for a facility producing up to 100 million litres annually, targeting European marine customers.
Carbon accounting frameworks now standardize lifecycle emissions verification. HIF Global’s 2025 RFNBO certification proves that e-fuels can achieve over 70% greenhouse gas reduction versus fossil fuels. Standardized certification gives buyers confidence that premium-priced synthetic fuel purchases deliver verified Scope 1 emission reductions for their own regulatory reporting obligations.
Research Methodology Framework and Report Scope
Market Definitions and Key Coverage
This report studies the global E-Fuels market, covering synthetic liquid and gaseous fuels produced from renewable electricity. Included products are e-diesel, e-gasoline, e-kerosene, e-methanol, e-ethanol, e-methane, e-ammonia, and e-hydrogen across all carbon source types and production methods. The valuation uses constant USD with 2025 as the base year to neutralize currency fluctuation effects and enable cross-regional comparison.
The study excludes conventional biofuels produced from food crops, fossil-derived hydrogen without carbon capture, and battery-electric vehicle technologies. Software-only solutions for carbon accounting and fuel logistics platforms fall outside the scope. The analysis covers revenue from fuel sales, technology licensing, and production equipment, but excludes carbon credit trading as a separate revenue category.
Key Companies Insights
Shell positions itself as an integrated offtaker, distributor, and investor in e-fuel production. The company’s participation in the Haru Oni e-gasoline deployment with HIF Global and Porsche in May 2025 shows a strategy that spans production, certification, and end-user delivery. This vertical reach allows Shell to capture margin across the value chain while building supply assurance for European compliance markets.
HIF Global operates as a pure-play e-fuel producer with first-mover advantage in certified synthetic fuel output. The Haru Oni facility’s 2025 ISCC RFNBO certification sets a compliance standard competitors must match. HIF Global’s Uruguay project and global pipeline target export markets where regulatory mandates create premium pricing. The strategy relies on securing long-term offtake agreements before committing final construction capital.
Siemens Energy supplies electrolysis and power management systems critical to e-fuel production efficiency. The company benefits regardless of which project developer leads because every power-to-liquid plant requires electrolysers. Its technology underpins the green hydrogen input that determines overall plant economics, making Siemens Energy a picks-and-shovels exposure to e-fuel capacity expansion.
Key Companies
- Shell
- ExxonMobil
- TotalEnergies
- Neste
- Siemens Energy
- Yara Clean Ammonia
- Porsche
- HIF Global
- Sunfire
- Carbon Recycling International
- Liquid Wind
- Arcadia eFuels
- Infinium
- Repsol
- Uniper
- ENGIE
- Hapag-Lloyd
Recent Industry Developments
- In May 2025, HIF Global, Porsche AG and Shell announced commercial deployment of e-Gasoline produced at the Haru Oni e-Fuels facility in Punta Arenas, Chile, for testing and demonstration activities in Europe.
- In September 2024, Brookfield Asset Management committed up to US$ 1.1 billion to Infinium to accelerate global e-Fuels projects, including more than US$ 200 million for the Roadrunner e-Fuels project in West Texas and up to US$ 850 million for additional projects globally.
- In October 2024, Norsk e-Fuel secured exclusive access to 14 hectares in the Port of Rauma, Finland, for a planned e-Fuel facility capable of producing up to 100 million litres annually.
- In August 2024, Ørsted cancelled its planned e-Methanol project in Örnsköldsvik, Sweden, citing deteriorating economics, inability to secure long-term offtake contracts, and higher project costs.
Market Scope
| Report Features | Description |
|---|---|
| Market Value (2025) | USD 174.38 Billion |
| Forecast Revenue (2035) | USD 1,263.38 Billion |
| CAGR (2026-2035) | 21.9% |
| Base Year for Estimation | 2025 |
| Historic Period | 2020-2024 |
| Forecast Period | 2026-2035 |
| Report Coverage | Revenue Forecast, Market Dynamics, Competitive Landscape, Recent Developments |
| Segments Covered | By Carbon Source (Point Source Carbon Capture, Direct Air Capture), By Fuel Type (Ethanol, E-Diesel, E-Gasoline, E-Kerosene, E-Methanol, E-Methane, E-Ammonia, E-Hydrogen), By Production Method (Power-to-Liquid, Power-to-Gas, Biologically Derived Fuels, Other), By Application (Automotive, Aviation, Marine, Industrial, Railway) |
| Regional Analysis | North America (US and Canada), Europe (Germany, France, The UK, Spain, Italy, and Rest of Europe), Asia Pacific (China, Japan, South Korea, India, Australia, and Rest of APAC), Latin America (Brazil, Mexico, and Rest of Latin America), Middle East & Africa (GCC, South Africa, and Rest of MEA) |
| Competitive Landscape | Shell, ExxonMobil, TotalEnergies, Neste, Siemens Energy, Yara Clean Ammonia, Neste, Porsche, HIF Global, Sunfire, Carbon Recycling International, Liquid Wind, Arcadia eFuels, Infinium, Repsol, Uniper, ENGIE, Hapag-Lloyd |
| Customization Scope | Customization for segments, region/country-level will be provided. Moreover, additional customization can be done based on the requirements. |
| Purchase Options | We have three licenses to opt for: Single User License, Multi-User License (Up to 5 Users), Corporate Use License (Unlimited User and Printable PDF) |