Market Verdict
The Global Hydrogen Electrolyzer Market is not a growth story yet. It is a manufacturing overcapacity story masquerading as one, and investors who do not distinguish between installed capacity, manufacturing output, and final investment decisions will misread every headline number.
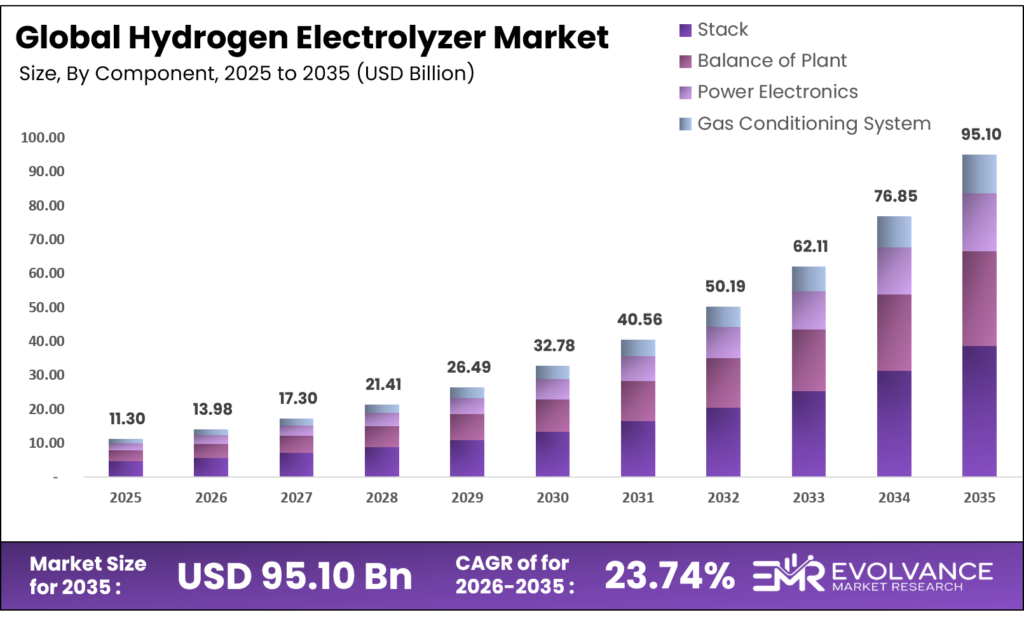
As per our research, the global hydrogen electrolyzer market was valued at USD 11.30 billion in 2025, and is projected to reach USD 95.10 billion by 2035, growing at a CAGR of 23.74%. The real tension: China controls roughly 60% of global electrolyzer manufacturing capacity and produces hardware at USD 600 to 1,200 per kW, while Western OEMs supply the same output at USD 2,000 to 2,600 per kW. That cost gap is not closing fast enough to rescue any project economics built on non-Chinese stack pricing.
Key Takeaways
Market Size
- Market value in 2025: USD 11.30 billion as of 2025 (as per our research)
- Market value in 2035: USD 95.10 billion (as per our research)
- CAGR: 23.74% over 2025 to 2035 (as per our research)
Dominant Segments
- Technology: PEM electrolyzer at 48.2% share as of 2025
- Component: Stack at 48.7% share as of 2025
- Power Rating: 500 kW to 2 MW systems at 42.6% share as of 2025
- Application: Energy at 35.7% share as of 2025
Dominant Region
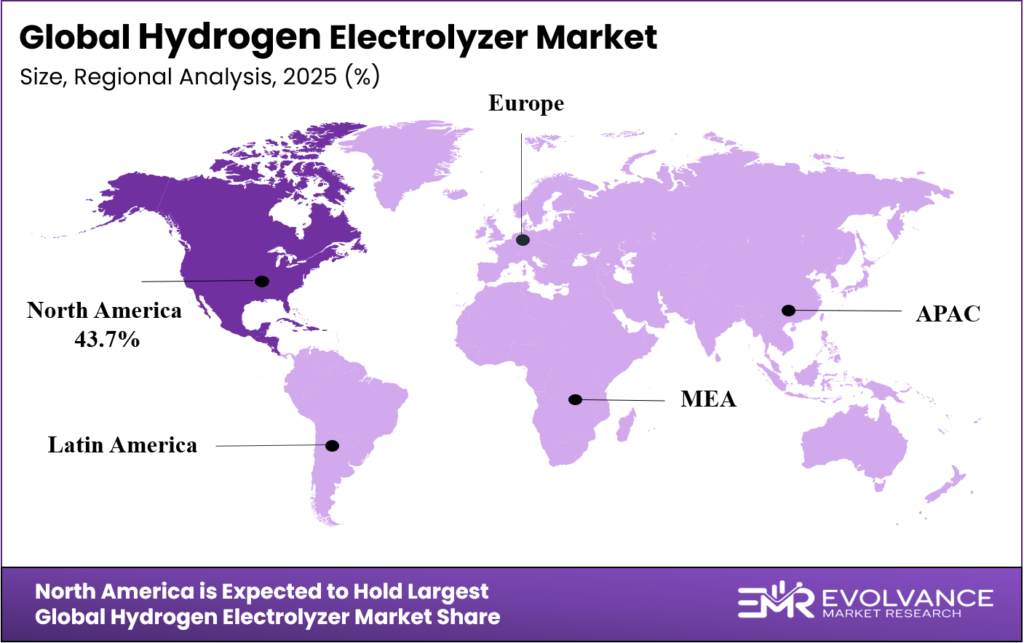
- Leading region: North America at 43.7%, valued at USD 4.93 billion as of 2025 (as per our research)
Market Overview
Hydrogen electrolyzers use electricity to split water molecules into hydrogen and oxygen through electrolysis, producing low-emission hydrogen when powered by renewable or nuclear energy. Ammonia producers, petroleum refiners, steel mills, methanol synthesizers, and grid-scale energy storage developers all depend on electrolysis capacity to displace grey hydrogen, which today still derives almost entirely from unabated steam methane reforming. Without electrolyzer scale, none of these industries can meet the decarbonization schedules now embedded in their regulatory and financing frameworks.
Our research team at EMR built this analysis using a hybrid bottom-up and top-down methodology covering primary interviews with electrolyzer OEMs, project developers, EPC contractors, and industrial gas buyers across North America, Europe, and Asia Pacific. Data collection ran from 2020 through Q1 2025. The geographic scope covers six regions and more than 20 countries. Validation involved cross-checking equipment order flows, capacity reaching final investment decision (FID), and manufacturing output data against International Energy Agency published tracking and European Hydrogen Bank auction records. Where manufacturing capacity figures and actual output figures diverge materially, we have flagged the gap explicitly.
The industrial buyer who triggers an electrolyzer purchase is almost always solving a compliance or offtake problem, not a technology ambition. A refiner facing a tightened sulfur standard needs high-purity hydrogen cost-certainty. An ammonia producer with a green offtake agreement needs bankable production cost proof. A power-to-gas developer needs grid balancing revenue to cover capital cost.
In all three cases, the purchase decision does not happen without a committed revenue stream anchoring the project. That is why announced capacity continues to dwarf FID-approved capacity: without an offtake contract, there is no project. The data supports this reading. According to the IEA Global Hydrogen Review 2024, announced global electrolyzer project capacity approached 520 GW by 2030, while only about 4% had reached FID or entered construction at the time of reporting.
The quantitative backdrop reinforces that reading. Global installed electrolyzer capacity reached 1.4 GW by end-2023 and was projected to approach 5 GW by end-2024, per IEA data. Global investment in electrolyzer installations reached approximately USD 2.9 billion in 2024, per IEA progress dashboard data. Against a manufacturing capacity base that exceeded 25 GW per year in 2023 and was expected to surpass 40 GW per year in 2024, actual manufacturing output of only 2.5 GW in 2023 reveals a utilization rate below 10%. The market story is not one of supply shortage. It is one of demand qualification.
What Is Actually Driving This Market
The first structural driver is the European Hydrogen Bank’s auction mechanism, which converts policy ambition into hard revenue certainty for project developers. The IEA confirmed that the EU recorded more than 2 GW of electrolyzer projects reaching FID between September 2023 and August 2024, which is a direct consequence of the European Hydrogen Bank’s first auction awarding EUR 721 million to seven renewable hydrogen projects, followed by a second auction offering up to EUR 1.2 billion in support for renewable hydrogen production across the European Economic Area.
The causal mechanism runs through contract-for-difference structures that guarantee a hydrogen production price floor, which is the missing ingredient that transforms a financially unviable green hydrogen project into a bankable one. Without this price guarantee, the cost gap against fossil-based hydrogen, which the IEA estimates at 1.5 to 6 times higher for renewable hydrogen, kills project debt financing before it starts. For investors, the European Hydrogen Bank’s auction pipeline is the most reliable near-term signal of where electrolyzer order flow will materialize in Europe through 2027.
The second driver is the doubling of FID-approved low-emission hydrogen production capacity, which reached 3.4 million tonnes per annum (Mtpa) as of the IEA Global Hydrogen Review 2024 period, signaling that project bankability is improving at both ends of the Atlantic. Around 6.5 GW of electrolyzer capacity reached FID in the twelve months prior to that review, with China accounting for more than 40% and Europe contributing 32% of that FID volume, per IEA data. The causal mechanism here runs through industrial offtake agreements: steel producers, fertilizer manufacturers, and synthetic fuel developers signing long-term hydrogen supply contracts that give lenders the revenue certainty needed to approve project debt.
The IEA’s data on ammonia and steel sector FIDs shows the strongest pipeline, with China’s industrial hydrogen parks and European industrial clusters generating the most actionable project demand. For operators, the implication is that sales cycles are now fundamentally driven by offtake contract timelines, not technology readiness, and any electrolyzer supplier without a dedicated project origination team embedded with industrial developers will miss the order wave when it hits.
The third driver is the rapid buildout of electrolyzer manufacturing capacity, which reached 25 GW per year in 2023 and was forecast to exceed 40 GW per year in 2024, per IEA data. This matters because equipment availability was a genuine constraint on project execution as recently as 2021. That constraint has been removed. Lead times are compressing. Module standardization is improving. The causal mechanism linking manufacturing scale to market growth runs through equipment cost reduction: higher volumes drive unit cost down through learning curve effects on stack fabrication, membrane production, and power electronics integration.
India’s National Green Hydrogen Mission reinforced this dynamic in early 2026, when the Press Information Bureau confirmed that fifteen companies received 3,000 MW per annum of electrolyzer manufacturing capacity allocations, establishing a domestic supply base that will reduce import dependency for South Asian project developers. For investors, India’s manufacturing award program is a signal that a third major electrolyzer production geography is forming, which will create competitive pressure on both Chinese and European OEM pricing over the 2026 to 2030 window.
Three structural drivers with evidence and datestamps:
- European Hydrogen Bank auctions: EUR 721 million awarded in round one, EUR 1.2 billion offered in round two (2024), directly enabling FID for EU projects
- Global FID-approved low-emission H2 capacity: 3.4 Mtpa reached FID as of IEA Global Hydrogen Review 2024 period, with 6.5 GW electrolyzer capacity FID in the same 12 months
- Manufacturing capacity: Doubled to 25 GW per year in 2023, forecast above 40 GW per year in 2024 (IEA), with India adding 3,000 MW per annum via National Green Hydrogen Mission awards (February 2026)
Each driver requires a distinct investor response: European auctions favor near-term order exposure, FID volume favors project-integrated suppliers, and manufacturing scale favors cost-competitive stack producers.
Where the Real Risk Is
The primary restraint is not technical. It is economic, and it is structural rather than cyclical. Renewable hydrogen produced via electrolyzers costs 1.5 to 6 times more than unabated fossil-based hydrogen across most markets, per IEA data as of the Global Hydrogen Review 2024. That range is wide because it depends on local electricity prices, which vary by a factor of four or more across geographies. The cost gap narrows in locations with stranded renewables or zero-cost grid-connected power, but those locations are limited in number. This restraint correlates strongly with project cancellation rates: most announced capacity never reaches construction because project economics fail once realistic power purchase agreement costs are included in the pro forma.
The relationship between power costs and project viability is causal, not merely correlated. Every USD 10 per MWh increase in electricity cost adds approximately USD 0.5 to USD 0.7 per kg to green hydrogen production cost, based on system efficiency data. For investors, this means projects without co-located renewable power assets or grid curtailment access carry materially higher execution risk than project documentation typically discloses.
The secondary risk is geopolitical and competitive simultaneously. China held approximately 60% of global electrolyzer manufacturing capacity and is expected to account for roughly 70% of 2024 installed capacity, per IEA tracking data. Chinese-manufactured alkaline electrolyzers reaching project sites outside China at USD 600 to 1,200 per kW versus Western equivalents at USD 2,000 to 2,600 per kW creates a competitive displacement risk for European and North American OEMs that is not adequately priced into most analyst coverage of companies like Nel ASA, ITM Power, or Siemens Energy.
Whether this gap narrows depends on assumptions about US and EU tariff policy, local content requirements under programs like the US Inflation Reduction Act’s clean hydrogen production tax credit (45V), and Chinese export behavior. The data is insufficient to make a firm call on the magnitude of tariff-driven cost equalization through 2027. What is clear is that non-Chinese OEMs competing on price alone are not viable. For investors, the only defensible positions in Western electrolyzer manufacturing are those built on service contract revenues, regulatory compliance advantages, or technology differentiation in segments where Chinese manufacturers have not yet established quality references, specifically high-pressure PEM and solid oxide electrolyzer (SOEC) systems.
Technology Insights
Proton exchange membrane (PEM) electrolyzers held 48.2% technology revenue share as of 2025, according to our research analysts, primarily because PEM systems are the only technology capable of rapid dynamic response to variable renewable power inputs, which is a non-negotiable requirement for co-located wind and solar projects. PEM systems also produce higher-purity hydrogen output, operate at elevated pressures without downstream compression, and have compact footprints suited to modular deployment.
The constraint is cost: PEM stacks require iridium-based catalysts and fluoropolymer membranes that are both expensive and supply-constrained. Alkaline electrolyzer systems retain a cost advantage in baseload industrial applications where dynamic response is unnecessary, accounting for the strong alkaline position in ammonia and refinery projects. Anion exchange membrane (AEM) electrolyzers remain at early commercial stage as of 2025, though the technology is attracting research investment precisely because it offers PEM-like performance without precious metal catalysts.
SOEC systems require high-temperature heat inputs that most projects cannot provide economically, limiting near-term deployment to industrial sites with waste heat streams. For investors, PEM commands the premium segment and the growth-rate premium, but the iridium supply chain represents a concentration risk that will compound as scale increases through 2030.
| Sub-segment | Share % | Primary Driver | Outlook |
|---|---|---|---|
| PEM Electrolyzer | 48.2% | Renewable integration, high-purity output | Strongest growth; iridium supply risk by 2028 |
| Alkaline Electrolyzer | Approx. 35% | Lower cost, ammonia and refinery baseload | Durable in industrial segment; Chinese cost pressure intensifying |
| Solid Oxide Electrolyzer (SOEC) | Low single digits | High efficiency with waste heat; niche industrial | Limited scale before 2028; longer proof cycles required |
| Anion Exchange Membrane (AEM) | Nascent | Non-precious metal catalysts, R&D investment | Commercial potential post-2027; watch catalyst durability data |
Component Insights
The electrolyzer stack accounted for 48.7% of component revenue as of 2025, per our research. This concentration reflects the stack’s role as the core value-added element of an electrolyzer system: all performance differentiation, all intellectual property protection, and most margin sits in stack design and manufacturing.
Balance of plant (BOP), power electronics, and gas conditioning systems collectively make up the remainder, and while these components represent real engineering complexity, they are more commoditized and increasingly sourced from established industrial equipment suppliers. For operators competing on total system cost, BOP standardization and procurement scale offer the clearest near-term cost reduction path, since stack cost reduction requires materials science advances that take longer to compound.
| Sub-segment | Share % | Primary Driver | Outlook |
|---|---|---|---|
| Stack | 48.7% | Core IP, performance differentiation | Sustained leadership; materials cost reduction underway |
| Balance of Plant | Approx. 25% | System integration complexity | Commoditization accelerating; procurement consolidation opportunity |
| Power Electronics | Approx. 15% | Grid interface requirements | Growing with grid-connected project scale |
| Gas Conditioning System | Approx. 11% | Purity requirements by end-use | Stable; specification-driven |
Power Rating Insights
The 500 kW to 2 MW power rating segment held 42.6% share as of 2025, according to our research analysts. This segment sits at the intersection of modular scalability and industrial utility: large enough to serve real production volumes, small enough to stack in arrays for gigawatt-scale deployment without single-point-of-failure risk. The above 2 MW segment is the fastest growing by unit capacity because it serves the large industrial hydrogen hubs that drive total GW deployment numbers, while the sub-500 kW segment retains demand from fueling stations, pilot projects, and distributed generation applications.
Thyssenkrupp nucera’s NEOM project delivery using standardized 20 MW modules demonstrates that above-2 MW systems are moving from prototype to repeatable industrial deployment. For operators, modular system architectures that can be factory-assembled and site-configured will increasingly win large project contracts over custom-engineered single-unit installations, because EPC contractors prioritize schedule certainty over bespoke optimization.
| Sub-segment | Share % | Primary Driver | Outlook |
|---|---|---|---|
| 500 kW to 2 MW | 42.6% | Modular scalability, industrial utility balance | Dominant through 2030; strongest project pipeline |
| Above 2 MW | Growing rapidly | Industrial hub scale, GW deployment economics | Fastest capacity growth; modular 20 MW standard emerging |
| Less than 500 kW | Approx. 20% | Fueling stations, pilots, distributed generation | Stable; growth in mobility corridor buildout |
Application Insights
Energy applications led at 35.7% share as of 2025, per our research, driven by power-to-gas deployment and renewable energy storage. However, the application segment where order book quality is highest is industrial: ammonia production, refining, and methanol synthesis collectively represent the applications with the most committed offtake and the clearest cost-per-kg benchmarks. Approximately 40% of planned low-emission hydrogen projects using electrolyzers are located in water-stressed regions, per IEA data, which adds a non-trivial operating cost and permitting complexity for those projects.
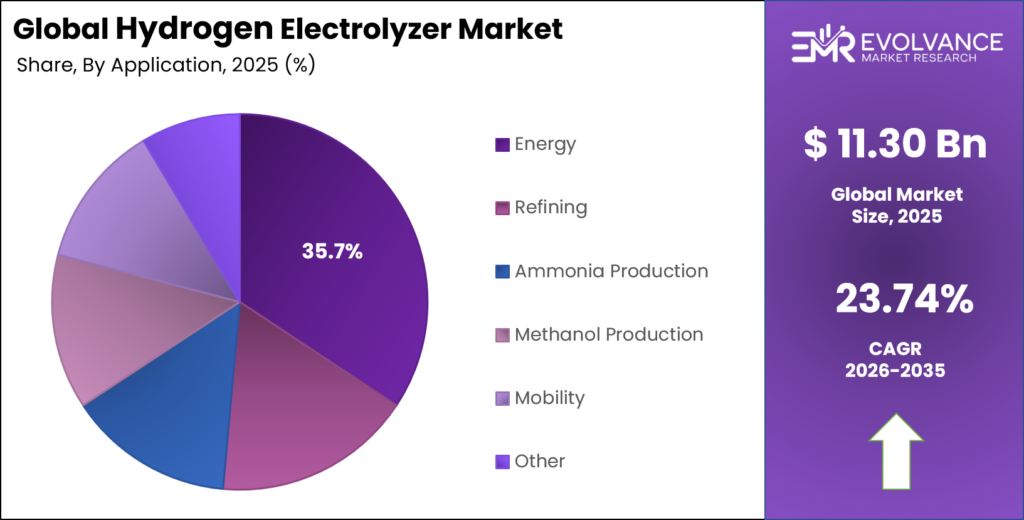
Large-scale use of treated wastewater and desalination technologies is emerging as a necessary infrastructure investment for electrolyzer deployment in these regions. For investors, the ammonia application segment has the most immediate and quantifiable demand, because fertilizer producers have existing hydrogen consumption that needs decarbonization, which means zero demand-creation risk compared with mobility or power-to-gas applications.
| Sub-segment | Share % | Primary Driver | Outlook |
|---|---|---|---|
| Energy (Power-to-Gas, Grid) | 35.7% | Renewable integration, storage | Large but dependent on grid revenue certainty |
| Ammonia Production | High growth | Fertilizer decarbonization, offtake clarity | Clearest near-term demand; FID pipeline strongest |
| Refining | Significant | Sulfur regulation, clean hydrogen mandates | Steady growth tied to refinery upgrade cycles |
| Methanol Production | Growing | Synthetic fuel demand, IMO shipping regulations | Accelerating post-2026 as shipping fuel specs tighten |
| Mobility | Early stage | FCEV fleet expansion, refueling network | High long-term potential; near-term infrastructure-dependent |
Segments Covered in This Report
Technology Insights
- PEM Electrolyzer
- Alkaline Electrolyzer
- Solid Oxide Electrolyzer (SOEC)
- Anion Exchange Membrane Electrolyzer (AEM)
Component Insights
- Stack
- Balance of Plant
- Power Electronics
- Gas Conditioning System
Power Rating Insights
- Less than 500 kW
- 500 kW to 2 MW
- Above 2 MW
Application Insights
- Energy
- Refining
- Ammonia Production
- Methanol Production
- Mobility
- Power Generation
- Industrial Gases
Value is concentrating in the intersection of PEM technology, the 500 kW to 2 MW power rating, and ammonia or refinery applications. Projects in this intersection have the highest probability of FID because all three dimensions support bankable project economics: PEM handles variable renewables, mid-range systems enable modular scale-up without single-unit risk, and industrial offtake provides revenue certainty. Fragmentation is occurring at the edges: sub-500 kW systems are disaggregating toward specialized fueling and distributed-generation vendors, while SOEC and AEM technologies are fragmenting into distinct research-commercialization tracks with different timeline profiles.
Regional Analysis: Where Geography Creates Advantage
North America led the hydrogen electrolyzer market at 43.7% share, valued at USD 4.93 billion as of 2025, according to our research analysts. The structural reason is the US Inflation Reduction Act’s Section 45V clean hydrogen production tax credit, which provides up to USD 3 per kg of qualifying clean hydrogen production, creating the most generous green hydrogen subsidy framework in the world as of 2024.
The US Department of Energy additionally announced USD 750 million for 52 clean hydrogen projects across 24 states in March 2024, spanning electrolyzer installations, manufacturing, and recycling. The causal mechanism linking federal support to electrolyzer demand runs through bankability: the 45V credit is sufficient in many cost scenarios to close the gap between green hydrogen production cost and fossil-based hydrogen, making project debt financing viable where it was not before. For investors, North America’s near-term order pipeline is the most policy-secured of any major region, but it is also the most exposed to regulatory reversal risk given political cycle dynamics in Washington.
Europe holds the second-largest regional position, and its structural advantage is not subsidy magnitude but auction mechanism sophistication. The European Hydrogen Bank’s contract-for-difference format provides long-term price certainty that attracts equity investors and project debt lenders at terms unavailable in less structured subsidy regimes. Germany’s approved hydrogen core network of 9,040 kilometers of pipelines, confirmed by Bundesnetzagentur in October 2024 at an expected investment of EUR 18.9 billion, provides the downstream infrastructure signal that industrial electrolyzer buyers need before committing to on-site production.
The EU and its member states are the most credible policy anchor for electrolyzer project development in the 2025 to 2030 window. For operators, Europe’s industrial cluster strategy, concentrated in Germany’s northern industrial zones, Normandy in France, and the Humber estuary in the UK, defines where the most actionable project pipeline sits, and any OEM without a service and integration presence in those geographies will find it difficult to win industrial-scale orders against locally embedded competitors.
Asia Pacific, led by China, accounts for the largest share of installed electrolyzer capacity globally. China held approximately 0.8 GW of cumulative installed capacity in 2023, the largest installed base worldwide, per IEA electrolysers data, and had more than 9 GW of electrolyzer projects at FID or under construction as of the same period. China’s manufacturing base reached approximately 20 GW per year in 2024 against domestic demand of around 2 GW, per IEA Global Hydrogen Review 2025 data, creating a structural export incentive that will reshape global equipment pricing through 2030.
India is the fastest-growing country-level opportunity, with government-backed manufacturing awards in early 2026 establishing a domestic supply chain that reduces project cost dependency on Chinese imports. Japan remains a technology-focused market prioritizing safety documentation and modular system validation over raw deployment volume, with Asahi Kasei’s multi-module Aqualyzer pilot at Kawasaki (started May 2024) representing the country’s most advanced commercial-scale demonstration. For investors, China’s manufacturing overcapacity is both a risk (to Western OEM valuations) and an opportunity (to project developers who can source Chinese equipment within their regulatory frameworks).
| Region | Share % | USD Value | Key Driver | Strategic Signal |
|---|---|---|---|---|
| North America | 43.7% | USD 4.93 billion | US IRA Section 45V, DOE project funding | Strongest near-term order flow; regulatory reversal risk present |
| Europe | Significant second | Estimated USD 3.5 billion range | European Hydrogen Bank CfD auctions, Germany pipeline network | Most durable policy anchor; industrial cluster demand concentrated |
| Asia Pacific | Growing fast | Estimated USD 2.0 billion range | China manufacturing dominance, India NGHM, Japan modular deployment | China cost pressure reshaping global pricing; India new supply geography |
| Middle East & Africa | Early stage | Nascent | Saudi NEOM project, renewable export ambitions | Water stress adds 40% project risk overlay; desalination cost must be included |
| Latin America | Nascent | Nascent | Chile and Brazil solar resource, green ammonia export | Offtake agreement development is the critical path constraint |
Competitive Landscape: Who Is Pulling Ahead and Why
Thyssenkrupp nucera and Siemens Energy hold the most defensible large-scale project positions among Western OEMs as of 2025. Thyssenkrupp nucera’s NEOM delivery using standardized 20 MW modules, with approximately half of the project’s more than 2 GW capacity delivered by September 30, 2024, proves repeatable module delivery at a scale no competitor has matched in a single commissioned project. That reference is not replicable by any challenger without a comparable project win, which creates a durable first-mover advantage in the gigawatt-scale industrial segment.
Siemens Energy reinforced its PEM position by securing a 280 MW electrolysis system contract from EWE in July 2024, designed to produce up to 26,000 tonnes of green hydrogen per year at Emden, Germany. For investors, both companies are building moats through project references that competitors cannot shortcut, and their market positions are more defensible than stock-market volatility in the hydrogen sector suggests.
John Cockerill Hydrogen strengthened its alkaline electrolyzer platform by acquiring key McPhy assets in July 2025, adding pressurized alkaline technology and improving European production capacity. Nel ASA received a firm PEM electrolyzer order in November 2025 for two 20 MW projects valued at more than USD 50 million, demonstrating that mid-scale PEM demand is converting to hardware orders despite the broader project slowdown. ITM Power signed the FEED contract for Uniper’s 120 MW Humber H2ub project in June 2025, positioning the company in one of the UK’s most advanced industrial hydrogen clusters.
The market is partially consolidating at the top (thyssenkrupp nucera and Siemens Energy capturing large industrial contracts) while fragmenting in the mid-scale segment, where Nel, ITM Power, and John Cockerill compete on service terms, stack life guarantees, and regional delivery capability. For operators entering new geographies, the key selection criterion is not headline stack efficiency but the supplier’s ability to provide long-term service cover and stack replacement economics, because downtime cost over a 20-year asset life dwarfs the initial capital cost differential between competing systems.
| Company | Market Position | Key Advantage | Recent Move |
|---|---|---|---|
| Thyssenkrupp Nucera | Large-scale alkaline & industrial leader | NEOM 2 GW module delivery reference; 20 MW standardized stack | Acquired Green Hydrogen Systems technology assets (September 2025) |
| Siemens Energy | Large-scale PEM leader | 280 MW EWE contract; gigawatt factory in Berlin | Berlin gigawatt factory inaugurated with Air Liquide (November 2023) |
| Nel ASA | Mid-scale PEM and alkaline specialist | Modular PEM platforms; Norway and US service network | USD 50 million PEM order for HyFuel and Kaupanes projects (November 2025) |
| John Cockerill Hydrogen | Industrial alkaline specialist | Pressurized alkaline technology; Europe and India focused | Acquired McPhy key assets for pressurized alkaline capability (July 2025) |
| ITM Power | UK PEM specialist | Humber industrial cluster presence; long-duration PEM stacks | FEED contract for Uniper 120 MW Humber H2ub (June 2025) |
| Plug Power | North America PEM and system integrator | US market access, 45V-eligible project pipeline | Louisiana JV with Olin Corporation targeting 15 tonnes per day (2025) |
| Bloom Energy | SOEC specialist | Solid oxide platform; high-temperature waste heat integration | Active in industrial SOEC commercialization |
| Cummins Inc. | PEM systems, North America and Canada | HyLYZER platform; Air Liquide Quebec 20 MW reference | Quebec 20 MW commercial deployment proven in extreme climate conditions |
Key Players in This Report
- Thyssenkrupp Nucera
- Nel ASA
- ITM Power
- Cummins Inc.
- Plug Power Inc.
- Siemens Energy
- John Cockerill Hydrogen
- Topsoe
- Sunfire GmbH
- Bloom Energy
Where This Market Goes Next
The most consequential activation condition for the next phase of market growth is the conversion of industrial offtake agreements for steel, ammonia, fertilizer, and synthetic fuel projects into signed electrolyzer orders. This is a causal relationship, not a correlational one: without an offtake contract that locks in a hydrogen purchase price, no project lender approves a construction loan, and without a construction loan, no electrolyzer purchase order is issued.
The data suggests this conversion is happening faster in the ammonia sector than elsewhere because fertilizer producers already consume industrial quantities of hydrogen, understand the cost structure, and face strengthening sustainability pressure from institutional investors. By 2027, our analysis indicates that ammonia-linked electrolyzer orders will represent the single largest application vertical by committed order value, displacing the energy segment currently measured on installed capacity. For operators, locking in ammonia producer offtake agreements now, before the next European Hydrogen Bank auction round concludes and before competing project developers establish supply positions, is the action that determines market access over the subsequent three years.
The second growth activation condition is the commercial deployment of hydrogen production projects integrated with carbon capture, utilization, and storage (CCUS), following the significant growth in FID-approved capacity across Europe and North America. This pathway creates a second route to low-cost, bankable hydrogen production that bypasses the full renewable electricity cost burden, and it is likely to accelerate electrolyzer deployment indirectly by normalizing low-emission hydrogen purchase agreements in industrial supply chains.
The data currently shows correlation between CCUS-integrated project development and electrolyzer market expansion in the same industrial clusters, but the causal chain requires confirmation through additional FID announcements expected through 2026. For investors, companies that can integrate electrolyzer systems into hybrid blue-green hydrogen production configurations will access project pipelines unavailable to pure-play green hydrogen suppliers.
The third activation condition is the commercial scaling of large-scale hydrogen production in water-stressed industrial regions using treated wastewater and desalination technologies. Approximately 40% of planned low-emission hydrogen projects using electrolyzers are in water-stressed regions, per IEA data, meaning that a substantial portion of the announced 520 GW pipeline depends on water supply solutions that do not yet exist at project-required scale and cost.
Saudi Arabia’s NEOM project is the most visible example of this challenge being actively solved, with thyssenkrupp nucera providing the electrolyzer system and co-located desalination providing water supply. Projects that solve the water constraint unlock the Middle East and North Africa region’s renewable resource advantage for green hydrogen export. By 2030, water-integrated hydrogen projects in this region could represent USD 15 to 25 billion in cumulative electrolyzer investment, assuming two to three large-scale export projects reach FID. For operators, establishing desalination integration partnerships now is a prerequisite for participation in this project category when it opens to competitive procurement.
| Condition | Timeline | Upside | Who Benefits |
|---|---|---|---|
| Ammonia offtake agreements converting to electrolyzer orders | 2025 to 2027 | Ammonia becomes largest application vertical by order value | Alkaline OEMs with industrial project references; thyssenkrupp nucera, John Cockerill |
| CCUS-integrated hydrogen projects reaching FID | 2026 to 2028 | Second bankable hydrogen production pathway normalizes industrial supply agreements | Suppliers with hybrid system integration capability |
| Water-stressed region projects scaling with desalination | 2027 to 2030 | USD 15 to 25 billion MENA electrolyzer investment window | OEMs with desalination partnership track records; thyssenkrupp nucera post-NEOM |
| European Hydrogen Bank auction round three and beyond | 2025 to 2026 | EUR 2 billion combined funding, direct order conversion in 24 months | European PEM specialists; Nel, ITM Power, Siemens Energy |
Key Developments
- September 2025: Thyssenkrupp nucera completed acquisition of key technology assets from Green Hydrogen Systems, adding pressurized alkaline electrolysis IP up to approximately 35 bar. Signal: consolidation of alkaline technology IP is accelerating ahead of industrial-scale project procurement cycles.
- July 2025: John Cockerill acquired key McPhy Energy assets to strengthen pressurized alkaline electrolyzer capability and European production. Signal: industrial alkaline segment is attracting inorganic investment as ammonia project pipeline materializes.
- June 2025: ITM Power signed the FEED contract for Uniper’s 120 MW Humber H2ub project in the UK. Signal: UK industrial cluster projects are moving from policy commitment to engineering stage, validating the 2025 government announcement of 11 first-round hydrogen projects totaling 124 MW.
- November 2025: Nel ASA received a firm PEM electrolyzer purchase order for the HyFuel and Kaupanes projects, valued at more than USD 50 million. Signal: mid-scale PEM orders are converting even in a difficult project finance environment, confirming PEM demand resilience.
- July 2024: Siemens Energy won a 280 MW electrolysis system contract from EWE for the Emden project, targeting 26,000 tonnes of green hydrogen per year. Signal: German utility procurement is moving from pilot to industrial scale, anchored by European Hydrogen Bank-style revenue support.
- February 2026: India’s Press Information Bureau confirmed 15 companies received 3,000 MW per annum of electrolyzer manufacturing capacity allocations under the National Green Hydrogen Mission. Signal: India is establishing a domestic supply base that will compete with Chinese manufacturing in South and Southeast Asian project markets by 2028.