What Is the Digital Twin in Automotive Manufacturing Market Size?
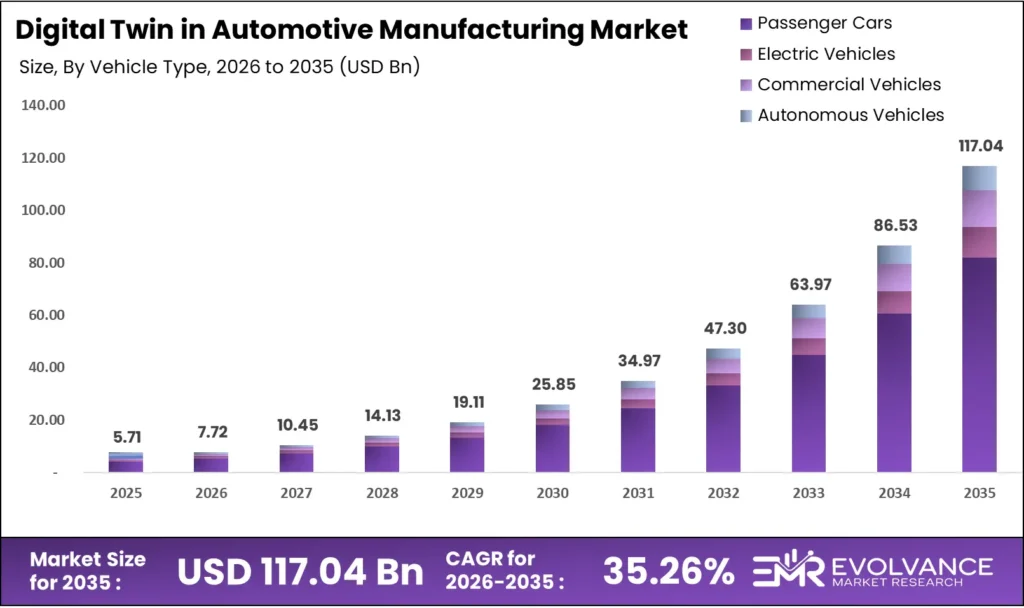
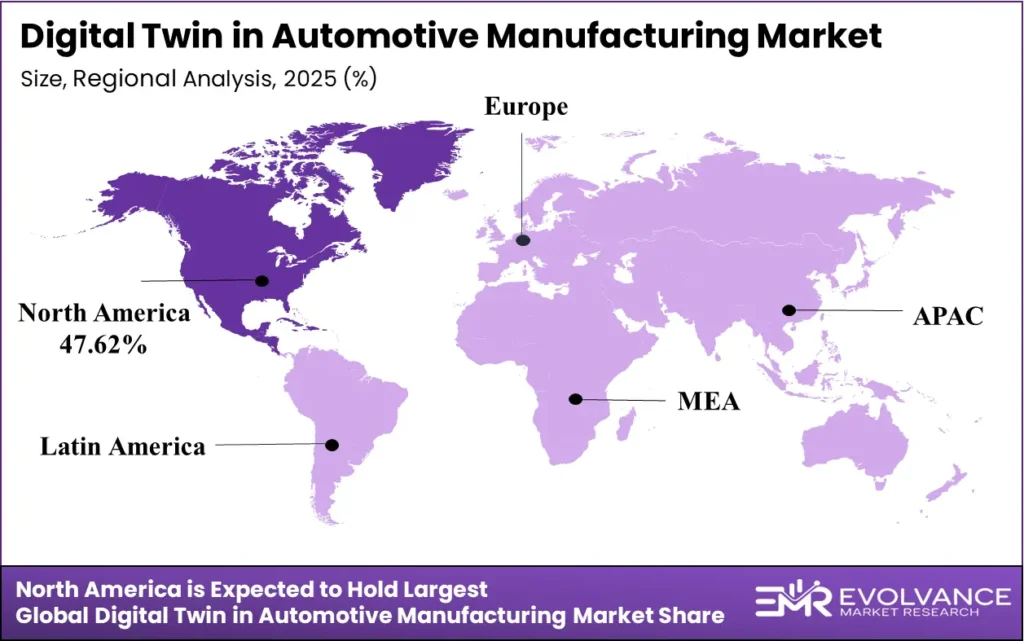
The global digital twin in the automotive manufacturing market will reach USD 117.04 billion by 2034 from USD 5.71 billion in 2025, growing at a CAGR of 35.26% during 2026 to 2034. North America leads with a 47.62% share valued at USD 2.66 billion; Asia-Pacific is the fastest-growing region at 36.1% share valued at USD 2.06 billion. This growth reflects surging OEM investment in software-defined vehicle platforms, the complexity of electric vehicle production, and factory-scale simulation — forces that are reshaping how automakers design, validate, and build vehicles before a single physical component is produced.
Market Highlights
- The global digital twin in automotive manufacturing market was valued at USD 5.71 billion in 2025 and is forecast to reach USD 117.04 billion by 2034, growing at a CAGR of 35.26%.
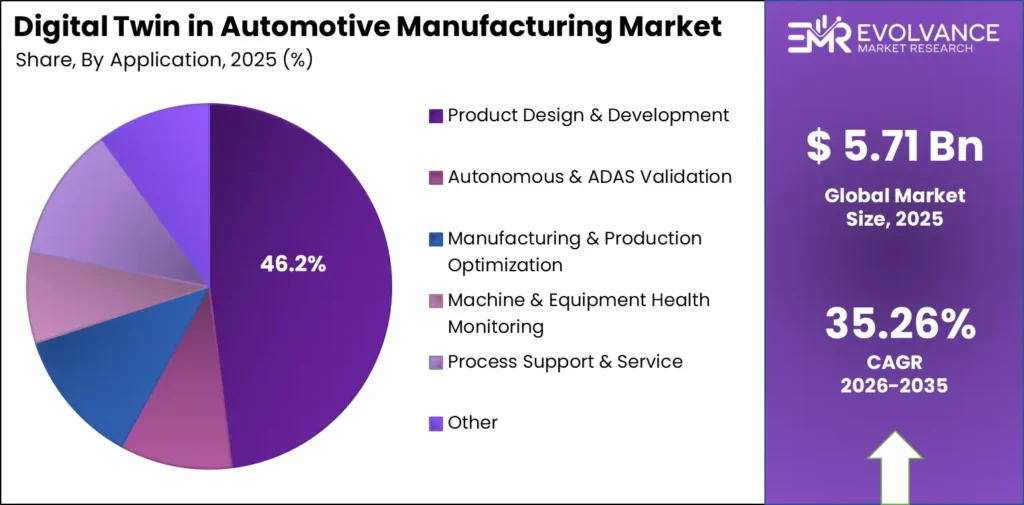
- Product Design & Development dominates the application segment with a 48.8% share, driven by virtual prototyping replacing physical build cycles.
- Autonomous & ADAS Validation is the fastest-growing application sub-segment, fueled by regulatory mandates and Level 2+ certification costs.
- Passenger Cars lead the vehicle type segment with a 72.1% share, supported by global production volume exceeding 70 million units annually.
- Electric Vehicles represent the fastest-growing vehicle type sub-segment, driven by EV-specific powertrain and battery validation requirements.
- Simulation & Modeling Module holds the leading component/platform layer share at approximately 29.5%, as physics-based simulation underpins all twin types.
- Analytics & AI Engine is the fastest-growing component sub-segment, powered by real-time predictive analytics and machine learning adoption.
- Cloud deployment dominates with a 48.6% share, while Hybrid is the fastest-growing deployment model due to data sovereignty and edge compute requirements.
- OEMs lead the end-user segment with a 44.8% share; Fleet Operators & Mobility Providers are the fastest-growing end-user group.
- Software License/Subscription captures approximately 54.9% of the business/revenue model segment; Managed Services is the fastest-growing revenue model.
- North America leads all regions with a 47.62% share valued at USD 2.66 billion in 2025.
- Asia-Pacific is the fastest-growing region with a 36.1% share valued at USD 2.06 billion, led by China’s EV production scale.
- China’s automotive digital twin market is projected to grow at the fastest national CAGR of 43.9%, reaching USD 8.38 billion by 2034.
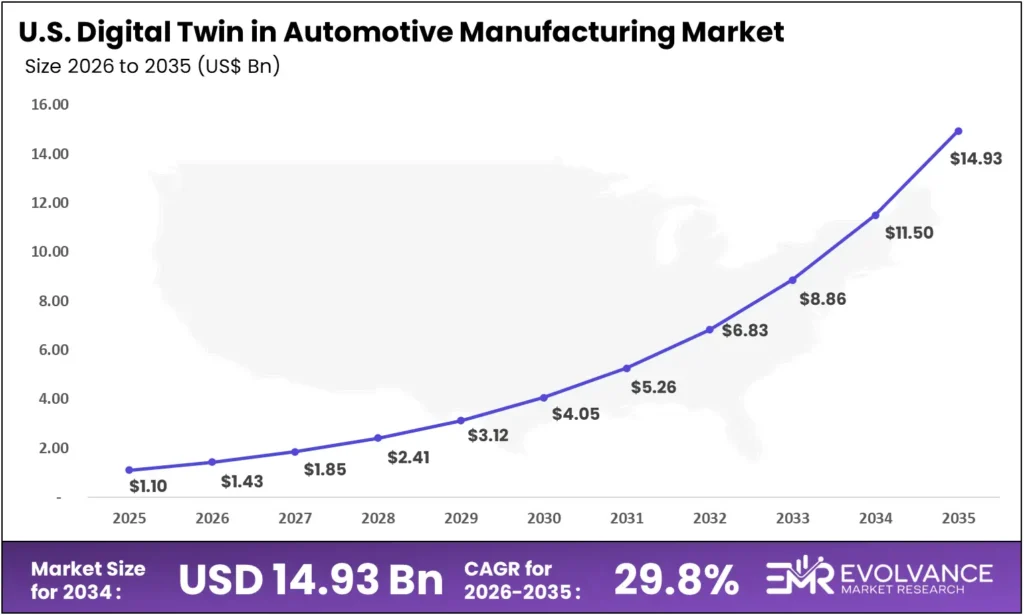
- The United States market reached USD 1.1 billion in 2025 and is forecast to grow to USD 14.93 billion by 2034 at a CAGR of 29.8%.
Market Overview
What Is a Digital Twin in Automotive Manufacturing?
A digital twin in automotive manufacturing is a real-time virtual replica of a physical vehicle, production system, or factory floor, continuously fed by live IoT and sensor data. This market covers software platforms, simulation engines, and analytics tools that OEMs, Tier-1 suppliers, and engineering firms deploy across the full vehicle lifecycle — from pre-production design through in-service fleet operations — to test, validate, and optimize without physical build cycles.
The automotive manufacturing segment is the fastest-growing vertical within the broader Digital Twin in Manufacturing market — projected to reach USD 713.61 billion by 2032 — as OEMs and Tier-1 suppliers accelerate platform adoption ahead of other industrial sectors. This analysis consolidates data from primary industry interviews, proprietary forecast modeling, and cross-validation against OEM annual reports, International Federation of Robotics data, and trade association inputs. EMR analysts covered 6 regions and 10 segmentation dimensions to produce a forecast grounded in bottom-up revenue modeling and analyst validation. Buyers evaluating digital twin platforms should note that procurement cycles in this market are lengthening as platform complexity increases — making early vendor assessment critical to project timelines.
Automotive manufacturers face mounting pressure to compress vehicle development cycles, reduce physical prototype costs, and meet tightening emissions and safety regulations — problems digital twins solve by moving validation into the virtual domain. Beyond vehicle design, digital twin applications in automotive manufacturing span factory layout simulation, predictive maintenance of production equipment, ADAS validation, and battery system optimization for electric vehicles, reflecting core capabilities within the broader advanced and intelligent manufacturing landscape.
Product Design & Development captures the largest share of application demand, reflecting the industry’s shift toward virtual prototyping before physical production begins. Cloud-based deployment accounts for nearly half of all platform deployments, driven by scalability needs across multi-plant OEM networks. OEMs represent the largest end-user group. Software subscription models have become the standard commercial structure — a shift that compresses vendor selection timelines and raises switching costs once a platform is embedded in engineering workflows. (EMR, 2025)
United States Automotive Digital Twin Market
The United States automotive digital twin market reached USD 1.1 billion in 2025 and is forecast to grow to USD 14.93 billion by 2034 at a CAGR of 29.8%. The US leads North America through a combination of the deepest OEM engineering R&D concentration in the world, mature cloud systems via hyperscalers including Microsoft, Amazon Web Services, and Google, and a regulatory environment that accelerates ADAS and autonomous vehicle validation investment.
China Automotive Digital Twin Manufacturing Market
China’s automotive digital twin market stood at USD 0.22 billion in 2025 and is projected to reach USD 8.38 billion by 2034 — the fastest national CAGR in the market at 43.9%. This growth is anchored in China’s position as the world’s largest EV production base, the government’s Made in China 2025 initiative driving domestic manufacturing digitalization, and the speed at which Chinese OEMs including BYD, NIO, and Li Auto are integrating digital twin platforms into new model development programs.
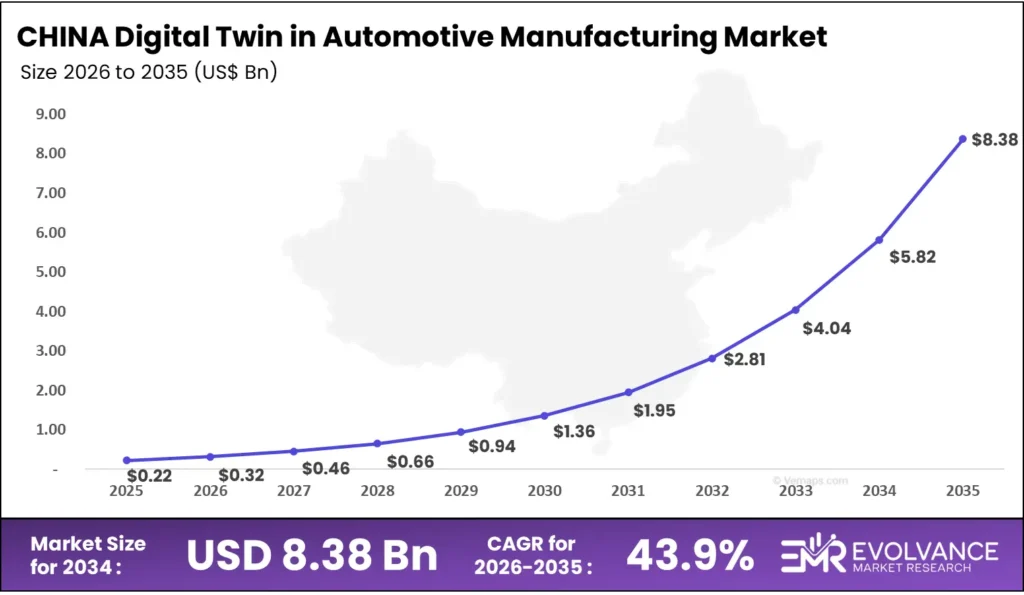
However, the China market carries structural complexity for global vendors. Siemens reported China revenue of EUR 7,143 million in FY2025, down from EUR 8,082 million in FY2024, as intensified domestic price pressure and US tariff effects compressed foreign vendor margins. This squeeze is accelerating a bifurcation: multinational platforms face pricing and data sovereignty headwinds, while domestic players benefit from government-backed procurement preferences — a dynamic that will shape competitive positioning in China for the remainder of this decade.
Related Digital Twin Markets
The digital twin in automotive manufacturing market sits within a broader ecosystem of industrial digital twin adoption. Adjacent markets — spanning discrete manufacturing, process industries, and smart infrastructure — share the same foundational platforms, simulation engines, and AI analytics layers, making vendor positioning in automotive a direct indicator of competitive strength across the wider industrial digital twin landscape.
Key Related Markets
- The broader Digital Twin in Manufacturing Market covers automotive alongside aerospace, electronics, and industrial machinery. This market is projected to reach USD 713.61 billion by 2032, reflecting the cross-industry spread of the same simulation and IoT-integration platforms that automotive OEMs deploy today.
- The global Digital Twin in Aerospace Manufacturing Market was valued at USD 5.82 billion in 2025 and is projected to reach approximately USD 89.99 billion by 2035, growing at a CAGR of 31.50% during the forecast period 2026 to 2035. The convergence of AI-powered simulation, IoT-enabled real-time sensor integration, and next-generation aircraft development programs.
- Beyond industrial manufacturing, the same simulation and data-integration architecture underpins the Digital Twin for Telecom Network Simulation Market, where network-level virtual replicas are converging with factory-floor twin platforms to enable end-to-end connected manufacturing environments
Application Analysis
Product Design & Development dominates with 48.8% due to virtual prototyping replacing physical build cycles.
In 2025, Product Design & Development held a dominant position in the application segment, with a 48.8% share. Automakers use digital twins at the design stage to simulate crash behavior, aerodynamic performance, and material stress — replacing expensive physical prototypes. Siemens and Dassault Systèmes anchor this segment through their PLM and CAD-integrated twin platforms, Xcelerator and 3DEXPERIENCE.
Autonomous & ADAS Validation is the fastest-growing application sub-segment, driven by regulatory mandates and the rising complexity of Level 2+ driver assistance systems. Physical road testing for ADAS validation is prohibitively expensive at scale — a single OEM may require billions of simulated miles to certify a system. Digital twins compress this cycle by running scenario libraries in virtual environments, with Applied Intuition and dSPACE GmbH emerging as specialized players in this space.
Manufacturing & Production Optimization addresses the factory floor directly — simulating assembly line layouts, robotic arm sequencing, and material flow before physical installation. This sub-segment is gaining share as OEMs build new EV production lines that cannot afford costly mid-build redesigns. BMW’s Virtual Factory deployment across more than 30 production sites demonstrates how factory-scale twins now operate at industrial volume, not pilot scale.
| Sub-segment | Share % | Primary Driver |
|---|---|---|
| Product Design & Development | 48.8% | Virtual prototyping replaces physical build cycles |
| Autonomous & ADAS Validation | Fastest-growing | Regulatory mandates and Level 2+ certification costs |
| Manufacturing & Production Optimization | N/A | EV line buildout and factory redesign demand |
| Machine & Equipment Health Monitoring | N/A | Predictive maintenance reduces unplanned downtime |
| Battery & Energy Management | N/A | EV cell formation and thermal validation requirements |
| Supply Chain & Logistics | N/A | Supply chain resilience and inventory simulation |
| Process Support & Service | N/A | Aftersales service optimization and remote diagnostics |
Vehicle Type Analysis
Passenger Cars dominate with 72.1% due to volume scale and OEM design complexity.
In 2025, Passenger Cars held a dominant position in the vehicle type segment, with a 72.1% share. The scale of global passenger car production — exceeding 70 million units annually — creates a structural lock-in for digital twin investment, as OEMs deploy twins across model variants, trim levels, and platform derivatives. This volume concentration means passenger car digital twin platforms carry lower per-unit cost of development, reinforcing incumbents like Siemens and Dassault Systèmes over niche entrants.
Electric Vehicles represent the fastest-growing vehicle type sub-segment, as EV architectures introduce battery management, thermal systems, and software-defined powertrain components that require purpose-built simulation environments. Legacy ICE-era digital twin platforms require significant rearchitecting to handle EV-specific validation workflows. This gap is creating procurement openings for EV-native twin vendors — particularly in China and South Korea, where EV production is scaling faster than incumbent platforms can adapt.
Commercial Vehicles present a distinct use case centered on fleet durability, load simulation, and predictive maintenance across high-mileage assets. OEMs such as Bosch and platform integrators serving logistics fleets use digital twins to extend service intervals and reduce warranty costs — a buyer motivation that differs structurally from passenger car design validation. This means commercial vehicle digital twin contracts are more likely to be driven by fleet operators and aftermarket service centers than by engineering departments.
Autonomous Vehicles drive some of the highest-value digital twin deployments in the market, as full self-driving validation requires scenario counts that no physical test program can match. Applied Intuition and NVIDIA’s DRIVE simulation stack serve this sub-segment, where a single OEM program can represent multi-year, eight-figure platform contracts. However, the slow commercialization timeline for fully autonomous vehicles keeps this sub-segment from displacing passenger car volume dominance in the near term.
| Sub-segment | Share % | Primary Driver |
|---|---|---|
| Passenger Cars | 72.1% | Global production volume and platform complexity |
| Electric Vehicles | Fastest-growing | EV-specific powertrain and battery validation needs |
| Commercial Vehicles | N/A | Fleet durability and predictive maintenance demand |
| Autonomous Vehicles | N/A | Scenario simulation for AV safety certification |
Technology Type Analysis
System Digital Twin leads the Technology Type segment due to full-vehicle integration across electronics and software.
In 2025, System Digital Twin held a leading position in the technology type segment. System twins model entire vehicle architectures — integrating electrical, mechanical, software, and thermal subsystems into one synchronized environment. This makes them the preferred tool for OEMs managing software-defined vehicle complexity. Siemens PAVE360 and Dassault 3DEXPERIENCE are the primary platforms deployed in this category, with system twins now embedded in pre-production validation programs at Volkswagen, BMW, and Hyundai.
Product Digital Twin focuses on individual components or subsystems — a brake assembly, an engine block, or a battery cell — rather than the full vehicle architecture. This type dominates Tier-1 supplier workflows, where component-level simulation feeds into OEM system twins upstream. Tier-1 adoption of product twins is a structural prerequisite for OEM system twin deployment. This creates a cascading market development pattern — not a winner-take-all dynamic at the top.
Process Digital Twin models manufacturing workflows — stamping sequences, paint booth conditions, welding robot paths, and assembly line throughput — rather than the vehicle itself. This type is growing as OEMs build new EV production facilities where process simulation reduces capital-intensive line redesigns. Rockwell Automation’s Emulate3D platform and Siemens Plant Simulation are the primary tools in this category, competing on integration depth with existing MES and ERP systems.
Component/Platform Layer Analysis
Simulation & Modeling Module dominates with ~29.5% due to core physics engine demand across all twin types.
In 2025, the Simulation & Modeling Module held a dominant position in the component/platform layer segment, with approximately 29.5% share. Physics-based simulation is the foundational capability every digital twin requires — without it, the twin cannot replicate real-world behavior. This explains why ANSYS, Altair Engineering (now part of Siemens), and Hexagon’s Manufacturing Intelligence division compete most directly at this layer, where displacing an incumbent simulation engine affects every downstream module in the platform.
Analytics & AI Engine is the fastest-growing component sub-segment, as automakers move beyond static simulation toward real-time predictive analytics that feed production decisions continuously. Machine learning models trained on sensor data now power predictive maintenance, quality inspection, and energy optimization within automotive digital twin platforms. NVIDIA’s Omniverse and Microsoft’s Azure Digital Twins are the leading infrastructure layers enabling this capability — a competitive position that gives cloud hyperscalers structural influence over the analytics layer.
Platform/Core Engine is the integration and orchestration layer — managing data flows between simulation, analytics, visualization, and connectivity modules. Once an OEM embeds a core engine into its PLM and MES workflows, switching costs are significant. This is why Siemens Xcelerator and Dassault 3DEXPERIENCE compete aggressively on platform breadth. Locking the core engine locks the entire digital twin stack for a multi-year procurement cycle.
| Sub-segment | Share % | Primary Driver |
|---|---|---|
| Simulation & Modeling Module | ~29.5% | Physics engine demand across all twin deployments |
| Analytics & AI Engine | Fastest-growing | Real-time predictive analytics and ML adoption |
| Platform/Core Engine | N/A | Platform lock-in and PLM/MES integration stickiness |
| Connectivity & Data Integration | N/A | Shop-floor sensor volume and IIoT middleware demand |
| Visualization/UI Layer | N/A | Real-time 3D factory visualization for operations teams |
Deployment Model Analysis
Cloud deployment dominates with 48.6% due to multi-plant scalability and OEM data volume demands.
In 2025, Cloud deployment held a dominant position in the deployment model segment, with a 48.6% share. OEMs operating dozens of global production facilities require deployment architectures that scale horizontally without per-plant investment — a requirement only cloud platforms can satisfy at automotive production scale. Microsoft Azure Digital Twins, Siemens Xcelerator on cloud, and Dassault 3DEXPERIENCE Cloud are the primary platforms capturing this share, with Volkswagen’s 43-plant Digital Production Platform on AWS serving as the most visible enterprise deployment.
Hybrid deployment is the fastest-growing deployment model, combining cloud orchestration with on-premises edge compute for latency-sensitive applications such as real-time quality inspection and robotic control feedback. This model is particularly relevant for Tier-1 suppliers and plants in regions with data sovereignty requirements — including China and Germany — where full cloud deployment conflicts with regulatory or contractual data residency obligations. The hybrid growth trajectory signals that pure-cloud positioning alone will not capture the full market opportunity.
| Sub-segment | Share % | Primary Driver |
|---|---|---|
| Cloud | 48.6% | Multi-plant scalability and OEM data volume |
| Hybrid | Fastest-growing | Data sovereignty and edge compute requirements |
| On-Premises | N/A | Legacy plant systems and data residency constraints |
End-User Analysis
OEMs dominate with 44.8% due to full-vehicle program scale and platform investment capacity.
In 2025, OEMs held a dominant position in the end-user segment with a 44.8% share. Automakers hold the largest digital twin budgets in the ecosystem — a single OEM platform program can justify enterprise-scale twin deployments that individual suppliers cannot match. This concentration gives OEMs disproportionate influence over platform standards: when Volkswagen adopts Dassault 3DEXPERIENCE as its engineering platform, it effectively sets the interoperability requirement for every supplier in its value chain.
Fleet Operators & Mobility Providers are the fastest-growing end-user sub-segment, as connected vehicle data streams create new twin use cases beyond manufacturing — real-time fleet health monitoring, predictive maintenance, and software-defined service interval management. This growth is structurally different from OEM-driven demand: fleet operators prioritize running cost reduction over design validation, which means they buy different modules and accept different pricing structures than engineering-focused OEM buyers.
Tier-1 & Tier-2 Suppliers represent a large and structurally underserved buyer group in digital twin adoption. Most Tier-1 suppliers use product-level twins for component simulation, but full integration with OEM system twins remains limited by data sharing agreements, format incompatibility, and cost barriers for mid-size suppliers. Schaeffler’s June 2025 partnership with NVIDIA to integrate over 50% of its plants into Omniverse by 2030 represents the leading edge of what Tier-1 digital twin investment can look like.
Engineering Service Providers — including Capgemini, Accenture, and specialist simulation consultancies — occupy the integration and implementation layer, converting platform licenses into functioning twin deployments within OEM and supplier environments. Their market position is both an opportunity and a vulnerability: high services revenue per engagement makes them attractive, but as platforms become easier to deploy, the integration services revenue pool will compress. Vendors with strong professional services arms will retain this revenue longer than pure software players.
| Sub-segment | Share % | Primary Driver |
|---|---|---|
| OEMs | 44.8% | Full-vehicle program scale and platform investment |
| Fleet Operators & Mobility Providers | Fastest-growing | Connected fleet health and predictive maintenance |
| Tier-1 & Tier-2 Suppliers | N/A | Component simulation and OEM integration requirements |
| Engineering Service Providers | N/A | Implementation services and platform integration demand |
| Aftermarket & Service Centers | N/A | Remote diagnostics and in-service twin monitoring |
Business/Revenue Model Analysis
Software License/Subscription captures ~54.9% due to recurring revenue shift across platform vendors.
In 2025, Software License/Subscription held a dominant position in the business/revenue model segment, with approximately 54.9% share. The industry-wide shift from perpetual license to subscription-based SaaS structures has reached automotive digital twin platforms — PTC’s Annual Recurring Revenue of USD 2,478 million in FY2025 and Dassault Systèmes’ 3DEXPERIENCE Cloud growth at 32% constant currency both reflect this structural transition.
Managed Services is the fastest-growing revenue model sub-segment, as OEMs and suppliers increasingly outsource twin operation, monitoring, and update management to vendors rather than building internal capability. This shift reflects a broader pattern in enterprise software: buyers want outcomes — reduced downtime, faster validation cycles, lower defect rates — rather than platform licenses that require internal expertise to run. Vendors that bundle managed services with platform subscriptions capture higher total contract value and reduce churn compared with license-only arrangements.
Professional & Integration Services remain a significant revenue line for both platform vendors and systems integrators, covering the initial rollout, customization, and workflow integration that converts a platform license into a functioning digital twin program. However, this revenue category is under structural pressure as platforms add out-of-the-box connectors and pre-configured templates. PTC’s professional services revenue declined from USD 132 million in FY2024 to USD 107 million in FY2025, signaling that platform maturation is compressing the integration opportunity.
| Sub-segment | Share % | Primary Driver |
|---|---|---|
| Software License/Subscription | ~54.9% | SaaS transition and recurring revenue structuring |
| Managed Services | Fastest-growing | Outcome-based buying and internal capability gaps |
| Professional & Integration Services | N/A | Initial platform rollout and workflow integration |
Vehicle Lifecycle Phase Analysis
Pre-Production Phase leads Vehicle Lifecycle deployment due to highest ROI from early virtual validation.
In 2025, the Pre-Production Phase held a leading position in the vehicle lifecycle segment. Digital twin investment delivers the highest return at the pre-production stage — errors caught in virtual design cost a fraction of those discovered during physical tooling or line commissioning. BMW’s decision to plan its entire Debrecen, Hungary plant virtually before construction began illustrates the scale at which pre-production twins now operate, removing entire categories of physical rework from the capital expenditure cycle.
In-Production Phase digital twins operate in real time alongside active manufacturing lines — monitoring equipment health, detecting quality deviations, and optimizing throughput without interrupting production. This phase is where predictive maintenance use cases are most commercially mature, and where Bosch, Rockwell Automation, and Hitachi compete directly through IIoT-integrated twin platforms. In-production twins generate continuous operational data that feeds back into pre-production models — creating the closed-loop architecture that distinguishes advanced deployments from isolated proof-of-concept installations.
| Sub-segment | Share % | Primary Driver |
|---|---|---|
| Pre-Production Phase | Dominant | Highest ROI from early virtual error detection |
| In-Production Phase | N/A | Real-time predictive maintenance and quality control |
| In-Service/Operational Phase | N/A | Fleet monitoring and OTA software management |
| End-of-Life/Disposal Phase | N/A | EU circular economy mandates and battery recovery |
Sustainability/ESG Function Analysis
Carbon Emissions Monitoring & Reduction dominates due to EU CO₂ fleet targets and CSRD reporting mandates.
In 2025, Carbon Emissions Monitoring & Reduction held a dominant position in the sustainability/ESG function segment. Automakers face binding CO₂ fleet average targets under EU regulation and mandatory scope 3 emissions disclosure under the Corporate Sustainability Reporting Directive — and digital twins are now the primary tool used to model emissions across production processes, supply chains, and vehicle lifecycle stages before physical operations begin. Siemens and Dassault Systèmes have both embedded carbon simulation modules directly into their core twin platforms to capture this regulatory-driven demand.
Energy Efficiency Optimization twins model energy use across factory operations — HVAC, press lines, paint shops, and robotic systems — identifying reduction opportunities without production interruption. Volkswagen’s AI energy system at its Poznan plant reduced electricity use by 12%, demonstrating the measurable impact that positions energy efficiency twins as a CFO-level investment case rather than an engineering tool.
| Sub-segment | Share % | Primary Driver |
|---|---|---|
| Carbon Emissions Monitoring & Reduction | Dominant | EU CO₂ fleet targets and CSRD disclosure mandates |
| Energy Efficiency Optimization | N/A | Factory energy cost reduction and CFO-level ROI |
| Circular Economy & End-of-Life Planning | N/A | EU battery passport and producer responsibility rules |
| Lifecycle Environmental Assessment | N/A | Scope 3 emissions reporting and supplier chain compliance |
Cybersecurity Function Analysis
Regulatory Compliance dominates due to mandatory UN R155/R156 and ISO/SAE 21434 certification requirements.
In 2025, Regulatory Compliance held a dominant position in the cybersecurity function segment. UN Regulation R155 and R156 — mandatory for new vehicle type approvals in the EU, Japan, South Korea, and 49 additional signatory markets — require automakers to demonstrate systematic cybersecurity management across the vehicle lifecycle, including software update security. Digital twins that model regulatory compliance workflows have become a required component of OEM type-approval processes, making this sub-segment structurally non-discretionary spending rather than optional investment.
Threat Detection & Vulnerability Assessment twins create virtual replicas of vehicle software and connected systems to probe for attack surfaces before production release — a process that physical penetration testing cannot execute at the scale or speed that current software-defined vehicle development programs require. Siemens PAVE360 and specialist cybersecurity simulation tools serve this sub-segment, which is growing as the attack surface of connected vehicles expands with each new software-defined feature added to production vehicles.
| Sub-segment | Share % | Primary Driver |
|---|---|---|
| Regulatory Compliance (UN R155/R156 & ISO/SAE 21434) | Dominant | Mandatory type-approval cybersecurity certification |
| Threat Detection & Vulnerability Assessment | N/A | SDV attack surface expansion and pre-release probing |
| OTA Update Security Management | N/A | Continuous software delivery and recall prevention |
| Intrusion Detection System Twins | N/A | Real-time connected vehicle threat monitoring |
Market Segments Covered in the Report
By Application
- Product Design & Development
- Autonomous & ADAS Validation
- Manufacturing & Production Optimization
- Machine & Equipment Health Monitoring
- Process Support & Service
- Battery & Energy Management
- Supply Chain & Logistics
By Vehicle Type
- Passenger Cars
- Electric Vehicles
- Commercial Vehicles
- Autonomous Vehicles
By Technology Type
- System Digital Twin
- Product Digital Twin
- Process Digital Twin
- Vehicle-as-a-Service Digital Twin
- Hybrid Digital Twin
By Component/Platform Layer
- Simulation & Modeling Module
- Analytics & AI Engine
- Platform/Core Engine
- Connectivity & Data Integration
- Visualization/UI Layer
By Deployment Model
- Cloud
- On-Premises
- Hybrid
By End-User
- OEMs
- Fleet Operators & Mobility Providers
- Tier-1 & Tier-2 Suppliers
- Engineering Service Providers
- Aftermarket & Service Centers
By Business/Revenue Model
- Software License/Subscription
- Managed Services
- Professional & Integration Services
By Vehicle Lifecycle Phase
- Pre-Production Phase
- In-Production Phase
- In-Service/Operational Phase
- End-of-Life/Disposal Phase
By Sustainability/ESG Function
- Carbon Emissions Monitoring & Reduction
- Energy Efficiency Optimization
- Circular Economy & End-of-Life Planning
- Lifecycle Environmental Assessment
By Cybersecurity Function
- Regulatory Compliance (UN R155/R156 & ISO/SAE 21434)
- Threat Detection & Vulnerability Assessment
- OTA Update Security Management
- Intrusion Detection System Twins
Automotive Digital Twin Market Regional Insights
North America Holds 47.62% Share at USD 2.66 Billion
North America leads the global digital twin in automotive manufacturing market with a 47.62% share valued at USD 2.66 billion in 2025, anchored by the United States OEM engineering base and the deepest cloud ecosystem in the world. General Motors, Ford, and Stellantis run multi-platform digital twin programs sourced from Siemens, Dassault Systèmes, and Microsoft Azure. This means North America will remain the highest-value single market for digital twin platform vendors throughout the forecast period — a concentration that justifies dedicated regional go-to-market investment.
Asia-Pacific Automotive Digital Twin Market Trends
Asia-Pacific holds a 36.1% share at USD 2.06 billion and is the fastest-growing region, driven by China’s EV production scale, Japan’s precision manufacturing digitalization, and South Korea’s OEM software investment. Dassault Systèmes reported that Asia software revenue grew 5% in FY2025, representing 22% of total software sales — with Transportation & Mobility as the primary driver. This regional growth rate signals that Asia-Pacific will close the gap with North America in absolute revenue terms faster than current share figures suggest.
Europe Automotive Digital Twin Market Trends
Europe is the third-largest regional market, anchored by Germany’s automotive manufacturing base — home to Volkswagen Group, BMW, and Mercedes-Benz — and supported by France’s Stellantis operations and Italy’s specialty vehicle programs. European adoption faces a structural headwind: the ongoing transition away from ICE production is disrupting capital expenditure cycles at legacy plants, delaying digital twin investment decisions. However, EU regulatory mandates on cybersecurity, emissions reporting, and battery lifecycle tracking create non-discretionary digital twin spending that offsets near-term capex caution.
Latin America and MEA Automotive Digital Twin Trends
Latin America and the Middle East & Africa represent emerging adoption markets where digital twin rollout is concentrated at greenfield automotive manufacturing facilities rather than legacy plant upgrades. Brazil’s Stellantis and Volkswagen plants and Saudi Arabia’s nascent automotive manufacturing ambitions under Vision 2030 signal early-stage demand. Foxconn’s planned AI investment of USD 2–3 billion per year starting 2025 highlights how capital flows are beginning to reshape digital twin demand patterns outside traditional automotive hubs.
| Region | Share % | USD Value (2025) |
|---|---|---|
| North America | 47.62% | USD 2.66 Billion |
| Asia-Pacific | 36.1% | USD 2.06 Billion |
| Europe | N/A | N/A |
| Latin America | N/A | N/A |
| Middle East & Africa | N/A | N/A |
Key Regions and Countries
North America
- US
- Canada
Europe
- Germany
- France
- The UK
- Spain
- Italy
- Rest of Europe
Asia Pacific
- China
- Japan
- South Korea
- India
- Australia
- Rest of APAC
Latin America
- Brazil
- Mexico
- Rest of Latin America
Middle East & Africa
- GCC
- South Africa
- Rest of MEA
Regulatory Landscape
UN Regulation R155 and R156, adopted by the UNECE Working Party on Automated and Connected Vehicles and mandatory for new vehicle type approvals across the EU, Japan, South Korea, and 49 additional signatory markets, require automakers to maintain certified cybersecurity management systems and secure OTA software update processes across the entire vehicle lifecycle. These regulations make digital twin-based cybersecurity validation a legal prerequisite for market access — not an optional engineering investment — in markets covering the majority of global vehicle sales.
The EU Corporate Sustainability Reporting Directive, which took effect for large companies in 2024 and extends to listed SMEs from 2026, mandates scope 3 emissions disclosure across the full value chain. Digital twins that model carbon flows across production processes are becoming CSRD compliance tools. For European OEMs and Tier-1 suppliers, this converts ESG reporting obligations into direct digital twin procurement budgets.
In August 2024, Siemens Cre8Ventures and Thalia Design Automation launched a partnership integrating semiconductor design-migration tools into the Siemens Digital Twin Marketplace — directly targeting EU automotive semiconductor compliance simulation requirements. This signals how regulatory pressure on automotive semiconductor traceability is creating a new market segment for compliance-specific digital twin tooling within the broader European regulatory framework.
Key Drivers
Software-Defined Vehicles Accelerate Digital Twin Platform Demand
Software-defined vehicle architecture forces automakers to validate billions of lines of code across electrical, safety, and infotainment systems before production release — a task physical testing cannot execute at the required scale or speed. In June 2025, Siemens and Arm announced a partnership integrating Arm automotive IP into the PAVE360 environment, enabling SDV software development up to 2 years earlier than traditional methods. In our view, SDV complexity is the most durable structural driver in this market: every new vehicle platform creates a new digital twin program, not a refresh of an existing one.
Digital Twin for Automotive Supply Chain Optimization
Supply chain disruptions — from semiconductor shortages in 2021–2022 to geopolitical-driven logistics failures — exposed the cost of running automotive production without real-time supply chain simulation. Digital twins now model supplier lead times, inventory buffers, and logistics scenarios continuously, giving procurement and operations teams decision support that static ERP systems cannot provide. This capability shift moves digital twin spend from engineering departments into supply chain and operations budgets — broadening the buyer base and increasing average contract value per OEM deployment.
Industry 4.0 and IIoT Drive Factory-Scale Twin Adoption
Industry 4.0 investment across automotive manufacturing plants has created the sensor tools, connectivity standards, and data historian systems that digital twins require to work in real time. A 2024 virtual commissioning study showed that digital twin deployments detected 20 control logic errors pre-deployment, compared with just 5 errors found through manual commissioning — a fourfold improvement that directly reduces launch cost and schedule risk for every new production line. This evidence base is converting skeptical plant managers into active digital twin advocates within OEM capital approval processes.
Restraints
High Upfront Costs Limit SME Digital Twin Adoption
Enterprise digital twin platforms from Siemens and Dassault Systèmes require six-to-seven-figure initial investment in software licenses, integration services, and facilities before a single simulation runs. For Tier-2 and Tier-3 suppliers — the majority of automotive manufacturers by count — this cost structure is prohibitive. Comprehensive digital twin deployment sits beyond their capital planning horizon, creating a two-speed market where large OEMs and Tier-1 suppliers adopt at pace while the broader supplier base remains on the sideline.
Data Interoperability Gaps Slow Automotive DT Rollout
Automotive manufacturing environments run CAD files in multiple formats, PLM systems from competing vendors, MES platforms with proprietary data schemas, and IoT sensors using incompatible protocols — and digital twins must ingest all of these simultaneously to produce reliable simulations. Integration failures at the data layer are the leading cause of delayed or abandoned digital twin programs, as reported by engineering teams at both OEM and Tier-1 levels. This restraint benefits incumbents with broad native integrations — Siemens Xcelerator and Dassault 3DEXPERIENCE — and structurally disadvantages new entrants who must build connector libraries from scratch.
Cybersecurity Risks Create Barriers for Connected Twins
A digital twin that mirrors a live production line in real time creates a high-value attack surface: an adversary who compromises the twin gains visibility into production schedules, tooling configurations, and vehicle software — intelligence with significant competitive and national security implications. UN R155 compliance requires documented cybersecurity risk assessments, but many automotive manufacturers lack the internal expertise to architect secure twin rollouts. This capability gap delays procurement decisions. It also inflates total cost of ownership as external cybersecurity consultancy is added to every major program.
Growth Opportunities
Digital Twin ROI in Automotive Manufacturing Proven at Scale
A 2024 EV manufacturing study demonstrated that digital twin virtual commissioning delivered a 51% ROI after just 12 months, with breakeven reached in 3 months (ESR Groups Journal, 2024) — figures that convert CFO-level skepticism into active capital approval. This return profile is superior to most manufacturing technology investments, which typically require 18–24 months to reach breakeven. For operators evaluating platform adoption, this data removes the primary financial objection and shifts the conversation from cost justification to vendor selection.
EV Manufacturing Complexity Demands Virtual Commissioning
The same 2024 study found that digital twin virtual commissioning reduced line setup time from 130 hours to 59 hours — a 55% reduction that directly compresses EV production launch schedules. As automakers face simultaneous pressure to launch new EV models faster and reduce capital spending on physical line builds, virtual commissioning transitions from a productivity tool to a competitive necessity. Suppliers that cannot offer digital twin-compatible components and documentation will increasingly find themselves excluded from EV program sourcing decisions.
OEM Cost Reduction Targets Fuel Digital Twin Investment
BMW Group projects production planning costs will fall by up to 30% through its Virtual Factory digital twin program, deployed across more than 30 sites as of June 2025. Cost reduction at this scale converts digital twin investment from a technology budget item into a strategic capital allocation that competes directly with physical plant investment. This signals that CFOs and COOs will increasingly evaluate digital twin platforms rather than CIOs — shifting procurement authority toward executives who prioritize measurable financial outcomes over technical specifications.
Trends
NVIDIA Omniverse Automotive Factory Digital Twin Rollout
In January 2025, NVIDIA announced new Omniverse generative AI models and Mega Factory digital twin blueprints — pre-built factory simulation frameworks that reduce rollout time from months to weeks for automotive manufacturing environments. This positions NVIDIA Omniverse as an infrastructure layer beneath existing PLM and simulation platforms rather than a direct replacement, giving hyperscaler-adjacent vendors structural influence over the digital twin stack at a layer that traditional PLM vendors do not currently occupy.
Closed-Loop Digital Twin Automotive Quality Control
A 2024 virtual commissioning study found that digital twin rollouts achieved production throughput of 42 units per hour versus 26 units per hour under manual commissioning — a 61.5% improvement only possible through continuous physical-to-digital feedback loops closing in real time. This closed-loop architecture represents the next maturity level beyond static simulation. The twin updates itself from live production data, making every future decision smarter. Automakers that reach this level gain a structural learning advantage that compounds over time.
AI-Driven Analytics Engines Reshape Automotive Twins
In September 2025, the FIA selected Siemens as its Official Digital Twin Sponsor — using Siemens NX and simulation tools to create high-fidelity race car digital twins for aerodynamic and safety simulation. Beyond motorsport, this signals a broader trend: AI-driven analytics engines are extending digital twin use cases from static design validation into real-time performance optimization across any vehicle operating environment. Vendors that embed physics-informed machine learning directly into their simulation modules will separate from those offering analytics as a bolt-on layer.
Automotive Digital Twin Market Key Companies Insights
The top 5 players — Siemens AG, Dassault Systèmes, IBM Corporation, GE Vernova, and Microsoft — collectively held 29% of market share in 2024, reflecting a fragmented competitive landscape where no single vendor dominates. Our forecast suggests this concentration will increase through 2027 as platform acquisition activity — illustrated by Siemens’ EUR 9.5 billion Altair purchase in March 2025 — consolidates simulation, AI, and cloud capabilities under fewer enterprise platform stacks, raising the barrier for mid-tier vendors.
Siemens AG leads the market through its Xcelerator platform, which spans PLM, simulation, MES, and now electromagnetic and mechanical simulation through the Altair integration. According to Siemens’ FY2025 annual results, Group revenue reached EUR 75.9 billion, with Digital Industries software revenue of EUR 6,174 million. The Altair acquisition is projected to contribute approximately USD 500 million in annual revenue in the mid-term — directly expanding Siemens’ addressable simulation market in automotive manufacturing.
Dassault Systèmes competes through 3DEXPERIENCE — its unified platform for virtual twin creation across vehicle design, manufacturing simulation, and supply chain modeling. According to Dassault’s FY2025 full-year results, total revenue reached EUR 6.24 billion, with software revenue of EUR 5,644.9 million — up 4% at constant currency, with Transportation & Mobility as a primary growth contributor.
PTC Inc. reported total revenue of USD 2,739 million in FY2025 — up 19% — anchored by Windchill PLM and Creo CAD, the primary digital thread tools embedded in automotive OEM design workflows globally. In 2024, Capgemini acquired Unity’s Digital Twin Professional Services business, creating one of the largest pools of enterprise Unity developers for real-time 3D automotive factory visualization. NVIDIA’s Automotive segment reached USD 1.69 billion in FY2025 — up 55% — driven by Omniverse factory digital twin adoption at BMW and Hyundai.
Key Companies
- Siemens AG
- Dassault Systèmes
- IBM Corporation
- General Electric (GE Vernova)
- Microsoft Corporation
- Bosch
- Capgemini
- Altair Engineering
- ANSYS
- Schneider Electric
- PTC Inc.
- Rockwell Automation
- SAP SE
- ABB
- NVIDIA
- Accenture
- Hexagon
- Hitachi
- dSPACE GmbH
- Applied Intuition
- Autodesk
- Oracle Corporation
Recent Development
- January 2026: NVIDIA’s Automotive segment reached a record USD 2.3 billion in full fiscal year 2026 (ended January 26, 2026), up 39% from FY2025, driven by NVIDIA DRIVE platform adoption and Omniverse factory digital twin rollouts across automotive manufacturing OEMs and Tier-1 suppliers including Mercedes-Benz, Bosch, and ZF Group.
- October 2025: Hyundai Motor Group announced an approximately USD 3 billion investment with NVIDIA to advance physical AI in Korea, deploying NVIDIA Omniverse Enterprise to create factory digital twins enabling precision control, hardware-in-the-loop validation, and virtual commissioning of automotive manufacturing environments.
- August 2025: Volkswagen Group extended its strategic partnership with Amazon Web Services for five years, with its Digital Production Platform live at 43 plants across Europe, North America, and South America — hosting more than 1,200 AI-driven applications including digital twin orchestration, predictive maintenance, and real-time quality inspection.
- June 2025: BMW Group scaled its NVIDIA Omniverse-based Virtual Factory digital twin across more than 30 production sites, with collision checks reduced from nearly 4 weeks to 3 days through automated virtual simulation and production planning costs projected to fall by up to 30% across the BMW Group network.
- June 2025: BMW Group confirmed plans to integrate more than 40 new or updated vehicles into its global production system by 2027, with all integrations planned first in the Virtual Factory digital twin before physical production begins.
- June 2025: Schaeffler AG entered a technology partnership with NVIDIA to develop digital twins using Omniverse, targeting integration of at least 50% of its more than 100 manufacturing plants by 2030.
- February 2025: Volkswagen Group and Dassault Systèmes announced a long-term partnership implementing 3DEXPERIENCE as Volkswagen Group’s primary engineering platform across Volkswagen, Audi, and Porsche brands, with virtual twins deployed to simulate and refine every aspect of vehicle development before physical production begins.
- December 2025: Siemens unveiled PAVE360 Automotive — a pre-integrated system-level digital twin software environment enabling automotive OEMs and suppliers to create full-vehicle software-defined vehicle digital twins with hardware-like simulation speeds, accelerating SDV software development and validation programs.
Market Scope
| Report Features | Description |
|---|---|
| Market Size Value in 2025 | USD 5.71 Billion |
| Revenue Forecast in 2034 | USD 117.04 Billion |
| Growth Rate | CAGR of 35.26% from 2025 to 2034 |
| Base Year | 2025 |
| Historic Period | 2020–2024 |
| Forecast Period | 2025–2034 |
| Segments Covered | By Application, By Vehicle Type, By Technology Type, By Component/Platform Layer, By Deployment Model, By End-User, By Business/Revenue Model, By Vehicle Lifecycle Phase, By Sustainability/ESG Function, By Cybersecurity Function |
| Regions Covered | North America, Europe, Asia-Pacific, Latin America, Middle East & Africa |
| Countries Covered | US, Canada, Germany, France, UK, Spain, Italy, China, Japan, South Korea, India, Australia, Brazil, Mexico, GCC, South Africa |
| Key Companies | Siemens AG, Dassault Systèmes, IBM Corporation, GE Vernova, Microsoft Corporation, Bosch, Capgemini, Altair Engineering, ANSYS, Schneider Electric, PTC Inc., Rockwell Automation, SAP SE, ABB, NVIDIA, Accenture, Hexagon, Hitachi, dSPACE GmbH, Applied Intuition, Autodesk, Oracle Corporation |
Data Sources & References
- Siemens AG — FY2025 Annual Financial Report: https://assets.new.siemens.com/siemens/assets/api/uuid:6f0a40f1-9119-4007-b012-5b973b42574d/Annual-Financial-Report-FY2025.pdf
- Siemens AG — FY2024 Fourth Quarter Results Press Release: https://press.siemens.com/global/en/pressrelease/strong-fourth-quarter-completes-successful-fiscal-2024
- Siemens — Altair Engineering Acquisition Closing: https://news.siemens.com/en-us/siemens-altair-engineering-closing/
- Siemens — PAVE360 Automotive Launch: https://news.siemens.com/en-us/siemens-pave360-automotive/
- Siemens — FIA Official Digital Twin Sponsor: https://news.siemens.com/en-us/siemens-fia-2025/
- Siemens & Arm — Digital Twin Solutions for AI-Defined Vehicles: https://blogs.sw.siemens.com/pave360/2025/06/04/siemens-and-arm-work-together-to-build-digital-twin-solutions-for-ai-defined-vehicles/
- Siemens Cre8Ventures & Thalia Design Automation Partnership: https://blogs.sw.siemens.com/cre8ventures/2024/08/28/thalias-collaboration-with-siemens-cre8ventures/
- Dassault Systèmes — FY2025 Full-Year Results: https://investor.3ds.com/news-releases/news-release-details/dassault-systemes-q4-revenue-growth-1-solid-operating-margin-and
- Dassault Systèmes & Volkswagen Group — 3DEXPERIENCE Partnership: https://www.3ds.com/newsroom/press-releases/dassault-systemes-and-volkswagen-group-implement-3dexperience-platform-optimize-vehicle-development
- PTC Inc. — FY2025 Full-Year Results: https://investor.ptc.com/resources/news/news-details/2025/PTC-ANNOUNCES-FOURTH-FISCAL-QUARTER-AND-FULL-FISCAL-YEAR-2025-RESULTS/default.aspx
- NVIDIA — FY2026 Full-Year Financial Results: http://nvidianews.nvidia.com/news/nvidia-announces-financial-results-for-fourth-quarter-and-fiscal-2026
- NVIDIA — FY2025 Full-Year Financial Results: http://nvidianews.nvidia.com/news/nvidia-announces-financial-results-for-fourth-quarter-and-fiscal-2025
- NVIDIA — Omniverse Generative Physical AI Expansion (January 2025): https://investor.nvidia.com/news/press-release-details/2025/NVIDIA-Expands-Omniverse-With-Generative-Physical-AI/default.aspx
- NVIDIA & Hyundai Motor Group — AI Factory Partnership: https://investor.nvidia.com/news/press-release-details/2025/NVIDIA-and-Hyundai-Motor-Group-Team-on-AI-Factory-to-Power-AI-Driven-Vehicles-Robots-and-Factories/default.aspx
- BMW Group — Virtual Factory Digital Twin Scale-Up: https://www.press.bmwgroup.com/global/article/detail/T0450699EN/bmw-group-scales-virtual-factory
- BMW Group — Virtual Factory & 2027 Production Integration Plans: https://www.visit-bmwgroup.com/en/bmw-group-scales-virtual-factory/
- Volkswagen Group & AWS — Digital Production Platform Partnership Extension: https://aws.amazon.com/solutions/case-studies/volkswagen-dpp-generativeai/
- Volkswagen — AI Energy Optimization & AWS Partnership (Reuters): https://www.reuters.com/business/autos-transportation/volkswagen-extends-amazon-cloud-partnership-save-costs-with-ai-2025-08-28/
- Schaeffler AG & NVIDIA — Digital Twin Partnership: https://www.schaeffler.com/en/media/press-releases/press-releases-detail.jsp?id=88103745
- Foxconn — AI Investment Plans (Reuters): https://www.reuters.com/business/autos-transportation/foxconn-spend-up-3-billion-year-ai-chair-sees-china-ev-shakeout-2025-11-20/
- ESR Groups Journal — EV Manufacturing Digital Twin Virtual Commissioning Study (2024): https://journal.esrgroups.org/jes/article/download/9037/6011/16391