Executive Summary
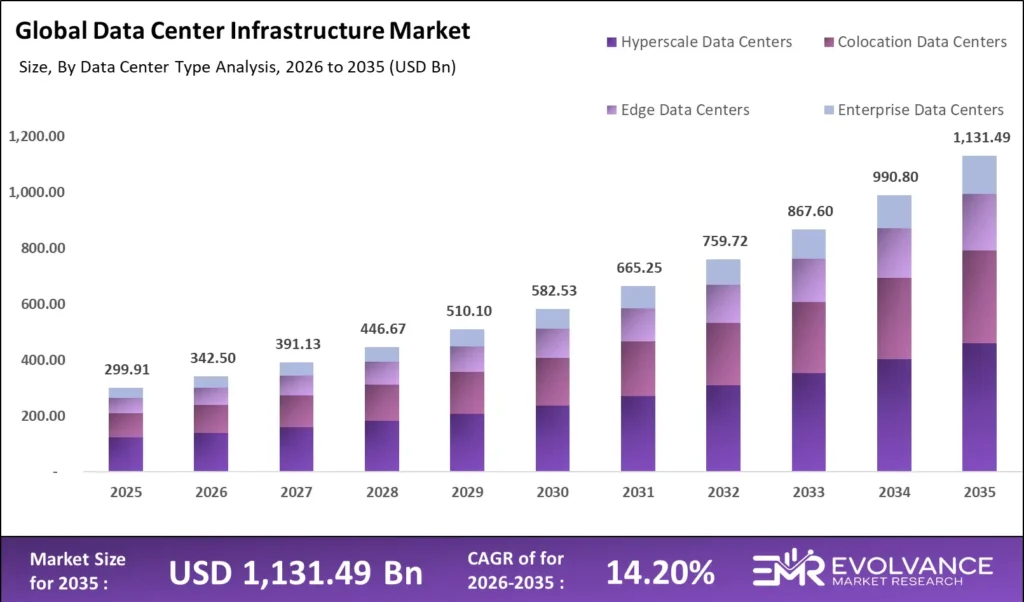
The global Data Center Infrastructure Market is valued at USD 342.5 billion in 2026 and is projected to reach USD 1,131.49 billion by 2035 at a CAGR of 14.2%. Growth is driven by AI workload proliferation, cloud migration, edge computing expansion, and digital transformation across BFSI, healthcare, manufacturing, and government. North America leads with 36% share; Asia-Pacific is the fastest-growing region at 16.8% CAGR. Sustainability, liquid cooling adoption, and hyperscale CapEx exceeding USD 300 billion annually define the strategic landscape through 2035.
What Is the Data Center Infrastructure Market?
The Data Center Infrastructure Market encompasses the full spectrum of physical, technological, and software components required to build, operate, and optimize modern data center facilities. Valued at USD 342.5 billion in 2026 and projected to reach USD 1,131.49 billion by 2035 at a CAGR of 14.2%, the market covers hardware, systems, and platforms enabling data storage, processing, networking, power distribution, cooling, security, and operational management. Infrastructure spans compute servers, storage systems, networking equipment, power and cooling infrastructure, physical security systems, and DCIM software — each layer experiencing distinct AI-driven and cloud-driven demand acceleration through the forecast horizon. The market serves enterprise, hyperscale, colocation, and edge deployment contexts across every major industry vertical, from BFSI and healthcare to manufacturing, retail, and government.
Market Highlights: Key Data at a Glance
| Metric | Value / Insight |
|---|---|
| Market Size (2026) | USD 342.5 billion |
| Forecast Size (2035) | USD 1,131.49 billion |
| CAGR (2026–2035) | 14.2% |
| North America Share (2026) | 36% |
| Largest Component Segment | Servers (38% market share, 2026) |
| Fastest Growing Component | Data Center Management Software (18.4% CAGR) |
| Dominant Deployment Model | Hybrid Cloud Infrastructure |
| Highest Tier Adoption Growth | Tier III & Tier IV Facilities |
| Fastest Growing Region | Asia-Pacific (16.8% CAGR, 2026–2035) |
| Fastest Growing Data Center Type | Hyperscale Data Centers (17.1% CAGR) |
| Fastest Growing End-User | Healthcare & Life Sciences |
| Key Technology Shift | Liquid Cooling & AI-Optimized Servers |
| Top Sustainability Metric | PUE Target below 1.2 |
| Leading Investment Region | North America (USD 125+ Bn CapEx, 2026) |
Data Center Infrastructure Market Overview
Global data creation is projected to approach 400 zettabytes by 2035. The infrastructure required to store, process, transmit, and analyze this data represents a generational investment opportunity across every geographic market. Enterprises across BFSI, healthcare, retail, government, and manufacturing are accelerating digital transformation roadmaps, with data center infrastructure serving as the foundational enabler for digital services delivery, AI model deployment, and real-time analytics at scale.
Growth Drivers Analysis
| Growth Driver | Key Data & Context | Market Impact | Scale / CAGR |
|---|---|---|---|
| AI & Machine Learning Workload Explosion | Frontier AI model training requires 1,000s of GPUs; hyperscalers committed USD 300B+ CapEx in 2025; AI facilities targeting 1 GW power capacity | Largest single demand catalyst; GPU-dense servers 5–10x ASP of conventional x86; reshaping server, cooling & power spec globally | AI server segment: 22.6% CAGR; Liquid Cooling: 26.8% CAGR |
| Cloud Migration & Hybrid Cloud Adoption | Hybrid cloud is dominant model (~42% of market 2026); platforms: Azure Arc, Google Anthos, AWS Outposts enabling on-prem/cloud unified management | Drives demand for networking equipment, interconnection services & SDI management platforms for both hyperscale and enterprise operators | Cloud infra market: USD 600B (2026) → USD 2.3T (2035) |
| 5G Rollout & Edge Computing Expansion | GSMA: 30%+ of enterprise 5G connections by 2030 require edge compute <10ms latency; supports AR, autonomous vehicles, industrial IoT | New tier of edge data center infrastructure; drives demand for compact, ruggedized, energy-efficient modular data center solutions at network periphery | Edge DC market: 21.3% CAGR — fastest-growing type 2026–2035 |
| Digital Transformation Across Industries | Healthcare: EHR, AI diagnostics, telemedicine; BFSI: HFT, fraud detection, regulatory analytics; Manufacturing: Industry 4.0, smart factory, OT/IT convergence | Sustained demand across all end-user verticals; healthcare fastest growing at 17.8% CAGR; BFSI requires Tier IV, ultra-low latency colocation | Healthcare DC end-user CAGR: 17.8%; BFSI: 21.3% market share |
| Data Sovereignty & Regulatory Requirements | GDPR (Europe), data localization mandates in India, China, Russia & 40+ markets; compels in-country infrastructure investment & local colocation | Drives construction of national data center facilities; prevents cross-border data flows; creates structural demand in regulated markets | MEA region CAGR: 18.2%; India: USD 40B+ hyperscaler commitments through 2030 |
Restraints Impact Analysis
High Capital Expenditure and Long Payback Periods
Data center development is capital-intensive, with greenfield hyperscale campuses requiring USD 1–5 billion per facility. Tier IV enterprise centers cost USD 10–25 million per MW. Long construction timelines of 18–36 months and 10-to-15-year payback periods require disciplined demand forecasting and long-term financial planning.
Power Grid Constraints and Energy Availability
Power availability is now the most critical constraint on data center development in established markets. Major hubs including Northern Virginia, Dublin, Amsterdam, and Singapore have faced moratoriums due to grid capacity limitations. Interconnection queues extending 3–5 years are forcing geographic diversification toward secondary markets.
Water Consumption and Environmental Concerns
Traditional evaporative cooling consumes millions of gallons of water daily at large campuses — a growing concern in water-stressed regions. Environmental opposition is delaying new projects and accelerating adoption of waterless cooling technologies, including air-side economizers and liquid cooling systems that eliminate evaporation.
Opportunities Analysis
| Opportunity | Market Size & Scale | Key Geographies / Players | Growth Rate / Horizon |
|---|---|---|---|
| Emerging Market Expansion | Sub-Saharan Africa, SEA, LATAM & Middle East show large unmet demand; Saudi Arabia, UAE, Nigeria, Indonesia, Vietnam & Brazil attracting substantial FDI | GCC (UAE, KSA), India, Indonesia, Nigeria, Brazil; supported by government incentive programs | MEA: 18.2% CAGR; SEA: 21%+ growth; LATAM: 15.6% CAGR through 2035 |
| Retrofit & Modernization of Legacy Infrastructure | ~60% of enterprise data centers predate 2010; approaching end of useful life; global modernization covers power upgrades, cooling refresh, SDN deployment & DCIM integration | North America & Europe (highest legacy DC concentration); Fortune 500 enterprises choosing between colocation migration or targeted in-place infrastructure refresh | Multi-hundred-billion-dollar addressable market; DC construction reaching USD 80B annually by 2028 |
| Green Data Center Solutions & Renewable Energy | RE100 signatories demand 100% renewable-powered colocation & cloud regions; corporate PPA market exceeded USD 25B in new contracts in 2025; green DCs command pricing premiums | Nordics (hydro power), US Sun Belt (solar), EU (wind PPAs); major operators: Equinix, Digital Realty, hyperscalers targeting net-zero by 2030–2040 | Renewable energy infra for DCs: 19.7% CAGR; green premium DCs: 5–12% pricing uplift |
| Liquid Cooling Infrastructure Market | Direct-to-chip, immersion & rear-door heat exchangers essential for AI GPU clusters >30 kW/rack; liquid cooling growing from USD 4.2B (2026) to USD 35B+ (2035) | North America & Asia-Pacific (hyperscale AI clusters); key vendors: Vertiv, Schneider Electric, Asetek, Submer, GRC, LiquidStack, CoolIT Systems | Liquid Cooling CAGR: 26.8% — highest-growth infra sub-segment through 2035 |
Emerging Trends Analysis
AI-Optimized Server Architectures
Modern server architecture is being redesigned around AI workloads. GPU-dense servers from NVIDIA, AMD, and Intel — with NVLink, PCIe 6.0, and CXL interconnects — are displacing CPU-centric configurations. Custom silicon from Google (TPUs), Amazon (Trainium), and Microsoft (Maia) is diversifying the hardware landscape and creating demand for specialized data center configurations.
Software-Defined Infrastructure and AIOps
The convergence of SDN, SDS, and AIOps is enabling unprecedented automation in data center management. Modern DCIM platforms use machine learning to predict failures, optimize cooling, automate capacity planning, and manage heterogeneous environments. AIOps-enabled facilities demonstrate 15–25% energy savings versus manually managed equivalents.
Modular and Prefabricated Data Center Designs
Modular data center solutions reduce deployment timelines from years to months, enable incremental scaling, and suit locations where traditional construction is impractical. The global modular data center market is growing at approximately 19% CAGR through 2035.
Nuclear and Alternative Energy Integration
AI data center power demands are catalyzing exploration of alternative energy sources. Small modular reactors (SMRs) are attracting investment from multiple hyperscale operators for carbon-free baseload power. Microsoft’s agreement with Constellation Energy to restart Three Mile Island is emblematic of the industry’s broader pursuit of dedicated clean power supplies.
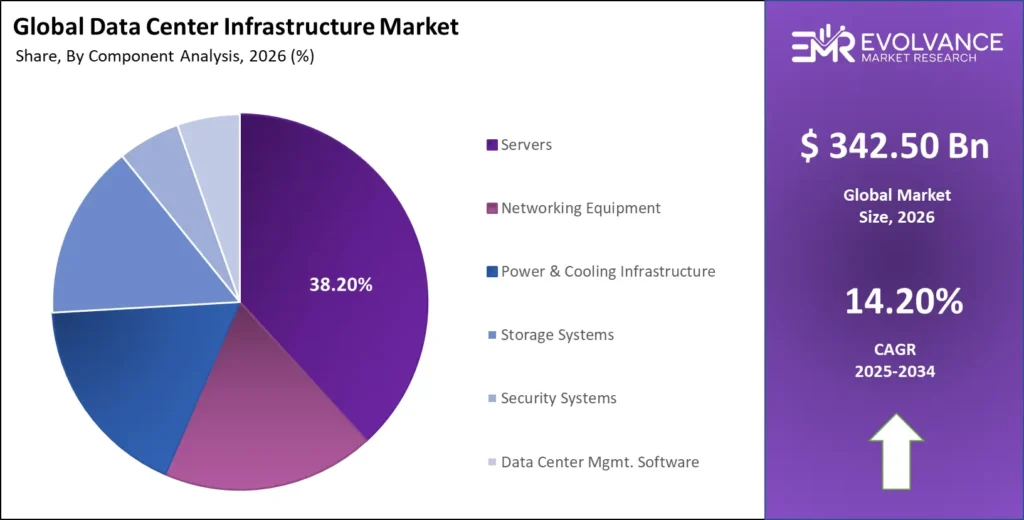
Component Analysis
The component landscape spans seven primary categories, each experiencing distinct growth dynamics driven by AI proliferation, cloud migration, and sustainability imperatives.
| Component | 2026 Revenue Estimate & CAGR |
|---|---|
| Servers | 38.2% share | USD 130.9 Bn (2026) | 13.8% CAGR |
| Storage Systems | 15.1% share | USD 51.7 Bn (2026) | 13.2% CAGR |
| Networking Equipment | 18.3% share | USD 62.6 Bn (2026) | 14.5% CAGR |
| Power & Cooling Infrastructure | 17.6% share | USD 60.3 Bn (2026) | 14.8% CAGR |
| Security Systems | 5.4% share | USD 18.5 Bn (2026) | 13.6% CAGR |
| Data Center Mgmt. Software | 5.4% share | USD 18.5 Bn (2026) | 18.4% CAGR |
Servers remain the dominant hardware component. The transition to AI-optimized platforms is reshaping architectures, with GPU-dense configurations commanding ASPs 5–10x conventional x86 servers. NVIDIA’s H100/B200, AMD’s Instinct accelerators, and custom hyperscaler silicon are driving step-change revenue intensity.
Networking Equipment is experiencing a technology inflection driven by AI cluster bandwidth demands requiring hundreds of Gbps of inter-node connectivity. This drives adoption of high-radix switches, InfiniBand HDR/NDR, and 400G/800G Ethernet fabrics. Spine-leaf architectures are replacing legacy three-tier designs.
Power and Cooling Infrastructure is the fastest-growing traditional hardware segment. Direct liquid cooling is expected to grow from USD 4.2 billion in 2026 to over USD 35 billion by 2035. AI-driven controls from Vertiv, Schneider Electric, Stulz, and Airedale dynamically optimize cooling based on real-time thermal maps.
Data Center Management Software is the highest-CAGR segment at 18.4%, driven by growing hybrid, multi-cloud, and AI-dense environment complexity. Vendors including Vertiv, Schneider Electric (EcoStruxure), Nlyte, and Sunbird are investing heavily in cloud-native architectures.
Deployment Model Analysis
Hybrid Cloud Infrastructure — Dominant Deployment Architecture
Hybrid cloud accounts for approximately 42% of the market in 2026, combining public cloud scalability with private infrastructure control and compliance assurance. Leading platforms — Microsoft Azure Arc, Google Anthos, AWS Outposts — provide unified control planes extending cloud management to on-premises infrastructure and enabling consistent workload portability.
Cloud Deployment — Hyperscale Growth Engine
Cloud deployment accounts for approximately 35% of the market in 2026. It is the primary destination for new AI training workloads and digital-native applications. Competition among AWS, Microsoft Azure, Google Cloud, Oracle Cloud, Alibaba, and Huawei Cloud is driving continuous capacity expansion and geographic diversification of cloud regions globally.
On-Premises Infrastructure — Resilient Enterprise Segment
On-premises infrastructure retains approximately 23% market share in 2026, driven by data sovereignty, ultra-low latency, regulatory compliance, and TCO optimization for predictable high-volume workloads. Defense, financial services, healthcare, and critical national infrastructure maintain substantial on-premises footprints requiring ongoing investment through the forecast period.
Tier Type Analysis
| Tier Classification | Characteristics & Market Position |
|---|---|
| Tier I — Basic Capacity | Single path for power/cooling. 99.671% uptime. Entry-level SME deployments. |
| Tier II — Redundant Components | Partial redundancy. 99.741% uptime. Growing SME and branch deployments. |
| Tier III — Concurrently Maintainable | Multiple paths; one active. 99.982% uptime. Dominant enterprise tier. |
| Tier IV — Fault Tolerant | Full redundancy, no single point of failure. 99.995% uptime. Mission-critical applications. |
Tier III facilities account for approximately 48% of the market in 2026, offering concurrent maintainability with 99.982% uptime — now the minimum threshold for enterprise-grade colocation. Migration from Tier I and II legacy infrastructure to Tier III is a key modernization driver globally. Tier IV adoption is growing fastest among financial services, healthcare, and government.
Data Center Type Analysis
Hyperscale Data Centers
Hyperscale data centers are the fastest-growing type at 17.1% CAGR through 2035. Typically exceeding 100,000 sq ft and 20 MW IT load, they are dominated by Amazon, Microsoft, Google, Meta, Apple, Alibaba, and ByteDance, whose combined annual CapEx surpassed USD 200 billion in 2025 and is expected to escalate substantially through 2035.
Colocation Data Centers
The global colocation market is estimated at approximately USD 85 billion in 2026, growing at 13.5% CAGR through 2035. Key operators including Equinix, Digital Realty, CyrusOne, Iron Mountain, and NTT Global Data Centers are expanding globally to meet enterprise demand for flexible, interconnected, and compliant colocation capacity.
Edge Data Centers
Edge data centers are projected to grow at 21.3% CAGR through 2035 — the fastest among all facility types. Deployment formats range from micro data centers to 500 kW–2 MW facilities deployed within telecom carrier hotels, industrial facilities, or street-level enclosures. 5G MEC, autonomous vehicles, and industrial IoT are the primary demand catalysts.
Enterprise Data Centers
Approximately 40% of Global Fortune 500 companies operate Tier III or IV enterprise data centers in 2026, driven by data sovereignty, application performance, and TCO optimization. Investment in enterprise modernization — power upgrades, cooling refreshes, DCIM deployments, and security enhancements — represents a multi-decade vendor opportunity.
End-User Industry Analysis
| End-User Industry | Market Share & Key Drivers |
|---|---|
| IT & Telecommunications | Largest segment — 28.4% share. Core infrastructure for cloud, CDN, telecom. |
| BFSI | 21.3% share. High regulatory requirements; demand for ultra-low latency & Tier IV. |
| Government & Defense | 12.6% share. Sovereign data mandates; classified cloud infrastructure. |
| Healthcare | 10.2% share; fastest growing at 17.8% CAGR. EHR, genomics, AI diagnostics. |
| Manufacturing | 8.4% share. Industry 4.0, smart factory, edge compute for OT/IT convergence. |
| Retail & E-Commerce | 7.1% share. Real-time analytics, omnichannel platforms, seasonal scaling. |
| Media & Entertainment | 5.8% share. Streaming infrastructure, rendering, content delivery. |
| Energy & Utilities | 3.6% share. Smart grid analytics, SCADA systems, IoT infrastructure. |
| Others | 2.6% share. Education, logistics, agriculture, research institutions. |
IT and Telecommunications dominates with 28.4% share, serving cloud, CDN, and telecom infrastructure. BFSI commands 21.3% requiring ultra-low latency and Tier IV reliability. Healthcare at 10.2% is the fastest-growing end-user at 17.8% CAGR, driven by EHR adoption, genomics platforms, and AI-assisted diagnostics requiring secure high-performance facilities.
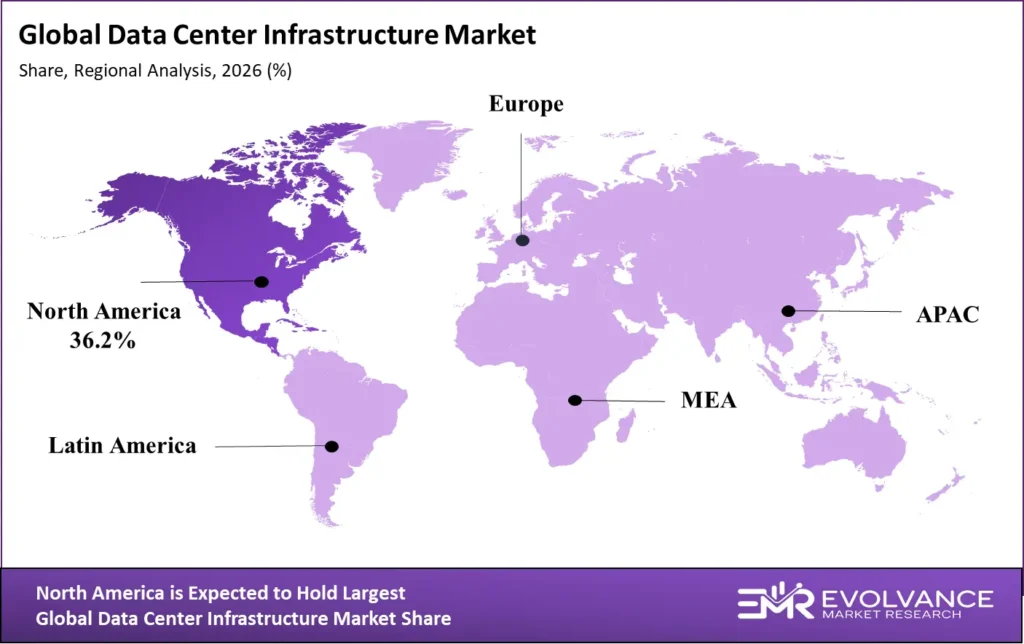
Regional Market Analysis
| Region | 2026 Market Share | 2035 CAGR | Key Demand Drivers |
|---|---|---|---|
| North America | 36.2% | 13.4% | Hyperscale CapEx, AI infrastructure, enterprise modernization |
| Asia-Pacific | 27.8% | 16.8% | Cloud adoption, 5G rollout, digital economy growth |
| Europe | 18.6% | 13.1% | GDPR compliance, green data center investment, sovereign cloud |
| Middle East & Africa | 8.4% | 18.2% | Smart city initiatives, government digitalization, FDI |
| Latin America | 5.1% | 15.6% | Cloud migration, e-commerce growth, financial inclusion |
| Rest of World | 3.9% | 12.8% | Emerging digital infrastructure, telecom upgrades |
North America leads with 36.2% revenue share in 2026, anchored by the US concentration of hyperscale cloud infrastructure. Northern Virginia remains the world’s largest data center market, though power constraints are driving diversification toward Texas, Georgia, and Phoenix. Canada offers power availability and cool climate advantages for natural air cooling.
Asia-Pacific is the fastest-growing region at 16.8% CAGR through 2035. China’s domestic hyperscalers — Alibaba, Tencent, Huawei, and ByteDance — drive investment. India is emerging as a top destination with USD 40 billion in announced hyperscaler investment through 2030. Singapore, Malaysia, Japan, South Korea, and Australia round out the mature market.
Europe’s market is shaped by GDPR-driven demand, the EU Green Deal, and national data sovereignty legislation. The Nordic countries attract hyperscale operations with hydroelectric power and industry-leading PUE ratios. Germany, the UK, France, the Netherlands, and the Nordics collectively account for approximately 75% of European market revenue.
The Middle East and Africa is the highest-growth emerging region at 18.2% CAGR through 2035. Saudi Arabia and UAE lead investment through Vision 2030 and UAE Centennial 2071 programs. Amazon, Microsoft, Google, Oracle, and Alibaba have all established GCC cloud regions. South Africa, Nigeria, Kenya, and Egypt are the primary African data center hubs.
Competitive Landscape
Market Structure and Competitive Intensity
Server and compute is led by Dell Technologies, HPE, Lenovo, Cisco, and Supermicro. Networking is dominated by Cisco, Arista, Juniper, and Broadcom. Power and cooling infrastructure is primarily served by Vertiv, Schneider Electric, Eaton, and ABB, each competing on efficiency ratings, modular designs, and integrated management software.
The colocation sector is led by Equinix, Digital Realty, NTT Global, CyrusOne, Compass, and Iron Mountain, alongside hundreds of regional providers. Hyperscale cloud providers operate at a distinct scale tier competing on service breadth, geographic coverage, AI portfolios, and pricing economics.
Strategic Differentiation Themes
Key differentiation themes include: AI infrastructure readiness for high-density GPU clusters; sustainability credentials including renewable energy sourcing and PUE performance; geographic coverage and interconnection ecosystems; software automation capabilities; and financial strength to sustain large-scale capital deployment. Organizations excelling across all five dimensions capture disproportionate share.
Key Company Profiles
Dell Technologies
Dell Technologies offers end-to-end infrastructure including PowerEdge servers, PowerStore and PowerMax storage systems, networking solutions, and converged infrastructure platforms. Dell’s AI-optimized PowerEdge XE series and NVIDIA-powered AI factory solutions position it at the center of the enterprise AI infrastructure investment cycle. Annual data center infrastructure revenue exceeds USD 30 billion, with strong presence across enterprise, colocation, and government sectors globally.
Hewlett Packard Enterprise (HPE)
HPE’s portfolio spans ProLiant servers, Alletra storage, Aruba networking, and the HPE GreenLake cloud services platform. GreenLake’s as-a-service model allows enterprises to consume on-premises infrastructure with cloud-like economics. HPE’s acquisition of Juniper Networks significantly strengthens its AI networking capabilities.
Schneider Electric
Schneider Electric leads in power management and cooling infrastructure through its EcoStruxure platform providing integrated DCIM, power, and cooling management. Its modular UPS systems, precision cooling, and prefabricated data center offerings serve deployments from micro edge to hyperscale. Schneider’s sustainability positioning resonates with customers holding carbon neutrality commitments.
Vertiv
Vertiv specializes in critical digital infrastructure — power, cooling, and software management systems — deployed across more than 130 countries. The company’s Liebert UPS systems, precision air conditioning, and Trellis DCIM software are widely deployed globally. Vertiv has made significant liquid cooling technology investments, positioning it as a key AI infrastructure partner.
Equinix
Equinix operates over 260 data centers across 70 metro areas globally, connecting over 10,000 customers within its Platform Equinix interconnection ecosystem. Its xScale joint venture with GIC and PGIM Real Estate provides access to hyperscale wholesale capacity, extending Equinix’s addressable market into the high-density AI infrastructure segment.
NVIDIA Corporation
NVIDIA is a pivotal data center ecosystem player through H100/B200 GPU platforms, NVLink switch systems, and InfiniBand networking. NVIDIA’s DGX SuperPOD architecture sets the AI training cluster standard. Infrastructure revenue grew from approximately USD 15 billion in fiscal 2023 to over USD 100 billion in fiscal 2025.
Investment and Funding Analysis
Global CapEx Trends
The top five hyperscale cloud providers collectively invested approximately USD 300 billion in 2025, with annual spend projected to exceed USD 500 billion by 2028. Private equity funds from Blackstone, KKR, Brookfield, DigitalBridge, and Macquarie have deployed tens of billions into data center assets, cementing the sector as an institutional infrastructure asset class. Gulf sovereign wealth funds including Mubadala, ADIA, and Saudi Arabia’s PIF have emerged as major global data center investors.
Venture Capital and Technology Investment
Venture capital funding for liquid cooling technology companies increased over 300% since 2022. Power semiconductor companies, energy storage developers, and DCIM software providers have attracted significant Series B and Series C funding through 2025–2026, reflecting investor recognition of the mandatory technology transitions driven by AI compute density.
Government and Sovereign Investment
The US CHIPS Act and Inflation Reduction Act provide indirect data center investment support through energy efficiency incentives. The EU’s IPCEI programs support European digital infrastructure development. Gulf sovereign wealth funds are major investors in global data center assets, while India and Southeast Asian governments offer direct incentive programs.
AI-Driven Data Center Infrastructure Analysis
AI Compute Density and Infrastructure Requirements
Training frontier AI Infrastructure models requires GPU clusters with extreme compute density, high-bandwidth memory, and ultra-low-latency networking. NVIDIA’s H100 SXM5 GPU consumes 700W and requires liquid cooling at maximum efficiency. A 1,024-GPU training cluster occupies approximately 64 racks, consumes 4 MW, and requires multi-hundred-gigabit per-node networking bandwidth.
AI for Data Center Operations Management
AI is transforming data center operations. ML models trained on sensor data predict cooling failures, optimize power distribution, right-size capacity allocations, and automate routine tasks. Google’s DeepMind AI reportedly achieved 30% cooling energy reduction — a compelling proof-of-concept now available through commercial DCIM platforms.
AI-Ready Data Center Design Standards
AI-ready data centers are emerging as a distinct design standard. Requirements include 30+ kW per rack power delivery, liquid cooling infrastructure for GPU-dense servers, 400G/800G networking fabric, robust physical security, and software orchestration for heterogeneous compute. Colocation operators are proactively incorporating AI-ready specifications into new facility designs.
Power and Energy Infrastructure Economics
Power Procurement Strategies
Leading operators combine utility grid power with corporate renewable PPAs, on-site generation, Renewable Energy Certificates, hydrogen fuel cells, and emerging SMR contracts. The global corporate PPA market for data center operators exceeded USD 25 billion in new contracts in 2025. Operators achieving 100% renewable coverage command commercial advantages with sustainability-committed enterprise customers.
Power Usage Effectiveness (PUE) Evolution
PUE remains the primary efficiency benchmark, improving from 1.98 in 2007 to approximately 1.45 in 2026. Hyperscale operators routinely achieve PUEs of 1.1–1.2 through free cooling economization, high-efficiency UPS, and direct liquid cooling. PUE below 1.2 has become the design target for all new hyperscale campuses and premium colocation facilities.
Data Center Sustainability and Green Infrastructure Framework
Sustainability Regulatory Framework
The EU Energy Efficiency Directive mandates that data centers above defined power thresholds annually report energy consumption, PUE, renewable energy utilization, and water usage metrics. The EU Taxonomy and CSRD reporting requirements are increasing the financial materiality of data center carbon intensity for publicly listed organizations.
Water Usage Effectiveness (WUE) and Water-Efficient Cooling
Water Usage Effectiveness (WUE) is gaining prominence alongside PUE as a primary sustainability benchmark. Traditional evaporative cooling can consume 3–5 liters per kWh of IT load in warm climates. Industry leaders are achieving near-zero WUE through closed-loop liquid cooling systems that eliminate evaporative water consumption entirely — simultaneously addressing both power efficiency and water conservation.
Circular Economy and Hardware Lifecycle Management
Circular economy principles are increasingly applied to data center hardware lifecycle management, encompassing responsible procurement, extended asset utilization, secure data destruction, and materials recovery from end-of-life equipment. Hyperscalers are investing in hardware refurbishment programs to extend server lifecycles, reducing capital costs and embodied carbon from hardware manufacturing.
Edge Data Center Expansion Analysis
The edge data center market is growing at 21.3% CAGR through 2035. Edge deployments address the fundamental latency limitation of centralized cloud, positioning compute and storage resources within milliseconds of applications and users.
5G is the primary edge catalyst. The GSMA projects over 30% of enterprise 5G connections by 2030 will rely on edge computing infrastructure to meet application latency requirements below 10 milliseconds. Industrial edge deployments serve manufacturing plants, oil and gas, utilities, and transportation infrastructure with ruggedized hardware requirements requiring specialized cybersecurity frameworks including IEC 62443 compliance.
Modular and micro data center solutions are the dominant edge architecture, offering self-contained units with integrated power, cooling, security, and management deployable in weeks. Leading vendors include Dell, HPE, Schneider Electric, Vertiv, Eaton, and specialized edge solution providers.
Hyperscaler CapEx and Capacity Expansion Analysis
Announced CapEx Commitments
Microsoft announced USD 80B infrastructure CapEx for FY2025; AWS committed USD 150B+ through 2028; Alphabet committed USD 75B for 2025 alone; Meta announced USD 60–65B in AI infrastructure for 2025. These commitments collectively represent an infrastructure investment cycle with no historical parallel, driven primarily by AI compute capacity requirements.
Geographic Diversification of Hyperscale Capacity
Hyperscale development is diversifying beyond Tier 1 markets due to power constraints and data sovereignty requirements. Emerging destinations include Texas, Georgia, Ohio, and Indiana in the US; Poland, Spain, and Greece in Europe; Malaysia, Thailand, and India in Asia; and Saudi Arabia, Qatar, and the UAE in the Middle East.
Liquid Cooling Infrastructure Analysis
Cooling Technology Taxonomy
Liquid cooling encompasses direct-to-chip cooling routing coolant pipes to CPU/GPU heat sinks; rear-door heat exchangers capturing server exhaust; and full immersion cooling submerging servers in dielectric fluid. Each approach offers distinct tradeoffs between retrofit compatibility, cooling efficiency, infrastructure complexity, and total cost of ownership.
Liquid Cooling Market Projections
The data center liquid cooling market will grow from USD 4.2 billion in 2026 to over USD 35 billion by 2035 at approximately 26.8% CAGR. Major vendors including Vertiv, Schneider Electric, Asetek, Submer Technologies, GRC, LiquidStack, and CoolIT Systems are expanding production capacities to meet hyperscale AI cluster demand.
Data Center Infrastructure ROI Framework
| Investment Category | Financial Impact / ROI Metrics |
|---|---|
| PUE Optimization from 1.6 to 1.2 | 20–25% energy cost reduction; USD 3–5M annual savings per 10 MW facility |
| Liquid Cooling Adoption | USD 2–4M CapEx premium per MW; recoverable in 3–5 years via energy savings |
| DCIM Software Implementation | USD 500K–2M; typical ROI 18–24 months via efficiency gains |
| Modular vs. Traditional Build | 15–20% lower CapEx; 40–50% faster time-to-revenue |
| Renewable Energy PPA | 3–7% energy cost reduction; Scope 2 emissions elimination for 10–15 yr term |
| Colocation vs. Owned DC | Break-even favors colocation for <5 MW; owned favored for >20 MW stable load |
Financial modeling for AI infrastructure must account for accelerating hardware obsolescence cycles of 18–24 months driven by rapid GPU platform advancement. Infrastructure designed with flexible power delivery, scalable cooling, and hardware-agnostic structural specifications supports multiple compute generations, significantly improving long-term capital efficiency.
Future Outlook: Data Center Infrastructure Market 2026–2035
Near-Term Outlook (2026–2028)
Through 2028, intense CapEx execution by hyperscalers racing to deploy AI training infrastructure will drive power bottlenecks and geographic diversification of data center development. Supply chain investments in power transformers, UPS systems, cooling infrastructure, and high-density networking will command premium vendor margins as demand outpaces production capacity.
Mid-Term Outlook (2028–2031)
By 2028–2031, AI inference at commercial scale will emerge as a primary infrastructure demand driver, potentially exceeding training infrastructure in aggregate power consumption. Liquid cooling will have progressed to mainstream implementation, and renewable energy supply chains for data center markets will have substantially expanded globally.
Long-Term Outlook (2031–2035)
The 2031–2035 period will see maturation of AI-native architectures, potential commercial SMR deployment for data center power, and full mainstreaming of immersion cooling. Quantum computing will begin entering production environments in specialized applications. Geographic investment gravity will continue shifting toward Asia-Pacific, the Middle East, and Africa.
Recent Developments (2025–2026)
| Organization | Development / Announcement |
|---|---|
| Microsoft | Announced USD 80B data center CapEx for FY2025; launched Azure AI infrastructure expansion across 60+ regions. |
| Amazon Web Services | Committed USD 150B+ through 2028; AWS Trainium 2 chips deployed in new AI clusters in Virginia, Ohio, and Ireland. |
| Google Cloud | Expanded Cooling Innovation Lab; deployed first commercial immersion-cooled TPU pods; announced 12 new cloud regions. |
| NVIDIA | Launched Blackwell B200 GPU platform; DGX B200 systems deployed at multiple hyperscale customers with NVLink Switch integration. |
| Equinix | Raised USD 15B for xScale colocation expansion; opened new AI-ready campuses in Dallas, Sydney, and Frankfurt. |
| Schneider Electric | Launched EcoStruxure AI Advisor platform; partnered with NVIDIA for AI-optimized modular data center designs. |
| Vertiv | Expanded liquid cooling manufacturing capacity by 300%; secured multi-year supply agreements with hyperscale operators. |
| Saudi Aramco / NEOM | Announced USD 5B national data center infrastructure program; selected three hyperscale partners for cloud regions. |
| Digital Realty | Completed USD 7B joint venture with Blackstone for hyperscale development in North America and Europe. |
| Meta | Deployed first 1 GW AI data center campus in Louisiana; pioneered innovative direct-air cooling for climate-zone optimization. |
AI Data Center Adoption Heatmap
| Region | Investment Intensity | Growth Potential | Key AI Infrastructure Driver |
|---|---|---|---|
| North America | ⬤⬤⬤⬤⬤ | ↑↑↑↑ | Hyperscale AI clusters; USD 300B+ CapEx 2025–2028 |
| Europe | ⬤⬤⬤⬤ | ↑↑↑ | Green AI infrastructure; GDPR-compliant sovereign cloud |
| China | ⬤⬤⬤⬤⬤ | ↑↑↑↑↑ | State-backed AI; domestic hyperscaler rapid buildout |
| India | ⬤⬤⬤ | ↑↑↑↑↑ | USD 40B+ hyperscaler commitments; digital public infra |
| GCC | ⬤⬤⬤ | ↑↑↑↑↑ | Vision 2030 smart city AI; sovereign wealth-backed cloud |
| Southeast Asia | ⬤⬤ | ↑↑↑↑↑ | Digital economy boom; Indonesia, Vietnam, Thailand FDI surge |
North America and China lead on current investment intensity, commanding maximum scores driven by hyperscaler CapEx dominance and state-backed AI mandates respectively. India, GCC, and Southeast Asia score highest on growth potential, reflecting early-stage adoption curves and large unmet infrastructure demand — positioning these three as the highest-return frontier markets through 2035.
Market Opportunity Matrix
| Segment | CAGR | Growth | Investment | Opportunity Signal |
|---|---|---|---|---|
| Hyperscale Data Centers | 17.1% | ★★★★★ | ★★★★★ | AI workload surge; USD 500B+ CapEx by 2028 |
| Liquid Cooling | 26.8% | ★★★★★ | ★★★★ | Mandatory AI GPU density adoption; USD 35B by 2035 |
| Edge Data Centers | 21.3% | ★★★★★ | ★★★ | 5G MEC, autonomous systems, industrial IoT latency |
| DCIM Software | 18.4% | ★★★★★ | ★★★ | AIOps automation; hybrid complexity drives platform need |
| AI Servers | 22.6% | ★★★★★ | ★★★★★ | NVIDIA/AMD GPU cycles; custom ASIC platform growth |
| Renewable Energy Infra | 19.7% | ★★★★ | ★★★★★ | RE100 mandates; USD 25B+ PPA market; ESG pressure |
Case Study – Microsoft AI Data Center Infrastructure Expansion
Microsoft’s AI-driven infrastructure expansion represents the most ambitious hyperscale buildout in data center history, anchored by its multi-year commitment to OpenAI and the commercial deployment of Azure AI services at global scale. In FY2025, Microsoft committed USD 80 billion in data center CapEx, with over 50% directed toward US-based AI-optimized facilities. The company is now deploying liquid-cooled AI clusters across more than 60 Azure regions, prioritizing markets with available clean energy supply to meet its carbon-negative 2030 commitment.
| Parameter | Details |
|---|---|
| Total CapEx Commitment | USD 80 billion in FY2025; USD 150B+ projected through 2027 across 60+ Azure regions globally |
| AI Infrastructure Focus | GPU-dense clusters (NVIDIA H100/B200); liquid-cooled AI pods; dedicated OpenAI training infrastructure |
| Key Geographies | USA (Virginia, Texas, Iowa), UK, Sweden, India, UAE, Poland, Japan — 60+ active Azure regions |
| Power Strategy | Constellation Energy nuclear restart (Three Mile Island); 100% renewable target by 2025; SMR investment commitments |
| Cooling Technology | Direct liquid cooling for all new AI clusters; PUE target below 1.15; waterless cooling deployment in water-stressed regions |
| Sustainability Target | Carbon-negative by 2030; water-positive by 2030; zero-waste certification across all campuses by 2030 |
| Key Market Signal | Sets global benchmark for AI-ready data center design; accelerates liquid cooling and renewable energy adoption industry-wide |
Case Study – India Data Center Infrastructure Growth & Investment Landscape
India is the world’s fastest-growing major data center market, underpinned by a digital economy surpassing USD 1 trillion by 2026, a 900-million-strong internet user base, and a government-led push toward cloud-first public services under the Digital India program. Global hyperscalers have collectively announced over USD 40 billion in data center investment through 2030. The market is expected to grow from approximately USD 8.4 billion in 2026 to USD 32 billion by 2035 at a CAGR of 16.1%.
| Parameter | Details |
|---|---|
| Market Size (2026) | USD 8.4 billion; forecast USD 32 billion by 2035 | CAGR: 16.1% |
| Hyperscaler Investment | USD 40B+ committed through 2030: AWS USD 13.2B, Google USD 10B, Microsoft USD 3B+, Meta USD 2B+ |
| Primary Hubs | Mumbai (largest), Chennai, Hyderabad, Pune, Delhi NCR — 5 tier-1 data center corridors |
| Demand Drivers | Digital India program; UPI fintech ecosystem; 900M+ internet users; AI adoption in BFSI, healthcare & retail; data localization policy |
| Key Domestic Operators | Adani Enterprises, NTT India, CtrlS, Reliance Jio, Nxtra (Airtel), Web Werks, STT GDC India |
| Policy Support | National Data Center Policy 2020; infrastructure status for DCs; state-level incentives in Maharashtra, Telangana, Tamil Nadu |
| Key Market Signal | Highest-growth large national market globally; convergence of sovereign policy, hyperscaler CapEx & domestic digital demand creates structural long-term opportunity |
Report Features
| Report Attribute | Details |
|---|---|
| Report Title | Global Data Center Infrastructure Market Size, Share, Growth Trends and Forecast 2026–2035 |
| Base Year | 2025 |
| Forecast Period | 2026–2035 |
| Market Size (2026) | USD 342.5 Billion |
| Market Size (2035) | USD 1,131.49 Billion |
| CAGR | 14.2% (2026–2035) |
| Segments Covered | Component, Deployment, Tier Type, Data Center Type, End-User Industry |
| Regions Covered | North America, Europe, Asia-Pacific, Middle East & Africa, Latin America, Rest of World |
| Countries Analyzed | 20+ countries with detailed analysis; 190+ in scope |
| Companies Profiled | 25+ leading market participants |
| Data Sources | Primary interviews, company financials, government databases, industry associations |
| License Type | Single User | Multi-User | Enterprise License |