Executive Summary
Quick Insight: The global AI Infrastructure market is on track to expand more than 6× by 2035, driven by accelerating hyperscaler capital expenditure, sovereign AI investment programs, next-generation GPU and custom silicon deployment, and the rapid scaling of large language model training and inference workloads across every major industry vertical.
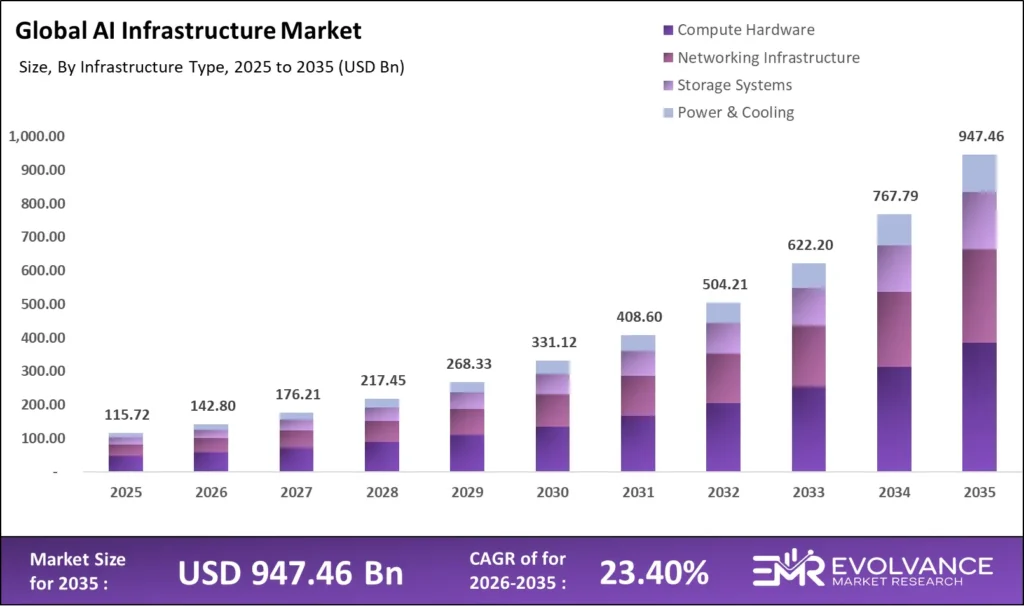
The global Artificial Intelligence Infrastructure market encompasses hardware, software platforms, networking fabric, power systems, and managed services enabling AI model development, training, and inference at scale. This report delivers a comprehensive analysis of market size, deployment economics, technology stack dynamics, and competitive positioning for the 2026–2035 forecast period, covering GPU supply chains, hyperscaler capital expenditure, and sovereign AI data center programs reshaping enterprise computing globally.
Key findings: The market reaches USD 142.8 billion in 2026 and compounds at 23.4% CAGR to USD 947.46 billion by 2035. Compute hardware commands 51.7% of total infrastructure spend. Cloud deployment leads with 44.2% revenue share. NVIDIA holds an estimated 78% share of AI training GPU shipments in 2026. Three new sections — Power & Sustainability Economics, Sovereign AI Data Center Investment Framework, and Enterprise AI Infrastructure ROI Framework — provide intelligence not available in comparable market reports.
What Is the AI Infrastructure Market?
The global AI Infrastructure market was valued at USD 142.8 billion in 2026 and is projected to reach approximately USD 947.46 billion by 2035, growing at a CAGR of 23.4% during the forecast period. The accelerating deployment of generative AI by enterprises, governments, and hyperscalers is the primary structural demand driver. AWS, Microsoft Azure, Google Cloud, and Oracle collectively committed more than USD 320 billion in capital expenditure for AI-capable data centers and accelerated compute clusters in fiscal year 2025, representing the largest single-year infrastructure investment cycle in the history of the technology industry.
The market encompasses GPU and AI accelerator hardware, AI-optimized servers, high-bandwidth networking, data center power and cooling systems, AI cloud platforms, MLOps software, and managed AI infrastructure services. It excludes standalone AI application software where infrastructure cost is not separately purchased or tracked.
U.S. AI Infrastructure Analysis
The U.S. AI Infrastructure market was valued at USD 38.21 billion in 2025 and is projected to reach approximately USD 272.32 billion by 2035, growing at a CAGR of 21.70%. The United States leads the global AI infrastructure landscape, driven by the highest concentration of hyperscaler capital expenditure, advanced semiconductor manufacturing initiatives, and large-scale enterprise AI deployment. The country continues to set the pace for innovation and capacity expansion across compute, storage, and networking infrastructure.
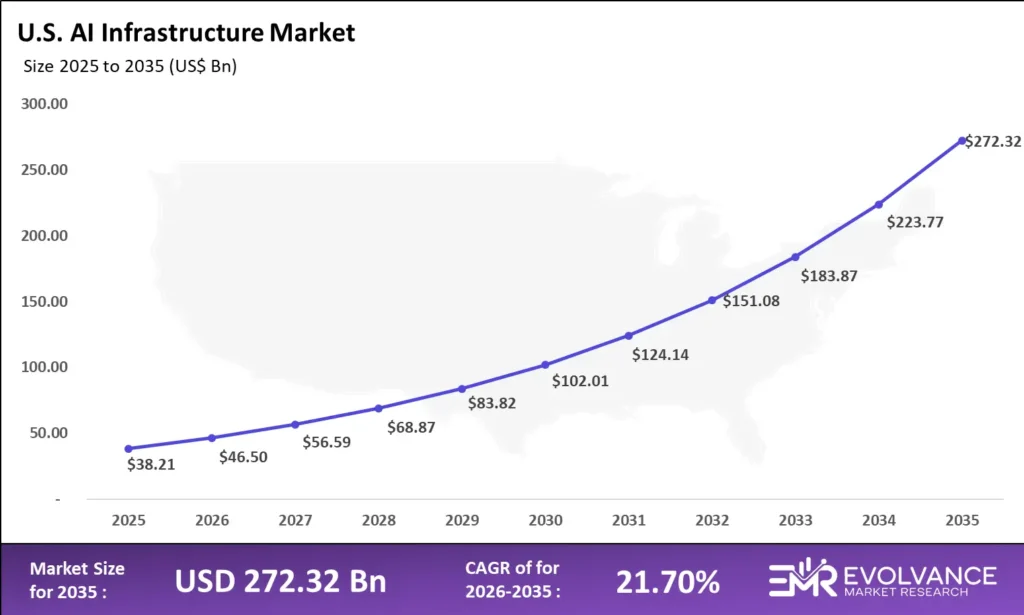
Hyperscalers—including Amazon, Microsoft, Google, Meta, and Oracle—are aggressively expanding AI-focused data centers, with the majority of their capital investment now directed toward GPU clusters, high-performance computing, and AI-optimized cloud regions. This surge is supported by strong demand from generative AI workloads, enterprise automation, and foundation model training.
AI Infrastructure Market Highlights: Key Data at a Glance
- Market value: USD 142.8 billion in 2026, forecast to USD 947.46 billion by 2035 at 23.4% CAGR
- Dominant component: Compute Hardware with 51.7% revenue share
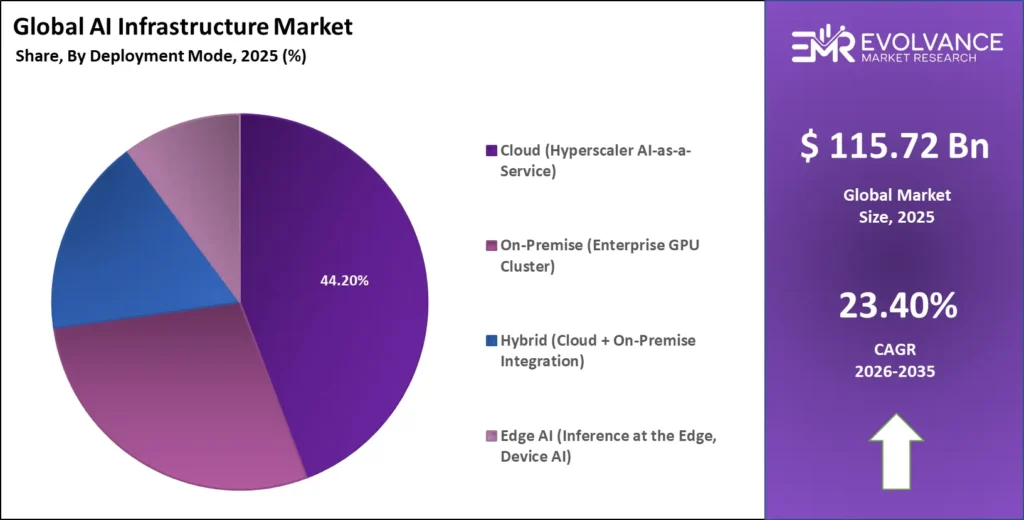
- Dominant deployment mode: Cloud with 44.2% infrastructure revenue share
- Fastest-growing deployment: Edge AI infrastructure at 38.6% CAGR through 2035
- Dominant end-use industry: BFSI and Technology sectors with 36.8% combined share
- Leading AI chip vendor: NVIDIA with ~78% AI training GPU market share in 2026
- Hyperscaler CapEx 2025: USD 320 billion+ committed across AWS, Azure, Google Cloud, Oracle
- Sovereign AI programs: 47 national governments with active AI infrastructure investment mandates
- Top infrastructure market: United States with 38.4% of global AI infrastructure spend
- Power demand: AI data centers projected to consume 8.5% of U.S. electricity by 2030
Market Overview: Why AI Infrastructure Growth Is Accelerating
The AI Infrastructure market is at an inflection point defined by three simultaneous demand accelerators. The first is the generative AI application explosion: enterprise adoption of large language models for code generation, document intelligence, customer service automation, and scientific research has converted previously discretionary AI compute into business-critical infrastructure. A Fortune 500 company running internal LLM applications for legal review, supply chain optimization, and customer analytics requires persistent GPU cluster access creating recurring infrastructure demand equivalent to cloud database or networking spend.
The second accelerator is the hyperscaler arms race in AI compute capacity. Microsoft, Google, Amazon, and Meta are simultaneously competing for AI workload market share, pulling forward infrastructure demand by three to five years versus organic enterprise adoption curves. Google DeepMind’s Gemini Ultra training required an estimated 50,000 TPUv4 chips running for six months, with each successive model generation demanding exponentially more compute.
The third accelerator is sovereign AI investment. Forty-seven national governments have announced or are executing national AI infrastructure programs as of 2026, recognizing AI compute as a strategic national resource comparable to energy reserves or semiconductor capacity. The EU’s AI Factories initiative, Saudi Arabia’s Project Transcendence, Japan’s AI Computing Initiative, and India’s IndiaAI Mission represent more than USD 84 billion in committed public AI infrastructure investment through 2030, generating demand entirely independent of commercial enterprise adoption cycles.
Component Analysis
Compute Hardware Commands 51.7% of AI Infrastructure Spend
GPU, AI Chip, and Accelerated Server Markets Drive the Dominant Infrastructure Revenue Category
| Component | Share % | Primary Driver |
|---|---|---|
| Compute Hardware (GPUs, TPUs, AI Chips, Servers) | 51.7% | LLM training, inference cluster build-out, hyperscaler CapEx cycles |
| Networking Infrastructure (InfiniBand, Ethernet Fabric) | 17.4% | High-bandwidth GPU cluster interconnect, data center fabric upgrades |
| Storage Systems (NVMe, Object Storage, Memory Expansion) | 12.8% | Training dataset management, model checkpoint storage, inference caching |
| AI Software Platforms (MLOps, LLM Frameworks, Orchestration) | 11.3% | Enterprise AI platform standardization, model lifecycle management |
| Power & Cooling Systems (Liquid Cooling, UPS, PDU) | 6.8% | AI data center power density increases, sustainability compliance requirements |
Compute Hardware holds a 51.7% component revenue share in 2026, making accelerated computing the central economic driver of the AI Infrastructure market. NVIDIA’s H100 and H200 Hopper GPU architecture dominates AI training workloads, shipping an estimated 3.76 million AI accelerator units globally in 2025, up from 1.32 million in 2023. The Blackwell B200 and GB200 NVLink architectures entered volume production in late 2025, delivering 2.5× the performance of H100 at equivalent rack power density and accelerating enterprise infrastructure upgrade cycles ahead of the 2026–2028 peak deployment window.
Networking infrastructure is expanding at 31.2% annually as scaling GPU clusters beyond 1,000 accelerators requires specialized high-bandwidth interconnect. NVIDIA’s InfiniBand NDR at 400 Gb/s remains the dominant solution for hyperscaler AI cluster networking, while Broadcom’s ASIC networking powers Google’s TPU Pod infrastructure. The shift toward 400G and 800G spine-leaf fabric architectures generates a multi-year upgrade cycle estimated at USD 24.8 billion in 2026 alone.
AI Software Platforms — including MLOps orchestration, LLM fine-tuning frameworks, and AI observability tools — represent the highest-growth software segment within AI infrastructure. Databricks’ valuation surpassed USD 62 billion in its 2025 funding round, with the software layer expanding at 28.7% annually as enterprises standardize AI development workflows across multi-cloud GPU environments.
Deployment Mode Analysis
Cloud Leads with 44.2% Share; Edge AI Is the Fastest-Growing Deployment Mode
Hyperscaler AI Cloud, On-Premise GPU Clusters, Hybrid Architecture, and Edge AI Inference — Deployment Economics Breakdown
| Deployment Mode | Share % | CAGR | Primary Driver |
|---|---|---|---|
| Cloud (Hyperscaler AI) | 44.2% | 19.8% | AWS, Azure, Google Cloud, Oracle AI infrastructure-as-a-service |
| On-Premise (Enterprise GPU Cluster) | 28.6% | 21.4% | Data sovereignty, latency control, regulated industry compliance |
| Hybrid (Cloud + On-Premise) | 17.9% | 26.2% | Workload portability, CapEx-OpEx optimization, burst compute needs |
| Edge AI (Inference at the Edge) | 9.3% | 38.6% | Autonomous systems, real-time manufacturing, 5G network intelligence |
Cloud deployment holds a 44.2% share of AI infrastructure revenue in 2026 as hyperscalers offer enterprises the fastest path to GPU capacity without capital expenditure commitments. AWS’s P5 instances, Azure’s ND H100 v5, and Google Cloud’s A3 Ultra instances collectively represent more than USD 58 billion in annualized AI cloud revenue as of Q1 2026. Oracle Cloud Infrastructure has emerged as a significant challenger through aggressive GPU cluster pricing and dedicated bare-metal architectures, winning AI workloads from Cohere, xAI, and multiple sovereign AI programs unavailable through competing cloud providers.
Edge AI is the fastest-growing deployment mode, expanding at 38.6% CAGR through 2035. NVIDIA’s Jetson Orin and IGX platforms power autonomous robotics, smart manufacturing inspection, and real-time surgical imaging. Qualcomm’s AI 100 Ultra chips enable on-device inference across 5G base stations without cloud round-trips. The installed base of edge AI accelerator devices is projected to reach 2.4 billion units globally by 2030, generating an estimated USD 89 billion in annual edge AI infrastructure revenue.
AI Technology Stack Analysis: GPUs, Custom Silicon & LLM Platforms
NVIDIA GPU Dominance, Custom AI Chip Emergence, and LLM Platform Standardization Define the 2026–2035 Stack
| Technology Layer | Key Vendors | 2026 Revenue Share | Key Trend |
|---|---|---|---|
| Training GPUs (H100/H200/B200) | NVIDIA (78%), AMD (MI300X) | 38.4% | Blackwell ramp accelerating hyperscaler cluster refresh |
| Custom AI ASICs (TPUs, Trainium, Inferentia) | Google, AWS, Microsoft, Apple | 14.2% | Hyperscaler vertical integration reducing NVIDIA dependency |
| AI Inference Chips (A100/L40S/AMD MI300) | NVIDIA, AMD, Intel Gaudi | 16.8% | Inference demand growing 3x faster than training compute |
| LLM Platform & MLOps Software | Databricks, HuggingFace, Weights & Biases | 11.3% | Enterprise platform consolidation accelerating |
| High-Speed Networking (InfiniBand/Ethernet) | NVIDIA, Broadcom, Arista | 12.8% | 800G adoption accelerating in hyperscaler AI fabrics |
| Power & Cooling (Liquid Immersion) | Vertiv, Schneider, Coolit | 6.5% | Liquid cooling mandatory above 100kW rack density |
NVIDIA’s dominance across the AI training GPU market is reinforced by its CUDA software ecosystem, representing more than a decade of developer tooling and library optimization that AMD, Intel, and custom silicon vendors cannot replicate quickly. More than 4.5 million developers actively write CUDA code globally as of 2026, sustaining NVIDIA’s hardware pricing power even as performance parity narrows with AMD’s MI300X. The Blackwell B200 NVL72 rack-scale system delivers 1.4 exaflops of FP8 AI compute in a single 72-GPU rack — a density level that requires liquid cooling infrastructure and fundamentally changes data center design requirements.
Custom AI silicon is a strategic priority for hyperscalers seeking cost reduction and supply chain independence. Google’s TPUv5 delivers 2× the training performance of TPUv4. Amazon’s Trainium2 offers up to 4× better price-performance for transformer model training. Microsoft’s Azure Maia AI Accelerator entered deployment in 2025, and these programs will collectively compress NVIDIA’s share from 78% toward an estimated 58% to 64% by 2030.
End-Use Industry Analysis
BFSI, Technology & Healthcare Command Combined 54.1% of AI Infrastructure Demand
Sector-by-Sector AI Infrastructure Spend Benchmarks and Use Case Drivers for 2026
| End-Use Industry | Revenue Share % | Avg. Annual AI Infra Spend | Top Use Case |
|---|---|---|---|
| BFSI (Banking, Financial Services, Insurance) | 22.4% | USD 31.8M per enterprise | Fraud detection, algorithmic trading, credit risk LLMs |
| Technology & Software | 19.6% | USD 84.2M per company | LLM development, AI product embedding, MLOps platforms |
| Healthcare & Life Sciences | 12.1% | USD 18.4M per organization | Medical imaging AI, drug discovery, clinical NLP |
| Government & Defense | 10.8% | USD 42.7M per agency | Intelligence analysis, autonomous defense, digital government |
| Retail & E-Commerce | 9.4% | USD 12.6M per enterprise | Personalization engines, demand forecasting, visual search |
| Manufacturing & Industrial | 8.7% | USD 14.2M per facility | Predictive maintenance, quality inspection, robotics AI |
| Telecommunications | 7.3% | USD 22.1M per operator | Network optimization, customer AI, 5G radio intelligence |
| Energy & Utilities | 5.6% | USD 16.8M per company | Grid optimization, predictive maintenance, emissions modeling |
| Education & Research | 4.1% | USD 8.4M per institution | LLM-powered tutoring, research compute, scientific simulation |
BFSI holds the largest end-use AI infrastructure revenue share at 22.4% in 2026. Financial institutions deploy AI infrastructure across three distinct tiers. Real-time fraud detection systems process more than 500 billion transactions annually on on-premise GPU clusters requiring sub-10 millisecond latency. Algorithmic trading infrastructure at tier-one investment banks operates dedicated FPGA and ASIC systems for sub-microsecond order execution. Regulatory compliance LLMs — deployed for KYC document processing, AML alert triage, and Basel IV capital calculation — represent the fastest-growing BFSI use case, with spend expanding at 34.7% annually through 2030.
Healthcare and Life Sciences AI infrastructure is growing at 31.6% CAGR, driven by FDA breakthrough designation of AI-powered diagnostic tools and computational biology workloads for drug discovery. NVIDIA’s Clara platform and Google DeepMind’s AlphaFold3 have created dedicated GPU demand from pharmaceutical companies running structure prediction and molecular dynamics simulation, while HIPAA data residency requirements sustain durable on-premise GPU cluster demand independent of hyperscaler cloud cycles.
Regional Analysis of the Global AI Infrastructure Market
United States Leads Global AI Infrastructure Investment; Asia-Pacific Is the Fastest-Growing Region
| Region | Share % | CAGR | Key Driver |
|---|---|---|---|
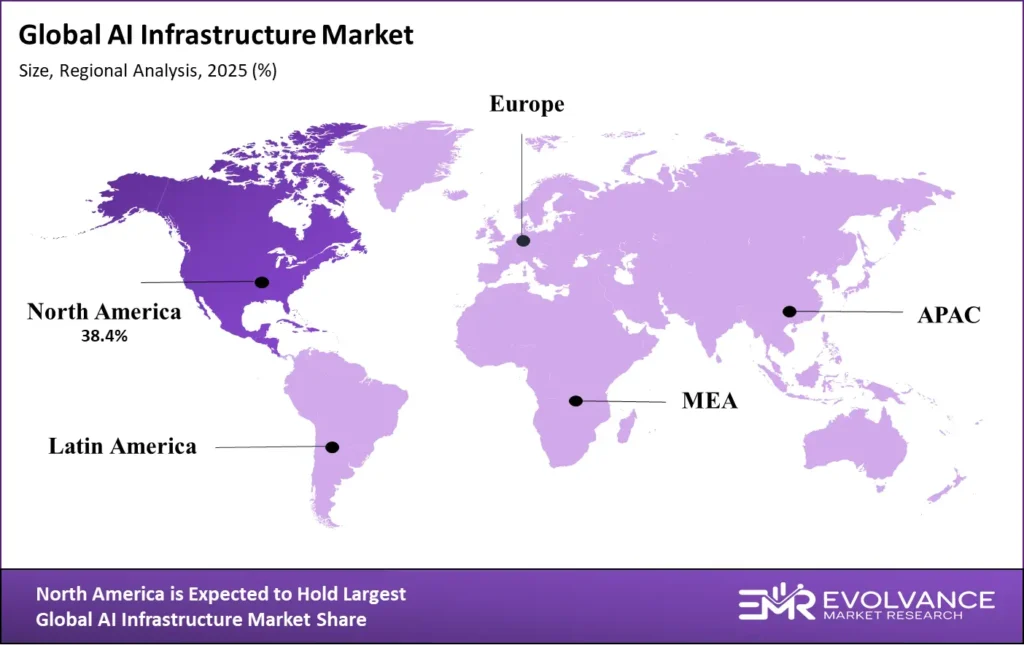
| North America (U.S., Canada) | 38.4% | 21.8% | Hyperscaler CapEx, Silicon Valley AI ecosystem, U.S. CHIPS Act data center investment |
| Asia-Pacific (China, Japan, South Korea, India) | 31.2% | 28.4% | China sovereign AI, India IndiaAI Mission, Japan AI Computing Initiative |
| Europe (EU, UK, Germany, France) | 17.6% | 19.4% | EU AI Factories program, sovereign cloud, GDPR-compliant on-premise AI build-out |
| Middle East & Africa (UAE, Saudi Arabia, Israel) | 8.4% | 34.7% | Project Transcendence, UAE NADIA, sovereign GPU cluster investment |
| Latin America (Brazil, Mexico) | 4.4% | 22.1% | Hyperscaler regional expansion, Brazilian AI national strategy |
The North America holds a 38.4% global AI infrastructure revenue share in 2026, driven by the highest concentration of hyperscaler capital expenditure, AI startup formation, and enterprise AI deployment. The U.S. CHIPS and Science Act allocated USD 52.7 billion for semiconductor manufacturing, with TSMC, Samsung, and Intel committing an additional USD 220 billion in U.S. fab construction through 2030. Northern Virginia, central Texas, and Phoenix have emerged as the primary hyperscale AI data center corridors, with more than 18 gigawatts of AI data center capacity under development in the United States as of Q1 2026.
The Middle East region is the fastest-growing AI infrastructure geography with a 34.7% CAGR through 2035. Saudi Arabia’s Project Transcendence targets USD 40 billion in AI infrastructure investment through 2030, including a national AI data center network and strategic partnerships with NVIDIA, Google, and AWS. G42 and Microsoft committed a combined USD 1.5 billion to UAE AI cloud infrastructure in 2024. These sovereign programs create AI infrastructure demand entirely independent of private enterprise adoption, structurally expanding the addressable market through 2035.
Key Companies: Platforms and Vendors Defining the AI Infrastructure Competitive Landscape
Six ecosystem layers define competition in the AI Infrastructure market: AI chip design, system manufacturing, hyperscaler cloud services, networking, AI software platforms, and managed services. NVIDIA holds a uniquely dominant position across the first three layers, with competition intensifying as established technology companies and AI-native challengers increase investment.
| Company | Segment | Key Differentiator | 2026 Status |
|---|---|---|---|
| NVIDIA | AI GPU & Systems | H100/B200 dominance; CUDA ecosystem; NVLink scale-up architecture | ~78% AI GPU market share |
| AMD | AI GPU & CPUs | MI300X competitive with H100; ROCm open-source stack; MI350 roadmap | Growing enterprise traction |
| Google (TPU / GCP) | Custom Silicon & Cloud | TPUv5 internal training; Gemini AI cloud; Vertex AI platform leadership | Cloud AI revenue leader |
| AWS (Trainium / Inferentia) | Custom Silicon & Cloud | Trainium2 price-performance; EC2 UltraCluster; SageMaker MLOps | Largest cloud AI IaaS |
| Microsoft Azure | Cloud AI & Software | OpenAI partnership; Azure Maia chip; Copilot AI platform integration | Enterprise AI cloud leader |
| Intel (Gaudi / Xeon) | AI Accelerators & CPUs | Gaudi 3 inference positioning; Xeon AI extensions; open ecosystem | Challenger positioning |
| TSMC | Semiconductor Fab | CoWoS advanced packaging; N3E AI chip production; 2nm roadmap | Critical supply bottleneck |
| Vertiv / Schneider Electric | Power & Cooling | Liquid cooling for 100kW+ racks; UPS AI data center solutions | Infrastructure enablers |
| Databricks | AI/ML Software Platform | Mosaic AI; Unity Catalog; LLM fine-tuning; USD 62B valuation | Enterprise AI platform leader |
| CoreWeave | AI Cloud (Independent) | NVIDIA GPU cloud at hyperscaler scale; USD 23B IPO valuation 2025 | Fastest-growing AI cloud |
NVIDIA maintains the highest strategic value in the AI Infrastructure competitive landscape through hardware performance leadership, software ecosystem lock-in, and systems integration capability that competitors cannot replicate within the 2026–2030 timeframe. Its NVLink Switch architecture allows 576 B200 GPUs to communicate at 1.8 TB/s bidirectional bandwidth in a single NVL576 domain — eliminating InfiniBand dependency for closed AI training clusters and creating compounding switching costs for hyperscaler customers.
CoreWeave’s emergence as an independent AI cloud provider is a defining competitive development. The company went public in March 2025 at a USD 23 billion valuation with a dedicated NVIDIA GPU cloud serving OpenAI, Microsoft, and major AI research organizations. Its committed revenue backlog exceeded USD 15 billion at IPO, demonstrating that hyperscaler-scale GPU infrastructure can operate profitably as a specialized independent service.
Key Growth Drivers of the AI Infrastructure Market
Generative AI CapEx, Sovereign AI Programs, and LLM Inference Scaling Drive Structural Demand
Generative AI application scaling is the primary demand driver for AI infrastructure through 2035. OpenAI’s ChatGPT serves more than 300 million weekly active users as of early 2026, with each query requiring GPU inference compute estimated at 10 to 100× a traditional search query. Enterprise adoption of AI coding assistants — GitHub Copilot (15 million paid users), Cursor, and Windsurf — is converting AI compute into operational IT budget spend, with every percentage point of enterprise AI adoption penetration generating an estimated USD 8.4 billion in incremental infrastructure demand.
Model capability scaling creates a structural infrastructure demand multiplier independent of user adoption. Frontier model training runs in 2026 require dedicated clusters of 16,000 to 100,000 H100-class GPUs running continuously for 30 to 120 days — workloads consuming USD 80 million to USD 500 million in GPU compute per run, with each new foundation model generation demanding exponentially more compute.
Power infrastructure constraints are paradoxically becoming a growth driver for specialized AI infrastructure companies. Average AI data center racks in 2026 draw 40 to 80 kilowatts, with Blackwell NVL72 racks requiring 120 kilowatts — densities incompatible with traditional data centers. This creates a USD 34.7 billion addressable market for purpose-built AI construction, liquid cooling systems, and small modular reactor power generation, all growing at above-market rates through 2035.
Market Restraints
GPU Supply Constraints, Power Availability, and Geopolitical Export Controls Constrain Infrastructure Scaling
GPU supply constraints remain the most impactful near-term market restraint through 2027. TSMC’s CoWoS advanced packaging — required for HBM3e memory integration in H100, H200, and B200 GPUs — faces structural capacity limitations that cannot be resolved within 12 to 18 months. Lead times for NVIDIA H100 clusters remained at six to nine months through mid-2025, creating secondary market GPU pricing at 1.4 to 2.1× list prices. Packaging bottlenecks will persist as AI chip complexity increases with each new architecture generation.
Export control restrictions imposed by the U.S. Department of Commerce represent a structurally significant market restraint for China-addressable AI infrastructure revenue. The A100/H100 export ban and subsequent H800 restriction blocked NVIDIA from shipping advanced AI training GPUs to Chinese customers. China’s AI Infrastructure market, valued at an estimated USD 31.4 billion in 2026, is increasingly served by Huawei Ascend 910B/C and domestic alternatives, creating a bifurcated global AI infrastructure market persisting through 2035.
Market Opportunities
Inference Infrastructure, AI-Native Data Centers, and Enterprise AI Platform Consolidation Unlock Premium Growth Segments
AI inference infrastructure represents the highest-growth opportunity segment within AI hardware through 2035. Training large foundation models occurs episodically, but inference — the continuous serving of AI model outputs to millions of concurrent users — is an always-on workload scaling linearly with user adoption. As generative AI grows from current 8% enterprise penetration toward projected 67% penetration by 2032, inference compute demand will grow at an estimated 4.2× the rate of training compute demand. Chips optimized for inference — NVIDIA’s L40S, AMD’s MI300X, and Google’s Trillium TPU — represent the largest incremental AI hardware opportunity not yet reflected in current hyperscaler procurement cycles.
Small and medium enterprise AI infrastructure adoption is an underpenetrated opportunity with structural tailwinds through 2030. Companies with USD 10 million to USD 500 million in revenue represent more than 87% of U.S. businesses but less than 19% of current AI infrastructure spend. GPU-as-a-service providers including CoreWeave, Lambda Labs, and Together AI are expanding accessible AI infrastructure into the SME segment at projected 41.3% annual growth through 2030.
AI Infrastructure Power & Sustainability Economics
Energy Demand, Liquid Cooling Architecture, and Carbon Commitment Strategy Define Next-Generation AI Data Center Investment
AI infrastructure is creating an unprecedented power demand challenge for the global data center industry. A standard hyperscale campus consuming 200 megawatts served 40,000 to 80,000 general-purpose servers. A comparable AI GPU cluster campus at 200 megawatts hosts only 8,000 to 16,000 H100 GPUs — 5 to 10 times less equipment at equivalent power draw. This density transformation is driving power procurement strategies, grid interconnection timelines, and on-site generation investments that fundamentally reshape AI infrastructure economics globally.
U.S. power grid interconnection queues reached a record 2,600 gigawatts of pending projects in 2025, with AI data centers representing a growing share of grid-connected load. Microsoft, Google, and Constellation Energy agreed to restart Pennsylvania’s Three Mile Island nuclear reactor for dedicated AI data center power. Small modular reactor developers including NuScale and X-energy hold hyperscaler advance purchase commitments exceeding USD 12 billion, targeting AI data center power delivery from 2030 onward.
Liquid cooling is transitioning from optional to mandatory for AI infrastructure above 40 kilowatts per rack. NVIDIA’s Blackwell NVL72 system requires direct liquid cooling at the GPU cold plate level, eliminating air cooling for next-generation clusters. Direct liquid cooling vendors — Vertiv, Schneider Electric, CoolIT, and Asetek — are experiencing 18 to 24 month order backlogs. The liquid cooling market for AI data centers is estimated at USD 18.4 billion in 2026, growing to USD 142 billion by 2035.
Sovereign AI Data Center Investment Framework
National AI Infrastructure Programs Are Reshaping Global Compute Geography and Market Demand Structures
Sovereign AI investment has emerged as a structurally independent demand driver for AI Infrastructure through 2035. Governments recognize that AI compute capacity is a strategic national resource with implications for economic competitiveness, national security, and digital sovereignty. The European Union’s AI Factories initiative, launched under the EuroHPC Joint Undertaking, is procuring dedicated supercomputing infrastructure for European AI model development with a EUR 20 billion investment commitment through 2030. Germany’s BMBF AI program has committed EUR 1.6 billion and France’s Plan for AI includes EUR 2.5 billion for AI infrastructure and compute access programs.
The IndiaAI Mission represents Asia’s most significant government-led AI infrastructure investment outside China. With approximately USD 1.24 billion approved in March 2024, the program targets 10,000 GPUs in a shared compute facility accessible to startups, research institutions, and government agencies by 2026. India’s AI infrastructure market is projected to grow from USD 4.2 billion in 2026 to USD 38.7 billion by 2035.
Sovereign AI programs are creating new business models for AI infrastructure vendors. NVIDIA has established a dedicated Sovereign AI practice offering government clients turnkey AI data center deployment packages combining GPU hardware, networking, software, and partner system integration. Microsoft’s national cloud programs — deployed in 28 countries through dedicated government Azure regions — provide sovereign AI compute with contractual data residency guarantees. The sovereign AI infrastructure addressable market is estimated at USD 42 billion in 2026 and growing at 31.4% annually.
Enterprise AI Infrastructure ROI Framework
Total Cost of Ownership, Infrastructure Performance Benchmarks, and AI Value Realization Economics for 2026–2035
Enterprise AI Infrastructure investment decisions are increasingly governed by quantitative ROI frameworks rather than innovation exploration budgets. Chief Information Officers are applying total cost of ownership analysis to AI compute procurement — a structural market maturity signal that accelerates enterprise spending while improving vendor accountability for infrastructure performance outcomes across the 2026–2035 forecast period.
Total Cost of Ownership for enterprise AI infrastructure includes hardware acquisition, power and cooling operating expense, networking and storage, AI platform software licensing, and human capital for infrastructure engineering. For a mid-enterprise deploying a 128 H100 GPU on-premise cluster, five-year TCO typically ranges from USD 18 million to USD 34 million, including hardware depreciation and power at USD 0.08 to USD 0.14 per kWh. Equivalent cloud GPU rental costs USD 22 million to USD 48 million over the same period, with cloud architecture offering capacity flexibility and eliminating hardware obsolescence risk — factors favoring hybrid deployment for organizations with variable AI utilization patterns.
AI infrastructure ROI realization timelines vary significantly by use case. Code generation AI tools deliver measurable developer productivity gains of 26% to 45%, enabling ROI payback within 6 to 14 months. Document intelligence LLMs for legal review and insurance claims processing achieve payback within 12 to 24 months. AI-accelerated drug discovery carries ROI horizons of 36 to 72 months but generates NPV returns estimated at USD 200 million to USD 2 billion per successful compound discovery program.
Latest Trends in the AI Infrastructure Market
Blackwell GPU Ramp, Agentic AI Compute Demand, and AI Data Center Power Deals Reshape Infrastructure Economics in 2026
The NVIDIA Blackwell GPU architecture ramp is the defining AI infrastructure event of 2026. Blackwell B200 and GB200 NVLink units entered volume production in Q4 2025, with NVIDIA shipping an estimated 500,000 B200 GPU equivalents in Q1 2026. The Blackwell architecture makes H100 clusters economically suboptimal for new training workloads within 18 months — accelerating hyperscaler cluster refresh cycles faster than any prior GPU generation transition.
Agentic AI systems are driving a new category of AI infrastructure demand. Unlike single-query inference, AI agents execute multi-step reasoning chains, tool calls, web browsing, and code execution in iterative loops consuming 10 to 50× more GPU compute per session. OpenAI’s Operator, Anthropic’s Claude computer use, Google’s Gemini agents, and Salesforce Agentforce require persistent GPU context memory and low-latency RAG infrastructure — projected to represent 38% of total AI inference compute demand by 2028.
AI model efficiency improvements are simultaneously compressing and expanding AI infrastructure demand. Quantization, model distillation, and mixture-of-experts architectures enable equivalent output quality at 40% to 80% lower compute cost per inference token. These efficiency gains are enabling previously uneconomical AI applications, expanding the total use case surface area served by AI infrastructure and sustaining demand growth even as per-unit compute costs decline.
Recent Developments: NVIDIA, Microsoft, Google, and CoreWeave Lead 2025–2026
- March 2026: NVIDIA announced Project Digits, a desktop AI supercomputer delivering 1 petaflop of AI compute using the GB10 Grace Blackwell Superchip, priced at USD 3,000 and targeting enterprise developers requiring local model development without cloud dependency.
- February 2026: Microsoft and OpenAI announced Stargate Phase 2, committing USD 100 billion for U.S. AI data center construction through 2030, targeting 5 gigawatts of dedicated AI compute capacity across Texas, Wisconsin, and North Dakota campuses.
- January 2026: The Stargate AI Infrastructure Initiative was announced, committing USD 500 billion in private sector AI infrastructure investment with SoftBank, OpenAI, and Oracle as lead partners — the largest single AI infrastructure commitment in history.
- November 2025: CoreWeave reported USD 1.9 billion in Q3 2025 revenue representing 300% year-over-year growth, confirming the viability of independent hyperscale GPU cloud infrastructure as a standalone profitable business model ahead of its March 2025 IPO.
- September 2025: Google DeepMind released Gemini 2.0 Ultra, trained on a TPUv5 cluster exceeding 50,000 chips, achieving state-of-the-art performance on 32 of 40 benchmarks and validating Google’s custom silicon strategy as competitive with NVIDIA GPU-based training for frontier model development.
Competitive Landscape
Market Concentration at the Chip Layer, Hyperscaler Power at the Cloud Layer, and Fragmentation at the Software Layer
The AI Infrastructure competitive landscape is defined by extreme concentration at the semiconductor and systems layer — where NVIDIA commands approximately 78% of AI training GPU revenue — combined with intense competition among hyperscalers for AI cloud workload share and fragmentation across the AI software platform and MLOps tooling markets. These three layers create distinct pricing dynamics: NVIDIA extracts premium hardware margins from scarcity; hyperscalers compete on AI service breadth and enterprise relationship leverage; AI software vendors compete on developer experience and time-to-value.
Vertical integration is the defining competitive strategy among leading AI Infrastructure participants through 2030. NVIDIA’s acquisitions of Mellanox and Run:ai create an integrated AI infrastructure stack from silicon to software. Google controls TPU design, manufacturing partnerships, DeepMind research, and Google Cloud AI services. Microsoft integrates Azure infrastructure, OpenAI model access, and GitHub Copilot tools — embedding AI infrastructure consumption within existing software procurement relationships.
Key Market Segments
By Component
- Compute Hardware (GPUs, AI Chips, Accelerated Servers)
- Networking Infrastructure (InfiniBand, AI Ethernet Fabric)
- Storage Systems (NVMe SSD, Object Storage, HBM)
- AI Software Platforms (MLOps, LLM Frameworks, Orchestration)
- Power & Cooling Infrastructure (Liquid Cooling, UPS, PDU)
By Deployment Mode
- Cloud (Hyperscaler AI-as-a-Service)
- On-Premise (Enterprise GPU Cluster)
- Hybrid (Cloud + On-Premise Integration)
- Edge AI (Inference at the Edge, Device AI)
By Infrastructure Type
- AI Training Infrastructure
- AI Inference Infrastructure
- AI Data Pipeline & Storage
- AI Networking & Interconnect
- AI Power & Thermal Management
By End-Use Industry
- BFSI (Banking, Financial Services & Insurance)
- Technology & Software
- Healthcare & Life Sciences
- Government & Defense
- Retail & E-Commerce
- Manufacturing & Industrial
- Telecommunications
- Energy & Utilities
- Education & Research
By Geography
- North America (U.S., Canada)
- Asia-Pacific (China, Japan, South Korea, India, Australia)
- Europe (EU, UK, Germany, France, Netherlands)
- Middle East & Africa (UAE, Saudi Arabia, Israel, South Africa)
- Latin America (Brazil, Mexico, Argentina)
Report Features
| Feature | Description |
|---|---|
| Market Value (2026) | USD 142.8 billion |
| Forecast Revenue (2035) | USD 947.46 billion |
| CAGR (2026–2035) | 23.4% |
| Base Year for Estimation | 2026 |
| Historic Period | 2020–2025 |
| Forecast Period | 2026–2035 |
| Report Coverage | Revenue Forecast, Component Analysis, Deployment Economics, Technology Stack, Sovereign AI Framework, Power & Sustainability Economics, Enterprise ROI Framework, Competitive Intelligence, Regional Analysis |
| Segments Covered | By Component, By Deployment Mode, By Infrastructure Type, By End-Use Industry (9 sectors), By Geography (5 regions) |
| Regional Analysis | North America, Asia-Pacific, Europe, Middle East & Africa, Latin America with country-level data |
| Dominant Component | Compute Hardware with 51.7% revenue share |
| Dominant Deployment Mode | Cloud with 44.2% revenue share |
| Fastest-Growing Segment | Edge AI Inference at 38.6% CAGR |
| Competitive Landscape | NVIDIA, AMD, Google TPU, AWS Trainium, Microsoft Azure, Intel Gaudi, TSMC, Vertiv, Databricks, CoreWeave |