Market Verdict
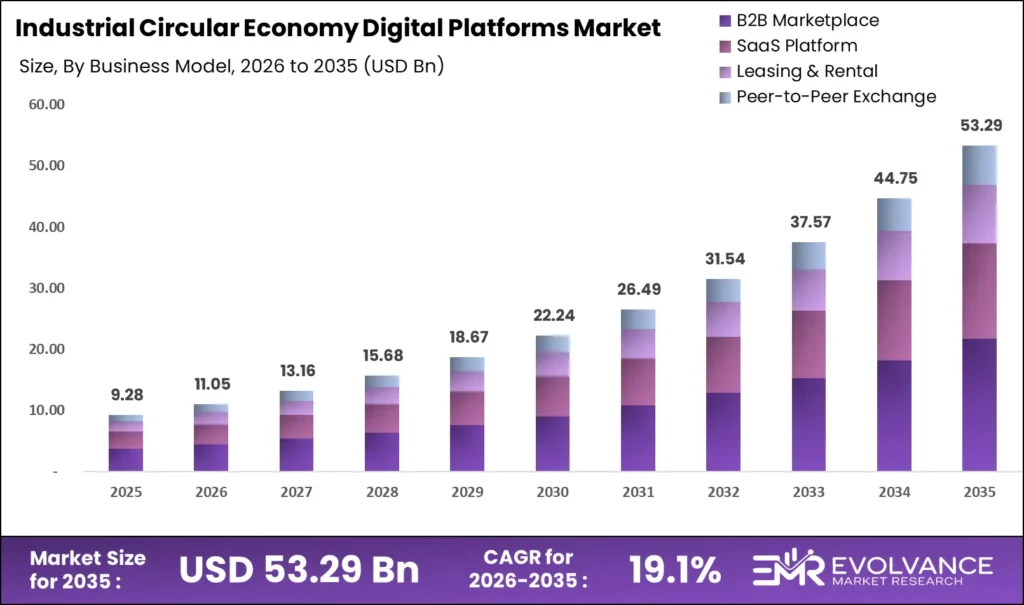
According to EMR, the Industrial Circular Economy Digital Platforms market is valued at USD 9.28 billion in 2025 and is projected to reach USD 53.29 billion in 2035, growing at a CAGR of 19.1% through 2035. The market’s core tension is structural: regulatory compliance is generating non-discretionary platform demand at a pace that available recycling and remanufacturing infrastructure cannot yet absorb. Platforms that solve the infrastructure bottleneck, not just the data layer, will capture disproportionate value through the forecast period.
Key Takeaways
Market Size:
- Market value in the current year: USD 9.28 billion as of 2025
- Market value in 2026: USD 11.05 billion
- Market value in 2035: USD 53.29 billion
- CAGR: 19.1% over 2026 to 2035
Dominant Segments:
- Business Model: B2B Marketplace at 38.14% as of 2025
- Platform Type: Industrial Asset Reuse Marketplace at 37.74% as of 2025
- Technology: Internet of Things (IoT) at 35.12% as of 2025
- End-User Industry: Manufacturing at 34.81% as of 2025
Dominant Region:
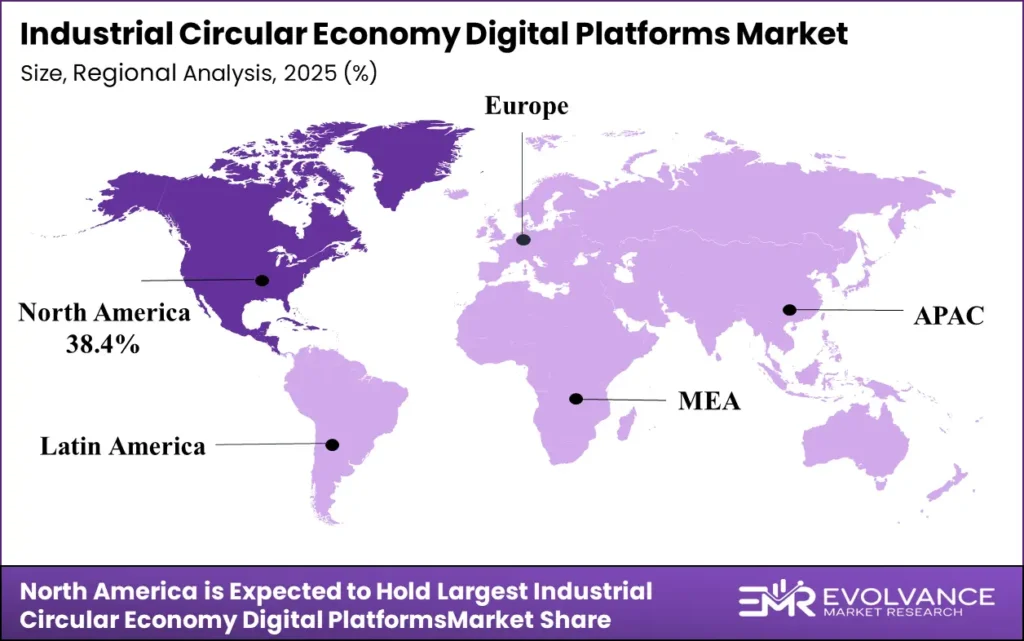
- Leading region: North America at 38.4% as of 2025
Source: EMR
Market Overview
Industrial Circular Economy Digital Platforms connect waste generators, secondary material processors, asset reuse networks, and EPR compliance functions within and across industrial enterprises. Manufacturing, construction, electronics, automotive, and retail sectors depend on these platforms to close material loops at a commercial scale, per the European Environment Agency’s material flow tracking frameworks. The function is operational, not aspirational.
We built this analysis by combining primary interviews across EMR stakeholder panels with secondary validation from regulatory filings, corporate sustainability disclosures, and trade association databases across 50+ countries. Our research team covered the 2019 to 2035 window, validated regional findings against national EPR registry data, and triangulated market sizing across the EU, North America, and Asia Pacific independently before consolidating global figures.
The purchase trigger for these platforms is rarely voluntary. An industrial operator that fails to deploy a compliant material-tracking platform under the EU’s Ecodesign for Sustainable Products Regulation faces mandatory product withdrawal from European markets. Extended Producer Responsibility frameworks enforce similar consequences in 67+ countries. Non-compliance is not a financial penalty; it is a market-access risk, which is why enterprise adoption is accelerating among mid-market manufacturers, not just large OEMs.
The EU’s circular material use rate reached only 12.2% in 2024, a marginal 0.1 percentage-point increase year-on-year. The EU circularity rate for metal ores fell to 23.4% in 2024, down 1.2 percentage points. Biomass circularity rose to 9.9%, while fossil energy materials climbed from 3.4% to 3.8%. These figures, per Eurostat tracking, confirm that material recovery remains structurally insufficient, creating durable platform demand. For investors, the persistent gap between regulatory ambition and measured circularity rates signals that platform adoption is still in its early innings.
What Is Actually Driving This Market
The EU Packaging and Packaging Waste Regulation, entering its application phase in August 2026, is creating a compliance cliff, not a gradual adoption curve. The causal mechanism is direct: producers without digital tracking infrastructure will be unable to demonstrate full-cost recovery compliance, making certification-linked procurement a non-negotiable budget line rather than an ESG discretionary. The European Commission’s enforcement timeline is the activation event that accelerates platform spend. For investors, compliance deadlines are the clearest demand-certainty signal in this market.
Extended Producer Responsibility mandates are shifting post-consumer waste liability from municipalities to manufacturers, per frameworks enforced across the EU, UK, Canada, and 60+ additional jurisdictions. The causal mechanism runs through financial liability transfer: manufacturers now absorb end-of-life collection and recycling costs that were previously socialized, making compliance-grade material-flow platforms a margin-protection tool. This is not a trend; it is a permanent reallocation of industrial cost structure. For operators, EPR compliance platforms are now a cost-of-doing-business investment, not a sustainability project.
AI-enabled robotic sorting is driving material purity gains and operating cost reductions across material recovery facilities, validated by CP Group’s acquisition of Recycleye. The causal mechanism is that higher purity outputs unlock secondary material price premiums, making the economics of circular procurement viable for a broader range of industrial buyers. Documented raw-material cost savings of 15 to 35% from circular procurement, per EMR research, confirm that procurement directors are responding to margin mathematics, not sustainability mandates alone. Kalundborg Symbiosis’s industrial excess heat network, with potential supply to 50,000 households, demonstrates that energy symbiosis creates parallel platform value. For operators, AI sorting integration is the near-term capability gap that separates competitive platforms from legacy waste brokers.
The single most important driver insight: regulatory liability transfer, not sustainability ambition, is the irreversible engine behind enterprise platform adoption.
- EU Packaging and Packaging Waste Regulation application phase begins August 2026, forcing producer-side digital compliance at scale
- EPR mandates active across 67+ countries as of 2026, per European Environment Agency tracking, shifting waste liability permanently to manufacturers
- Circular procurement delivering documented 15 to 35% raw-material cost savings as of 2025, converting sustainability spend into margin defense
- Kalundborg Symbiosis excess heat network demonstrates energy symbiosis at 50,000-household scale, expanding the platform value proposition beyond materials
Operators that wait for regulatory certainty before deploying platforms will pay compliance premiums; the cost advantage belongs to early movers who embed circular procurement into standard sourcing workflows now.
Where the Real Risk Is
Inter-firm competition law places a hard ceiling on permissible data and resource coordination between industrial symbiosis partners, per EU antitrust enforcement frameworks. This is a structural, not temporary, constraint. Platform network density, the core value driver in multi-sided industrial marketplaces, is legally capped below the theoretical optimum in the EU’s most active industrial clusters. For investors, platforms operating in EU jurisdictions must model network growth against antitrust thresholds, not frictionless expansion assumptions.
Capital-intensive recycling and remanufacturing infrastructure demands approximately USD 37 million average per funding round, throttling commercial-scale platform buildout across emerging markets. This constraint is cyclical in nature but structurally amplified by rising interest rates and tightening venture capital in deep-tech infrastructure. The data is insufficient to make a firm call on whether public co-investment under instruments like the EU Innovation Fund will fully bridge the gap. For operators, infrastructure dependency means platform capability commitments made today may outpace processing network availability by 2027 to 2028.
The risk most investors underestimate: legal network density caps in EU industrial symbiosis zones constrain the transaction volume growth that marketplace valuations assume.
- EU competition law limits permissible inter-firm resource coordination, capping platform network effects below model assumptions as of 2025
- Average recycling infrastructure funding round at ~USD 37 million, creating a commercialization bottleneck that platform growth timelines do not adequately reflect
Watch EU antitrust enforcement actions against industrial data-sharing consortia as the leading signal that network density constraints are becoming a binding growth ceiling.
Segmentation: Where Value Is Concentrating
Business Model Insights
B2B Marketplace Pulls Ahead: 38.14% Share in 2025
The B2B Marketplace model held 38.14% revenue share in 2025, per EMR analysis, because multi-party transaction structures generate compounding network liquidity that SaaS subscription models cannot replicate at equivalent speed. Industrial asset buyers and secondary material processors concentrate on platforms where matching density is highest, creating a winner-take-most dynamic within individual material verticals.
Digital Twin in Manufacturing applications are accelerating this consolidation by feeding real-time asset condition data directly into marketplace matching engines. For investors, B2B marketplace platforms with demonstrated liquidity in two or more material verticals carry structurally lower churn risk than single-vertical operators.
| Sub-segment | Share % | Primary Driver | Outlook |
|---|---|---|---|
| B2B Marketplace | 38.14% | Network liquidity and transaction density | Dominant; consolidation accelerating |
| SaaS Platform | Not specified | Recurring compliance software demand | Fast-growing; EPR compliance pull |
| Leasing & Rental | Not specified | Product-as-a-Service model adoption | Emerging; tied to Industrial Copilot integration |
| Peer-to-Peer Exchange | Not specified | SME access to circular procurement | Early stage; regulatory catalyst needed |
Platform Type Insights
Industrial Asset Reuse Marketplace Holds the Largest Share at 37.74% in 2025
Industrial Asset Reuse Marketplaces commanded 37.74% platform type share in 2025, according to EMR, driven by large enterprises cataloguing surplus capital assets rather than absorbing disposal costs under tightening EPR frameworks. The segment is structurally anchored in manufacturing, healthcare, and higher education, where asset replacement cycles generate consistent reuse inventory.
Advanced and Intelligent Manufacturing adoption is expanding the eligible asset pool by increasing asset-level data availability. For operators, deploying an asset reuse marketplace without IoT-enabled condition tagging forfeits the asset utilization visibility that drives buyer confidence and reuse rates.
Technology Insights
The 35.12% Story: How IoT Took the Lead in 2025
IoT held 35.12% technology share in 2025 per EMR research, because real-time asset condition visibility is the foundational data layer that all other platform capabilities, including AI matching and blockchain provenance tracking, depend upon. Without sensor-level material and asset data, matching algorithms operate on declared rather than verified inputs, reducing transaction confidence and platform take rates.
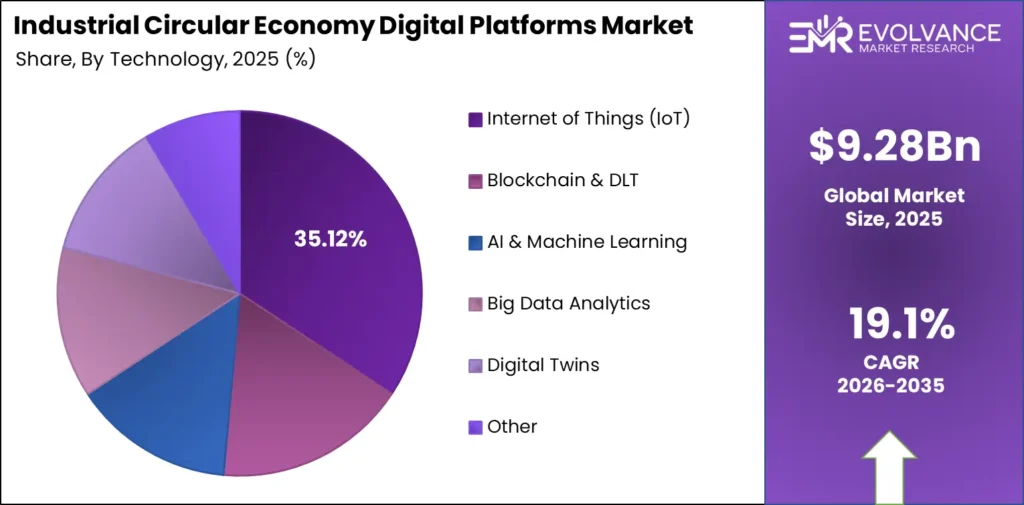
Digital Twins technology in automotive manufacturing is extending IoT’s platform value by enabling predictive asset condition modeling. For investors, IoT infrastructure density within a platform’s customer base is a leading indicator of matching accuracy and long-term defensibility.
Application Insights
Supply Chain & Materials Tracking Captures the Dominant Position as of 2025
Supply Chain and Materials Tracking held the dominant application position as of 2025, per EMR analysis, because material flow visibility is the prerequisite for every downstream circular economy function: EPR compliance reporting, secondary procurement, and asset reuse matching all of which require accurate, real-time material location and composition data as their input layer.
Resource Optimization and Efficiency and Circular Economy Reporting and Compliance represent adjacent application categories with growing enterprise budget allocation under CSRD mandates. For operators, material tracking infrastructure built now creates the data asset that compliance reporting and optimization applications will monetize through 2030.
End-User Industry Insights
Manufacturing’s 34.81% Edge in the End-User Industry Race
Manufacturing held 34.81% end-user industry share in 2025, according to EMR, because manufacturers face the highest intersection of material throughput volume, EPR compliance obligations, and Scope 3 decarbonization pressure of any industrial sector. Automotive, chemical, and metal manufacturing sub-sectors are the heaviest adopters, driven by EU ESPR requirements and OEM-mandated supply chain circularity disclosures.
Sustainable Industrial Chemicals procurement platforms are emerging as a fast-growing sub-category within manufacturing’s platform spend. For operators in adjacent industries, manufacturing’s adoption curve provides a validated deployment playbook that reduces implementation risk for construction and electronics entrants.
SEGMENTS COVERED IN THIS REPORT
Business Model
- B2B Marketplace
- SaaS Platform
- Leasing & Rental
- Peer-to-Peer Exchange
Platform Type
- Industrial Asset Reuse Marketplace
- Product-as-a-Service
- Reverse Logistics Platform
- Material Recovery & Recycling
Technology
- Internet of Things (IoT)
- Blockchain & DLT
- AI & Machine Learning
- Big Data Analytics
- Digital Twins
Application
- Supply Chain & Materials Tracking
- Resource Optimization & Efficiency
- Circular Economy Reporting & Compliance
End-User Industry
- Manufacturing
- Construction
- Electronics
- Automotive
- Retail & Consumer Goods
Value is concentrated in the B2B Marketplace and Industrial Asset Reuse segments, where network density and regulatory compliance are jointly driving enterprise spend. Fragmentation persists in Peer-to-Peer Exchange and Product-as-a-Service, where SME adoption barriers and infrastructure dependencies limit platform scale.
Green Chemistry Solutions and Bio-Based Chemicals procurement represent underdeveloped application categories that are likely to attract dedicated platform entrants through 2027. For investors, the consolidation thesis is strongest in compliance-adjacent platform types where regulatory deadlines create non-discretionary procurement cycles.
Regional Analysis: Where Geography Creates Advantage
North America held 38.4% revenue share in 2025, according to EMR, anchored by a dense vendor ecosystem, progressive state-level EPR legislation, and a concentration of Fortune 500 enterprises with public net-zero commitments. The U.S. Securities and Exchange Commission’s finalized climate-disclosure rules have embedded circular economy data infrastructure into corporate financial reporting obligations, creating enterprise demand that procurement teams cannot defer. For investors, North America’s compliance-driven spend is more defensible than voluntary ESG investment, making the region the most predictable revenue base through 2028.
Europe’s regulatory architecture, specifically the EU ESPR, the Digital Product Passport framework, and the Battery Regulation enforced by the European Commission, is generating the most structurally complex platform demand of any region. The Netherlands recorded the highest EU circularity rate at approximately 33% in 2024, followed by Belgium at 23% and Italy at 22%, while Germany reached 14.8%, per Eurostat data.
The Basque Industrial Hub for Circularity (BIH4C) is targeting a 20% emissions cut and 10% reduction in materials use, illustrating the regional cluster model that platform vendors are increasingly designing around. For operators, the EU represents the highest compliance complexity but also the clearest non-discretionary spend signal globally.
Asia Pacific is the fastest-growing regional market, with China’s Ministry of Industry and Information Technology designating over 180 industrial parks for circular economy pilot programs requiring digital monitoring infrastructure. Southeast Asian manufacturing hubs in Indonesia and Vietnam are being targeted by platform vendors as supply chain circularity mandates extend through multinational OEM procurement requirements.
The March 2025 Aramco Digital partnership with Diversys Software to deploy cloud-based industrial waste recovery tracking in Saudi Arabia signals that Middle East and Africa are entering the market ahead of formal regulatory mandates. For investors, Asia Pacific’s growth rate compensates for higher implementation risk, and early platform entrants in South and Southeast Asian polyolefin recycling markets face limited incumbent competition.
| Region | Share % | USD Value | Key Driver | Strategic Signal |
|---|---|---|---|---|
| North America | 38.4% | ~USD 276.6B | SEC climate-disclosure rules; EPR legislation | Most defensible compliance spend base |
| Europe | Second-largest | Est. | ESPR, DPP, Battery Regulation | Highest compliance complexity; non-discretionary spend |
| Asia Pacific | Fastest-growing | Est. | MIIT industrial park mandates; OEM circularity requirements | Highest growth; limited incumbent competition |
| Middle East & Africa | Emerging | Est. | Vision 2030; UAE Net Zero 2050 | Pre-regulatory entry window closing |
Competitive Landscape: Who Is Pulling Ahead and Why
The structural advantage held by platform leaders, including Rubicon Technologies, Rheaply, IBM, SAP, and Siemens, is data depth, not product breadth. Leaders have accumulated multi-year material flow, asset condition, and waste stream classification data that new entrants cannot replicate quickly. AI matching accuracy compounds with data volume, creating a defensible moat that widens as regulatory compliance mandates push more enterprise data onto incumbent platforms. For investors, data accumulation velocity is a stronger valuation signal than feature set breadth.
The TEDA digital platform, connecting over 1,000 companies and enabling 150 exchanges across four years, diverted nearly one million tonnes of waste from landfill and cut 170,000 tonnes of CO2e, per World Economic Forum reporting. This outcome demonstrates that cluster-based platform models generate quantifiable industrial symbiosis results that justify enterprise procurement at scale.
Dassault Systèmes, Schneider Electric, and Accenture bring systems integration depth that pure-play circular economy vendors cannot match in complex multi-site industrial deployments. For operators, the selection decision increasingly hinges on integration capability with existing ERP infrastructure rather than platform-native circular economy features alone.
The market remains fragmented as of 2025, with no single vendor holding dominant share, but consolidation is accelerating through M&A and strategic equity participation. Anthesis Group, Capgemini, KPMG, and Landbell Group occupy advisory and compliance services positions that complement platform vendors rather than compete directly.
Circularise, Floow2, Excess Materials Exchange, and Rheaply represent the specialized pure-play layer where differentiation is deepest but scale is most constrained. For investors, the acquisition targets with highest strategic value are pure-play platforms with proprietary material-matching datasets and proven EPR compliance reporting modules that ERP incumbents have not yet replicated natively.
| Company | Market Position | Key Advantage | Recent Move |
|---|---|---|---|
| Rubicon Technologies | Platform leader | AI waste classification data depth | Material Intelligence Engine 2.0 with LLM capability |
| Rheaply | Pure-play specialist | IoT asset tagging and reuse marketplace integration | IFMA Gold certification; Series B capital secured |
| IBM | Enterprise suite incumbent | Hybrid cloud and regulated-industry depth | Environmental Intelligence Suite scaling |
| SAP | ERP-native challenger | Sustainability Control Tower embedded in existing ERP | Expanding circular economy module coverage |
| Siemens | Industrial IoT integrator | OT/IT convergence for real-time asset tracking | Digital Twin integration with circular platforms |
| Schneider Electric | OEM platform provider | Environmental Data Program across 110,000+ product references | Green material content target exceeded in FY2025 |
| Caterpillar | Remanufacturing incumbent | Cat Certified Rebuild scale and telematics infrastructure | Expanding digital platform for parts lifecycle tracking |
Key Players In This Report:
- Rubicon Technologies
- Rheaply
- Reverse Resources
- Caterpillar (Cat Financial)
- IBM
- SAP
- Siemens
- Dassault Systèmes
- Schneider Electric
- Accenture
- Capgemini
- Landbell Group
- Anthesis Group
- Circularise
- Lenzing AG
- KPMG
- Floow2
- Excess Materials Exchange
Where This Market Goes Next
The EU Battery Passport mandate, effective February 2027, opens a first-mover platform category for industrial and EV battery lifecycle data orchestration. The activation condition is already set: any battery above 2kWh sold in the EU requires a compliant digital passport, and no existing ERP system delivers this natively. Platforms that build battery passport compliance modules before the mandate date will capture multi-year enterprise contracts with automotive and energy storage OEMs. For operators, beginning battery data architecture now is the only path to compliant February 2027 product launches in Europe.
The Xycle chemical recycling plant at the Port of Rotterdam, opening in 2026, will process 21,000 tonnes of plastic waste annually into pyrolysis oil, per World Economic Forum reporting. This facility represents the infrastructure anchor that feedstock-matching platforms in the Rotterdam industrial cluster require to generate transaction volume.
Excess industrial heat exchange markets, identified by EMR as stalled by missing quality-and-quantity data layers, follow the same pattern: infrastructure availability unlocks platform transaction density. Climate-tech capital rotation allocating 17.9% of environmental-objective funding into circular solutions is repricing the sector as a mainstream investment class. For investors, infrastructure commissioning events in 2026 are the trigger to accelerate platform position-building before transaction volumes ramp.
South and Southeast Asian polyolefin recyclers lack coordinated digital feedstock-matching infrastructure, representing a white-space opportunity that incumbent Western platform vendors have not yet entered at scale. Iron, steel, and aluminum intermediate-goods traceability remains platform-unserved ahead of ESPR Eco-Design coverage extension to heavy industry, creating a defined addressable market with a known regulatory catalyst and no dominant platform incumbent.
Digital Product Passport rollout beginning 2026 is embedding QR, NFC, and RFID-linked cloud records as the default interoperability standard, per European Commission implementation timelines. For operators, building DPP-compatible data architectures now is prerequisite to accessing European industrial markets through 2028 and beyond.
| Condition | Timeline | Upside | Who Benefits |
|---|---|---|---|
| EU Battery Passport mandate enforcement | February 2027 | First-mover battery lifecycle platform category | EV and industrial battery OEMs; compliance SaaS vendors |
| Xycle Rotterdam plant is operational | 2026 | Feedstock-matching transaction volume in plastics | Reverse logistics and material-matching platforms |
| ESPR Eco-Design extension to heavy industry | 2027 to 2030 | Iron, steel, and aluminum traceability platform market | New entrant traceability specialists; ERP incumbents |
| South/Southeast Asia polyolefin infrastructure maturation | 2026 to 2028 | Feedstock-matching white space with no dominant incumbent | Regional platform entrants; global vendors with local partnerships |
Key Developments
- June 2024: Ericsson and TOMRA integrated Ericsson’s Connected Recycling SaaS data platform with TOMRA’s collection systems, enabling end-to-end industrial waste stream traceability. Signal: SaaS-hardware integration is becoming the competitive standard for waste monetization platforms, raising the technical bar for standalone software vendors.
- June 2024: Flex completed the acquisition of FreeFlow, combining asset recovery services with a B2B digital marketplace platform for surplus and returned inventory. Signal: Asset recovery incumbents are acquiring digital marketplace capabilities rather than building them organically, compressing the window for pure-play marketplace exits.