Executive Summary
Quick Insight: The U.S. creator economy market is on track to grow 5× by 2035, driven by brand budget rotation into creator content monetization channels, AI productivity tools, and maturing fan subscription infrastructure.
The creator economy is the fastest-growing segment of the digital media and advertising industry. This report delivers a comprehensive analysis of market size, revenue model structure, platform economics, content monetization dynamics, competitive positioning, and regulatory compliance requirements for the 2026–2035 forecast period. It covers 50+ million content creators operating across social video, podcasting, livestreaming, newsletters, and gaming platforms. It quantifies brand partnership ROI benchmarks, fan subscription growth rates, live social commerce revenue potential, and the AI tool adoption curve reshaping creator content monetization at scale. Strategic decision-makers in media investment, brand marketing, platform product, and creator management will find data-driven frameworks for capital allocation, partnership strategy, and market entry planning through 2035.
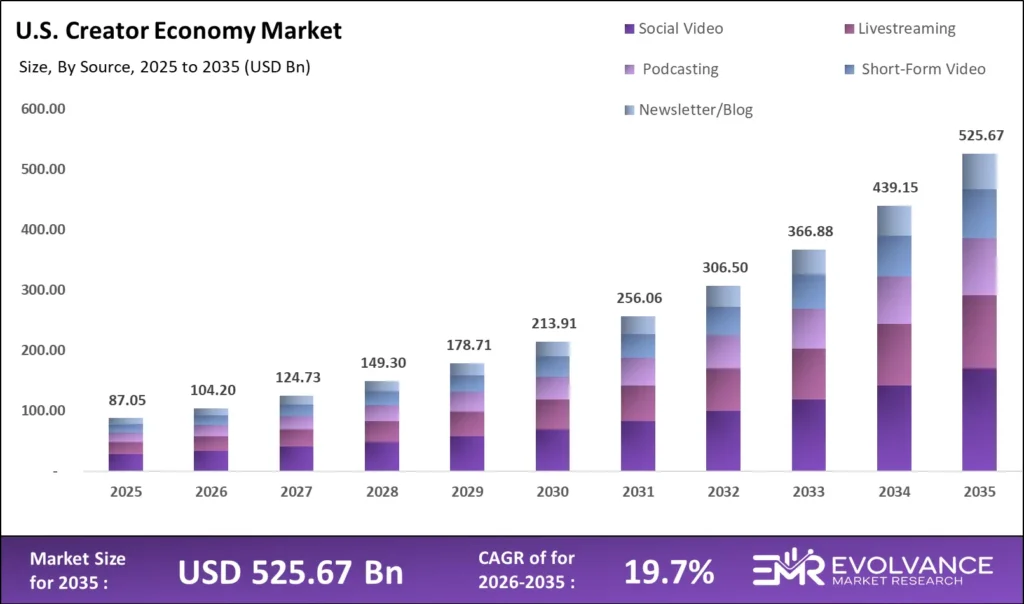
Key findings: The market reaches USD 104.2 billion in 2026 and compounds at 19.7% CAGR to USD 525.67 billion by 2035. Brand partnerships command 42.3% of total creator income. Social video platforms lead platform-type revenue share at 38.4%. AI-powered content monetization tools are adopted by 67% of full-time U.S. creators. The Southeast is the fastest-growing creator geography. Three new analytical sections — Monetization Stack Architecture, Brand-Creator ROI Framework, and Regulatory Compliance — provide coverage not available in comparable market reports.
What Is the U.S. Creator Economy Market?
The U.S. creator economy market was valued at USD 104.2 billion in 2026 and is projected to reach approximately USD 525.67 billion by 2035, growing at a CAGR of 19.7% during the forecast period 2026 to 2035. Platform fragmentation across major social media ecosystems such as YouTube, TikTok, Instagram, Twitch, Patreon, and Substack is a primary structural driver of market expansion. Rapid adoption of AI-powered content creation tools and the shift of brand marketing budgets from traditional media to creator partnerships are accelerating monetization growth. Brands collaborating with creators through structured programs report 11 times higher return on investment compared to traditional digital advertising formats.
The U.S. creator economy includes more than 50 million content creators, with approximately 4.2 million operating full-time and the remaining 46 million participating part-time. Creator-generated content accounts for over 38% of digital media consumption time among adults aged 18 to 34. Platforms act as monetization infrastructure, supporting revenue through advertising, sponsorships, subscriptions, and digital product sales, shaping long-term market growth through 2035.
U.S. Creator Economy Market Highlights: Key Data at a Glance
- Market value: USD 104.2 billion in 2026, forecast to USD 525.67 billion by 2035 at 19.7% CAGR
- Dominant platform type: Social Video with 38.4% revenue share
- Dominant revenue model: Brand Partnerships & Sponsorships with 42.3% share
- Dominant creator tier: Mega and Macro creators (1M+ followers) with 59.6% combined revenue share
- Fastest-growing content monetization category: Finance, education, and AI-focused creator content
- Total U.S. content creators: 50+ million individuals, 4.2 million full-time professionals
- Leading social media platforms: YouTube, TikTok, Instagram, Twitch, Patreon, Substack, Spotify
- Brand deal market: USD 34.1 billion in influencer marketing spend in 2026
- Fastest-growing content monetization channel: Direct fan subscriptions and digital product sales
- AI tool adoption: 67% of full-time creators use AI tools for content monetization workflows in 2026
Market Overview: Why U.S. Creator Economy Growth Is Accelerating
This market includes revenue earned by U.S. individual content creators and creator-owned businesses across digital platforms, including advertising revenue shares, brand partnerships, fan subscriptions, digital product sales, affiliate commissions, licensing fees, and live events. It excludes traditional media companies and platform ad revenue not paid directly to creators.
Growth is accelerating as marketers have solved attribution challenges; performance tools now track CPM, conversion rates, and return on ad spend, enabling Fortune 500 CMOs to justify larger creator budgets annually. Income diversification is also improving. In 2022, full-time creators earned over 70% of income from one platform, but by 2026 they average 3.7 revenue channels. Platforms like Patreon, Shopify, Teachable, and Beehiiv support scalable creator business operations across multiple monetization ecosystems.
Platform Type Analysis
Social Video Dominates with 38.4% Revenue Share
YouTube Long-Form and TikTok Short-Form Drive the Dual-Engine Growth Model
| Platform Type | Share % | Primary Driver |
|---|---|---|
| Social Video (YouTube / TikTok) | 38.4% | Ad revenue share, brand deals, and subscriber content monetization at scale |
| Livestreaming (Twitch / YouTube Live) | 19.2% | Donation, subscription, and brand sponsorship revenue in real-time social media engagement |
| Podcasting (Spotify / Apple / RSS) | 14.6% | Host-read advertising, dynamic ad insertion, and premium subscription content monetization |
| Short-Form Video (Reels / Shorts / TikTok) | 13.8% | Creator Fund programs and brand partnership integration in high-velocity social media formats |
| Newsletter & Blog (Substack / Beehiiv) | 8.1% | Paid subscription growth and premium sponsor access to high-intent audiences |
| Gaming Content (Twitch / YouTube Gaming) | 5.9% | Bits, channel subscriptions, and endemic gaming advertiser brand partnerships |
Social Video holds a 38.4% platform revenue share in 2026, making it the dominant content monetization channel in the U.S. creator economy. YouTube’s Partner Program distributes more than USD 20 billion annually to creators, with U.S. creators receiving the largest allocation. TikTok’s Creator Rewards Program was restructured in 2024 to pay creators based on qualified video views rather than flat impressions, improving earnings and accelerating migration from legacy platforms.
Podcasting delivers the highest average revenue per creator segment. The top 1,000 U.S. podcasters average USD 185,000 annually per show, while host-read advertising commands CPMs of USD 25 to USD 65 versus USD 3 to USD 12 for programmatic audio. Newsletter platforms like Substack represent premium monetization, where the top 250 U.S. publications each generate more than USD 1 million annually.
Revenue Model Analysis
Brand Partnerships Lead with 42.3% Share of Creator Content Monetization Revenue
Influencer Marketing Spend Surpasses USD 34.1 Billion as Attribution Measurement Matures
| Revenue Model | Share % | Primary Driver |
|---|---|---|
| Brand Partnerships & Sponsorships | 42.3% | Influencer marketing budget rotation from traditional media, measurable content monetization attribution |
| Platform Monetization (AdSense / Creator Funds) | 24.7% | YouTube Partner Program, TikTok Creator Rewards, Twitch ads, Spotify payouts |
| Fan Subscriptions & Memberships | 18.6% | Patreon, channel memberships, Substack paid, and direct social media creator income |
| Direct Commerce & Merchandise | 9.8% | Creator-branded merchandise, digital products, and live social commerce content monetization |
| Licensing & IP Monetization | 4.6% | Content licensing, IP franchise deals, and music synchronization royalties |
Brand Partnerships hold a 42.3% revenue share in 2026, making sponsored content the single largest content monetization category in the U.S. creator economy. The U.S. influencer marketing industry reached USD 34.1 billion in 2026 according to eMarketer tracking data, up from USD 21.1 billion in 2023. Financial services, consumer technology, beauty and personal care, and direct-to-consumer food and beverage brands are the highest-spending advertiser categories on social media creator platforms. Brands executing creator partnership programs at scale report average engagement rates of 3.8% to 6.2% versus 0.4% to 0.9% for standard programmatic display placements — a content monetization performance differential that continues to widen.
Fan Subscriptions represent the highest-growth content monetization model by percentage change in 2026, expanding at 28.4% annually. Patreon processed more than USD 3.5 billion in creator payments in 2025. YouTube’s channel membership program generated USD 2.1 billion in creator payouts during the same period. The structural driver is creator income diversification motivation — creators experiencing social media platform algorithm disruptions use subscription revenue as a content monetization stability buffer, creating a self-reinforcing adoption cycle unlikely to decelerate before 2032.
Creator Tier Analysis
Macro and Mega Creators Capture 59.6% of Total Creator Economy Revenue
Micro-Creator Brand Partnerships Accelerate as Niche Social Media Audience Value Rises
| Creator Tier | Followers | Revenue Share | Primary Content Monetization Driver |
|---|---|---|---|
| Mega / Celebrity | 10M+ | 31.2% | Enterprise brand deals, licensing, and merchandise at premium rate cards |
| Macro | 1M–10M | 28.4% | Multi-platform brand partnerships and audience subscription content monetization |
| Mid-Tier | 100K–1M | 22.7% | Niche brand sponsorships, affiliate programs, and Patreon subscription income |
| Micro | 10K–100K | 12.8% | High-engagement affiliate marketing, local brand partnerships, digital product sales |
| Nano | <10K | 4.9% | Affiliate commissions, direct fan patronage, and platform creator fund payouts |
Mega and Macro creators collectively hold 59.6% of U.S. creator economy revenue in 2026. Scale creates compounding advantages in brand deal rate card negotiation, social media platform algorithm favorability, and merchandise distribution access. The top 100 individual creators in the United States collectively earned more than USD 3.2 billion in 2025 from all content monetization channels combined. MrBeast’s creator business — generating an estimated USD 700 million in 2025 revenue through YouTube, merchandise, Feastables, and brand partnerships — represents the highest individual creator content monetization output achieved to date in the U.S. market.
Micro-Creator demand from brand advertisers is the fastest-growing segment by number of active brand partnership relationships. Brands executing micro-creator programs at scale report 3.2 times higher engagement rates per dollar of partnership spend versus macro-creator placements on social media platforms. Performance marketing platforms including CreatorIQ, Grin, and Aspire now enable brands to manage 5,000 to 15,000 simultaneous micro-creator partnerships through automated contract, content review, and payment workflows — removing the operational barrier that previously limited micro-creator content monetization program scale.
Content Category Analysis: Eight Segments Driving Creator Economy Revenue
Finance, Education, and Gaming Lead Revenue-Per-Creator Across Social Media Platforms
Category-by-Category Content Monetization Benchmarks for 2026
| Content Category | Revenue Share % | Avg. Annual Creator Income | Top Content Monetization Model |
|---|---|---|---|
| Entertainment & Comedy | 24.1% | USD 38,200 | Platform ads, brand integrations, merchandise |
| Gaming & Esports | 18.6% | USD 44,700 | Twitch subscriptions, sponsorships, tournament content |
| Beauty, Fashion & Lifestyle | 17.2% | USD 52,400 | Brand partnerships, affiliate commerce, social media shop |
| Finance, Investing & Business | 12.4% | USD 87,600 | Newsletter subscriptions, course sales, B2B brand partnerships |
| Education & Online Learning | 11.3% | USD 63,100 | Course platform revenue, Patreon, sponsor deals |
| Health, Wellness & Fitness | 9.2% | USD 41,800 | Brand partnerships, app subscriptions, digital product sales |
| Food & Cooking | 4.8% | USD 29,300 | Brand sponsorships, social media shop, cookbook licensing |
| Travel & Adventure | 2.4% | USD 31,700 | Tourism board deals, affiliate commissions, merchandise |
Entertainment and Comedy content holds the largest audience reach share on social media platforms, representing 24.1% of creator economy revenue. Despite its audience scale, it delivers lower average annual creator income than specialist categories because platform ad CPMs for entertainment content average USD 3.20 to USD 6.80 per thousand views — significantly below finance or education content CPMs of USD 12.40 to USD 28.60. Content monetization efficiency, not audience size, is the primary income driver in specialized creator economy niches.
Finance, Investing, and Business creators generate the highest average annual income at USD 87,600 per active professional creator in 2026, driven by three structural monetization advantages. First, audience intent is transactional, with users actively seeking financial tools and services, enabling premium CPM rates. Second, revenue from newsletters and courses operates independently of platform algorithms. Third, strong B2B demand from fintech and software brands creates advertiser competition, pushing rate card premiums 3.4 times above general creator economy averages.
Gaming and esports creator content monetization represents one of the most diversified revenue models in the creator economy. Revenue streams include Twitch subscriptions, Bits donations, brand sponsorships from endemic gaming advertisers, tournament participation fees, and YouTube long-form content monetization. Gaming creators averaging 25,000 concurrent viewers on Twitch typically earn between USD 180,000 and USD 420,000 annually from subscriptions alone, excluding brand partnerships and social media earnings, while resilient to cycles.
Beauty and fashion content monetization is rapidly transforming through live social commerce. Beauty creators on TikTok Shop hosting weekly live shopping streams generate average gross merchandise value of USD 22,000 to USD 145,000 per stream, depending on audience scale and product margins. Integrated in-platform purchasing enables seamless transactions without redirects, delivering higher gross margins than traditional affiliate models and driving strong category growth at 34.2% annually.
Monetization Channel Analysis
Five Revenue Channels Define How U.S. Creators Generate Income in 2026
Advertising Revenue Share, Fan Subscriptions, Affiliate Marketing, Digital Products and Live Events — Channel-by-Channel Breakdown
| Monetization Channel | Revenue Share % | Avg. CPM / Rate | Growth Rate (YoY) | Top Platform / Tool |
|---|---|---|---|---|
| Advertising Revenue Share | 28.4% | USD 3.20 to USD 18.60 CPM | 11.2% | YouTube Partner Program, TikTok Creator Rewards, Spotify Ads |
| Brand Partnerships & Sponsored Content | 26.1% | USD 400 to USD 2.5M per deal | 17.8% | CreatorIQ, Grin, Aspire, Meta Creator Marketplace |
| Fan Subscriptions & Memberships | 18.9% | USD 5 to USD 49.99 per month | 28.4% | Patreon, YouTube Memberships, Substack, Twitch Subs |
| Affiliate Marketing Commissions | 12.7% | 8% to 20% revenue commission | 22.3% | Amazon Associates, LTK, ShopMy, ShareASale |
| Digital Products & Online Courses | 9.4% | USD 47 to USD 2,000 per product | 31.6% | Teachable, Kajabi, Gumroad, Beehiiv Boosts |
| Live Events & Experiences | 4.5% | USD 25 to USD 500 per ticket | 14.9% | Eventbrite, Ticketmaster, TikTok Live, YouTube Live |
Advertising Revenue Share holds a 28.4% channel share and remains the most widely accessible content monetization entry point for creators across all tiers. YouTube Partner Program CPM rates range from USD 3.20 for entertainment and gaming content to USD 18.60 for finance and business content, a 5.8x CPM differential that directly explains the income gap between content categories. TikTok Creator Rewards Program pays USD 0.02 to USD 0.04 per 1,000 qualified views, structurally lower than YouTube CPMs but compensated by significantly higher organic reach velocity. Spotify podcast advertising delivers CPMs of USD 25 to USD 65 for host-read placements, making audio the highest per-impression advertising revenue channel in 2026.
Fan subscriptions and memberships are the fastest-growing monetization channel, expanding 28.4% year-over-year, driven by income diversification and improved subscription infrastructure. Patreon averages USD 14.80 monthly per patron (2025). YouTube memberships average USD 4.99, with a 30% fee, yielding USD 3.49 net. Substack averages USD 8.40, while premium tiers reach USD 20–50 monthly. Subscription income above 25% reduces creator revenue volatility during algorithm or advertising disruptions.
Affiliate marketing commissions are the most accessible performance-based monetization channel for creators below the 10,000-follower threshold required for most brand partnerships. Amazon Associates offers commissions of 1% to 10% by category, while LTK and ShopMy provide 8% to 20% rates with real-time attribution dashboards. The affiliate channel is expanding at 22.3% annually as TikTok Shop, YouTube Shopping, and Instagram product tagging streamline purchases. Micro-creators earn USD 18,400 in affiliate income.
Digital products and online courses are the highest-gross-margin monetization channel for U.S. creators, with margins of 78% to 94% compared to 35% to 55% for physical merchandise. The channel is growing at 31.6% annually, supported by platforms like Kajabi, Teachable, Gumroad, and Beehiiv. Finance creators selling courses priced USD 297 to USD 1,997 typically generate USD 84,000 to USD 340,000 per launch from engaged email audiences.
Live Events and Experiences account for the smallest revenue share at 4.5% in the creator economy but deliver the deepest creator-to-audience relationships. Creators hosting in-person meetups and workshops achieve audience lifetime value scores 4.2 times higher than those relying only on social media. TikTok Live and YouTube Live events generate USD 2.99 to USD 49.99 per viewer, while top streams earn USD 80,000 to USD 600,000. The channel is expanding at 14.9% annually, boosting subscription retention and strengthening monetization performance.
Channel Mix Insight: Professional creators generating more than USD 250,000 annually operate across an average of 4.1 distinct monetization channels. No single channel exceeds 38% of total income for top-earning creators — income diversification across channels is the defining characteristic of financially sustainable creator businesses in 2026.
Regional Analysis of the U.S. Creator Economy Market
West Coast Leads Creator Economy Revenue; Southeast Is the Fastest-Growing Geography
| U.S. Region | Share % | Key Driver |
|---|---|---|
| West Coast (CA, WA, OR) | 34.2% | Los Angeles creator studio ecosystem, Silicon Valley platform HQs, TikTok House social media culture |
| Northeast (NY, MA, CT, NJ) | 28.6% | Media industry infrastructure, fashion and finance content monetization hubs, podcast production |
| Southeast (FL, GA, TN, NC) | 19.4% | Miami creator migration, Nashville music creator ecosystem, Atlanta entertainment and social media hub |
| Midwest & Central (TX, IL, OH, CO) | 17.8% | Austin creator tech community, Chicago lifestyle content monetization, Dallas commerce creators |
The West Coast holds the largest U.S. regional share of creator economy revenue at 34.2%. Los Angeles is the dominant physical hub for video creator production, talent management, and brand-to-creator deal origination. The city hosts more than 12,000 full-time professional content creators, 340 creator management agencies, and 180 branded creator studio facilities as of 2026. Hollywood’s transition from traditional entertainment production toward creator-first social media content monetization accelerates annually. Top 100 YouTube creators are disproportionately Los Angeles-based due to production infrastructure access, talent density, and proximity to Fortune 500 brand marketing decision-makers who control creator economy partnership budgets.
San Francisco and Seattle contribute materially to West Coast creator economy revenue through platform proximity advantages. YouTube, Twitch, LinkedIn, and X are headquartered in the Bay Area. TikTok’s U.S. operations are concentrated in Los Angeles and New York. Creators in platform-adjacent geographies gain earlier access to monetization beta programs, algorithm insights, and creator partnership invite lists. This geographic information advantage compounds over time into measurable content monetization revenue advantages for West Coast creators relative to peers in non-platform geographies.
The Southeast region is the fastest-growing creator economy geography through 2035, expanding at an estimated 31% annually. Miami attracted the highest net creator in-migration in 2024 and 2025 due to zero state income tax, favorable climate, and expanding creator infrastructure. About 6,800 full-time creators relocated there between 2022 and 2026. Meanwhile, Nashville hosts 4,200 creators, while Atlanta benefits from strong entertainment industry networks and advanced studio infrastructure supporting content production growth.
The Midwest and Central region, anchored by Austin, Chicago, Dallas, and Denver, represents a structurally underpenetrated creator economy geography with rapidly growing infrastructure. Austin’s technology ecosystem creates natural content monetization alignment for B2B creator content targeting technology, startup, and finance audiences. Dallas hosts a growing creator economy infrastructure cluster driven by fashion, lifestyle, and e-commerce brand partnership demand. Chicago’s media legacy creates advantages for journalism-adjacent creator content including investigative reporting newsletters and documentary-style social media content monetization formats. Colorado’s outdoor and health-wellness creator community is expanding in alignment with national health and wellness brand marketing budget growth.
Key Companies: Platforms and Tools Defining the Competitive Landscape
Seven platform ecosystems dominate U.S. creator economy content monetization infrastructure. Each holds a differentiated position based on content format dominance, creator payment economics, or monetization tool depth. Creator management platforms and brand partnership software represent the second competitive layer — CreatorIQ, Grin, Aspire, and LTK collectively process tens of billions of dollars in brand partnership transactions annually across social media and direct creator channels.
| Company | Platform / Signal | Key Differentiator | 2026 Status |
|---|---|---|---|
| YouTube / Google | Partner Program; YouTube Shopping | Largest creator payout pool; USD 20B+ annual global content monetization payments | Market leader |
| TikTok / ByteDance | Creator Rewards Program; TikTok Shop | Highest U.S. engagement rates; live social commerce content monetization at scale | 170M+ U.S. MAU |
| Meta (Instagram / Facebook) | Creator Marketplace; Reels Bonus | Cross-platform creator tools; Facebook Stars; Instagram subscription content monetization | 3B+ global MAU |
| Spotify | Podcast Ads Marketplace; Megaphone | Dynamic ad insertion; Anchor creator tools; podcast subscription content monetization paywall | Podcast market leader |
| Patreon | Membership platform; creator analytics | USD 3.5B+ creator payouts; largest fan subscription content monetization infrastructure | Series E funded |
| Twitch / Amazon | Subscriptions; Bits; ad revenue share | Dominant live gaming social media platform; Prime Gaming subscription bundle | 35M daily active viewers |
| Substack | Paid newsletter subscriptions | 3M+ paid subscriptions; writer-owned audience; no social media algorithm dependency | Profitable 2025 |
| Shopify | Creator storefronts; Linkpop | Commerce infrastructure for 80,000+ creator-owned content monetization product businesses | Creator Commerce leader |
YouTube maintains the highest total payout position in U.S. creator content monetization. Its advertising revenue share model — supplemented by channel memberships, Super Thanks, and YouTube Shopping affiliate revenue — creates the most diversified single-platform content monetization income structure available. TikTok’s Creator Rewards Program delivered an average of USD 0.02 to USD 0.04 per 1,000 qualified views in 2025, a significant improvement over the prior Creator Fund. The restructured social media content monetization program has materially improved top creator retention on TikTok against YouTube competition, particularly among mid-tier creators with 100,000 to 1 million followers.
Competitive moats in creator economy platform infrastructure deepen on three structural dimensions. Social media platform audience lock-in creates switching costs once creators accumulate subscribers, watch history, and algorithmic momentum within a specific ecosystem. Content monetization tool integrations between platforms, commerce infrastructure, and fan management systems create compounding revenue advantages. Creator community and culture alignment creates social switching costs where creators maintain platform presence to remain relevant within creator peer networks. Platforms leading all three dimensions will maintain dominant content monetization market positions through 2032.
Related Markets: Five Segments Shaping Creator Economy Content Monetization Growth
Five adjacent markets intersect directly with the U.S. creator economy. Each has distinct growth dynamics and technology investment exposure. All share the same upstream infrastructure: AI content generation tools, cloud video processing, social media audience analytics platforms, and digital content monetization payment systems.
- Influencer Marketing Platform Market: Valued at USD 21.1 billion globally in 2025. Forecast to reach USD 92.4 billion by 2035 at 15.9% CAGR. Creator partnership management platforms including CreatorIQ, Grin, Aspire, and LTK are the operational backbone of brand-creator content monetization collaboration at enterprise scale. Consolidation is accelerating as brands demand single-vendor end-to-end campaign management across social media platforms.
- Live Social Commerce Market: Valued at USD 8.3 billion in the U.S. in 2026. Forecast to reach USD 67.4 billion by 2035 at 26.1% CAGR. TikTok Shop and YouTube Shopping are creating a new creator content monetization category that merges social media entertainment with real-time transactional commerce. Creator hosts generate 6 to 11 times higher product conversion rates than static e-commerce listings.
- Podcast Advertising Market: Valued at USD 4.2 billion in the U.S. in 2026. Expected to grow at 14.7% CAGR through 2035. Dynamic ad insertion and programmatic podcast advertising are professionalizing creator audio content monetization and expanding brand access to niche social media creator audiences at scale.
- AI Content Creation Tools Market: Valued at USD 6.1 billion globally in 2026. Projected to grow at 31.2% CAGR through 2035. AI tools including Adobe Firefly, ElevenLabs, RunwayML, Descript, and CapCut’s AI suite are reducing content monetization production costs and expanding creator output capacity. Adoption among professional creators reached 67% in 2026.
- Digital Merchandise & Creator Commerce Market: Valued at USD 7.8 billion in the U.S. in 2026. Forecast to grow at 17.3% CAGR through 2035. Shopify, Spring (Teespring), and Printful enable creator-branded content monetization product businesses with minimal inventory investment, expanding from apparel into digital products, physical goods with IP licensing, and subscription box formats.
Key Growth Drivers of the U.S. Creator Economy Market
Brand Budget Rotation, AI Productivity Tools, and Fan Content Monetization Infrastructure Drive Structural Growth
Brand marketing budget rotation has become a primary demand driver in the creator economy. The Interactive Advertising Bureau’s 2025 Annual Report recorded a 23% year-over-year increase in creator and influencer marketing investment among surveyed U.S. brands, while traditional television advertising spend declined 8% as audiences shifted toward social media and creator content. At the same time, digital advertising CPMs on programmatic platforms compressed 14% due to cookie deprecation and signal loss, pushing brands toward creator partnerships that offer deterministic first-party audience data and stronger contextual brand safety.
Performance evidence now strongly favors creator collaborations. Studies show creator video content delivers 11 times higher purchase intent lift than standard pre-roll advertising, with brand recall rates averaging 71% compared to 38% for display ads. Shopify data indicates creator-referred purchase conversion rates of 4.2% versus 1.8% for non-creator digital channels. Additionally, AI tools reduce production time by 43%, increase output by 28%, and live commerce streams generate USD 18,000 to USD 240,000 per session.
Market Restraints
Social Media Platform Algorithm Dependency and Income Volatility Constrain Scaling
Social media platform algorithm dependency is a primary structural risk to creator income stability. Revenue tied to platform monetization programs remains vulnerable to algorithm reach changes, content policy shifts, and platform financial pressures. YouTube’s 2025 monetization policy update demonetized videos across eight newly restricted topics, impacting about 340,000 creator channels. TikTok’s regulatory uncertainty in the U.S. triggered recurring creator migration concerns during 2024 and 2025, disrupting brand partnership planning. Creators earning more than 70% of income from a single platform face significant monetization volatility risk.
Income inequality is another constraint on market growth. The top 1% of U.S. creators capture roughly 67% of total income, while the bottom 50% earn under USD 2,400 annually. Brand safety concerns and creator controversies can pause advertiser spending for 60 to 120 days periods.
Market Opportunities
AI Tools, Live Commerce, and B2B Creator Content Monetization Unlock Premium Revenue Segments
B2B creator content monetization represents one of the highest-margin untapped opportunities in the U.S. creator economy. Platforms such as LinkedIn enable creator monetization programs, while B2B podcast advertising and thought leadership newsletter sponsorships generate premium CPMs of USD 40 to USD 120 per thousand impressions, compared with USD 8 to USD 22 for consumer creator content on mainstream social media. Enterprise brands including Salesforce, HubSpot, and Shopify have shifted approximately 18% to 26% of their total digital marketing budgets toward creator and influencer channels since 2023, reflecting the migration of executive audiences from traditional trade publications to creator-led formats.
Creator education and online learning is also expanding as a direct monetization model independent of platform algorithms. The U.S. online learning market is projected to exceed USD 65 billion by 2030. Creator-developed courses on platforms like Teachable, Kajabi, and Coursera can generate USD 50,000 to USD 2 million annually.
Creator Economy Monetization Stack & Revenue Diversification Framework
Multi-Channel Content Monetization Architecture Defines the Professional Creator Business Model in 2026
The professional creator business model in 2026 is built on a multi-channel content monetization stack rather than dependence on a single social media income stream. Full-time creators with stable earnings typically operate across an average of 3.7 monetization channels simultaneously. A resilient structure follows a clear layering pattern: social media monetization forms the base layer; brand partnerships deliver the highest per-engagement income; fan subscriptions create recurring predictable revenue; and digital products or commerce provide scalable income with the strongest long-term margin potential.
The financial logic of diversification is measurable. A creator earning USD 180,000 annually from YouTube ads alone faces significant risk from algorithm or policy changes. Diversifying across ads, two brand retainers, a Patreon community, and an online course can produce the same income while keeping no single revenue source above 35% of total earnings. Platforms such as Beehiiv, Circle, and Kajabi have invested heavily in tools that reduce operational complexity, lowering the audience size needed for sustainability.
Investor funding has also expanded. Andreessen Horowitz, Lightspeed, and General Catalyst made multiple creator infrastructure investments in 2024 and 2025. Global platform investment exceeded USD 4.2 billion in 2025 worldwide.
Brand-Creator Partnership Economics: ROI Measurement & Campaign Performance Framework
Content Monetization Attribution Maturation Unlocks Larger Brand Budget Commitments to Social Media Creator Channels
The most important structural development in the creator economy over the past 36 months is the resolution of brand-side ROI measurement uncertainty around creator content monetization. Chief Marketing Officers who once treated creator partnerships as unmeasured brand awareness investments can now access deterministic performance attribution. Platforms such as CreatorIQ, Grin, and Aspire provide campaign-level ROAS, CPM, CPC, conversion rate, and revenue attribution comparable to ad measurement, accelerating into creator monetization channels.
Brand partnership rate cards vary by tier. Mega-creator YouTube integrations for campaigns average USD 500,000 to USD 2.5 million per campaign. Macro-creator placements average USD 25,000 to USD 180,000 per integration. Mid-tier deals average USD 3,500 to USD 24,000 per post, while micro-creator partnerships average USD 400 to USD 3,200. Micro and mid-tier programs managed at scale outperform mega creators on cost-per-acquisition by 2.4 to 3.8 times.
Performance-based contracts are expanding. Affiliate models offering 8% to 20% commissions and hybrid structures deliver 31% higher quality and 28% lower acquisition costs.
Creator Economy Regulatory & Compliance Framework
FTC Disclosure Rules, Content Taxation, and AI Transparency Standards Shape 2026–2035 Compliance Requirements
The regulatory environment for U.S. creator monetization is evolving rapidly. The Federal Trade Commission updated its Endorsement and Testimonial Guides in 2023, expanding disclosure rules across livestreams, short videos, podcasts, and newsletters. Creators must clearly disclose brand partnerships, with enforcement shifting toward direct creator action in 2024–2025. Those with over 100,000 followers are key targets for violations.
State-level taxation adds complexity, as creators earning across all 50 states may face multi-state nexus obligations. California AB 5 has increased classification uncertainty, while New York Digital Content Creator Transparency Act may introduce stricter disclosure and contract rules. Creators earning above USD 250,000 often hire specialized tax attorneys.
AI disclosure laws are emerging, with states advancing transparency rules in 2026. Creators using AI tools face evolving compliance expectations, likely standardized federally before 2028.
Latest Trends in the U.S. Creator Economy Market
AI Tool Adoption, Live Commerce Scaling, and Creator Fund Restructuring Reshape Content Monetization Platform Economics
AI-powered content creation tools are reshaping competition in creator monetization across social media platforms. Creators using RunwayML Gen-3, Adobe Firefly, ElevenLabs, and Descript’s AI editing suite produce content at two to four times the velocity of traditional workflows. Higher publishing frequency remains a statistically significant driver of audience growth in algorithm-driven discovery, giving AI-enabled creators advantages in volume, consistency, and revenue velocity. At the same time, AI democratizes production, expanding creator supply while raising audience quality expectations, with measurable platform-wide quality gains in 2025 and 2026.
Meanwhile, creator fund restructuring is changing income economics. Expanded Shorts monetization in 2024, TikTok Creator Rewards redesign in 2024, and Spotify’s 2025 streams threshold shift payouts toward larger engaged creators.
Recent Developments: YouTube, TikTok, and Patreon Lead 2025–2026
- March 2026 — YouTube expanded its Shopping affiliate content monetization program to all Partner Program members with more than 10,000 subscribers. Creators can now tag products from Google Merchant Center in both long-form and Shorts content, enabling direct commerce attribution from social media content at unprecedented scale.
- February 2026 — Patreon launched Patreon Commerce, a native digital product storefront integrated within creator membership pages. Creators can now sell courses, downloads, and digital goods directly through Patreon without third-party platforms, reducing content monetization revenue leakage from membership to external commerce tools.
- January 2026 — TikTok survived its U.S. legislative challenge through a Supreme Court ruling preserving ByteDance’s operational rights. The resolution removed material creator migration and brand partnership uncertainty that had suppressed creator economy investment decisions and content monetization planning since mid-2024.
- November 2025 — Beehiiv closed a USD 33 million Series B led by Lightspeed Venture Partners. The newsletter content monetization platform surpassed 100,000 active publishers and USD 120 million in annual paid subscription volume processed, establishing itself as the leading independent newsletter infrastructure platform for creator businesses.
- September 2025 — LinkedIn launched its Creator Accelerator Program nationally. The program provides USD 15,000 in creator support, platform analytics access, and brand partnership introductions to 1,000 selected B2B creators. LinkedIn creator posts now average 12 times the organic reach of standard company page updates across the social media platform.
- August 2025 — Meta launched the Creator Marketplace API, enabling brand partnership management platforms to programmatically access creator audience data and campaign performance analytics across social media channels. CreatorIQ and Aspire were first-wave integration partners, enabling enterprise brands to manage Meta creator partnerships within unified cross-platform content monetization campaign environments.
Competitive Landscape and SWOT Analysis
Market Concentration, Social Media Platform Power, and Creator Business Model Evolution in 2026
The U.S. creator economy competitive landscape is defined by social media platform concentration at the distribution layer and market fragmentation at the creator and content monetization tool layers. YouTube, TikTok, and Meta collectively control more than 71% of creator content consumption time in the United States. This concentration gives these three social media platforms disproportionate influence over creator income through algorithm changes, content monetization policy revisions, and content moderation decisions. The creator tool and monetization infrastructure layer is fragmented across hundreds of specialized platforms for email, commerce, subscription, analytics, and production, with consolidation ongoing as creators prefer integrated business operating systems over disconnected point solutions.
Strengths
- Massive and growing audience demand: Creator content captures 38%+ of adult digital media consumption time among 18-to-34-year-olds on social media platforms. Audience time allocation continues shifting from traditional media toward creator content, providing durable structural demand foundation.
- Proven brand partnership ROI: Nielsen, CreatorIQ, and Shopify have published comprehensive creator content monetization performance data showing 11x purchase intent lift and 4.2% conversion rates, accelerating brand budget rotation from traditional channels.
- AI productivity multiplier: AI production tools enable individual creators to produce professional-quality social media content at 2 to 4 times the velocity of pre-AI workflows, expanding creator supply and content library depth simultaneously.
- Diversified content monetization architecture: Professional creators now average 3.7 revenue channels, reducing social media platform concentration risk and creating more durable business models than were possible before 2022.
Weaknesses
- Social media platform algorithm dependency: Creator income remains partially dependent on social media platform algorithm performance that can change without notice. Algorithmic reach suppression events can reduce creator content monetization revenue by 40 to 80% within weeks.
- Extreme income inequality: The top 1% of creators capture 67% of total creator economy income. Median creator income remains below the U.S. federal poverty line, undermining the creator economy as a reliable career pathway for the majority of social media content participants.
- Brand safety volatility: Creator personal conduct risk creates unpredictable brand withdrawal events that suppress enterprise commitment to creator content monetization channels relative to controlled media environments.
Opportunities
- B2B creator content monetization expansion: LinkedIn, podcast, and newsletter creator economy serves professional audiences with CPMs of USD 40 to USD 120. This premium content monetization category is structurally underdeveloped relative to its total addressable market.
- Live social commerce infrastructure: TikTok Shop and YouTube Shopping live integration create a new creator content monetization revenue layer that scales with social media engagement depth rather than audience size alone.
- Creator education and online learning: Course platform revenue from creator-owned educational products can exceed USD 2 million annually for established expert creators, entirely independent of social media platform algorithm performance.
Threats
- Platform policy regulatory risk: Congressional scrutiny of TikTok, FTC enforcement of creator disclosures, and state AI content legislation create compliance cost and social media platform access uncertainty that suppresses creator investment planning.
- AI content monetization commoditization: Widespread AI content generation tools may reduce the value differentiation of human-created content in algorithm-driven social media distribution, compressing creator income per unit of content over time.
- Economic cycle sensitivity: Brand marketing budgets are among the first spending categories reduced during economic downturns. A U.S. recession scenario would compress brand partnership content monetization revenue that represents 42.3% of total creator economy income.
Key Market Segments
By Platform Type
- Social Video (YouTube / TikTok)
- Livestreaming (Twitch / YouTube Live)
- Podcasting (Spotify / Apple Podcasts / RSS)
- Short-Form Video (Instagram Reels / YouTube Shorts)
- Newsletter & Blog (Substack / Beehiiv / Ghost)
- Gaming Content (Twitch / YouTube Gaming)
By Revenue Model
- Brand Partnerships & Sponsorships
- Platform Content Monetization (AdSense / Creator Funds / Bits)
- Fan Subscriptions & Memberships
- Direct Commerce & Digital Products
- Licensing & IP Content Monetization
By Creator Tier
- Mega / Celebrity (10M+ followers)
- Macro (1M–10M followers)
- Mid-Tier (100K–1M followers)
- Micro (10K–100K followers)
- Nano (Under 10K followers)
By Content Category
- Entertainment & Comedy
- Gaming & Esports
- Beauty, Fashion & Lifestyle
- Finance, Investing & Business
- Education & Online Learning
- Health, Wellness & Fitness
- Food & Cooking
- Travel & Adventure
By Monetization Channel
- Advertising Revenue Share
- Affiliate Marketing Commissions
- Fan Subscriptions & Patronage
- Digital Product Sales (Courses, Templates, Downloads)
- Live Social Commerce & Event Ticket Revenue
Report Features
| Feature | Description |
|---|---|
| Market Value (2026) | USD 104.2 billion |
| Forecast Revenue (2035) | USD 525.67 billion |
| CAGR (2026–2035) | 19.7% |
| Base Year for Estimation | 2026 |
| Historic Period | 2020–2025 |
| Forecast Period | 2026–2035 |
| Report Coverage | Revenue Forecast, Social Media Platform Economics, Brand Partnership ROI, Content Monetization Stack Analysis, Regulatory Compliance, AI Tool Adoption, Content Category Deep Dive, Competitive Intelligence, SWOT Analysis |
| Segments Covered | By Platform Type, By Revenue Model, By Creator Tier, By Content Category (8 segments), By Monetization Channel |
| Regional Analysis | West Coast, Northeast, Southeast, Midwest & Central with metro-level creator data |
| Dominant Platform | Social Video with 38.4% revenue share |
| Dominant Revenue Model | Brand Partnerships & Sponsorships with 42.3% share |
| New Sections Added | Content Category Deep Dive (8 segments); Creator Content Monetization Stack Framework; Brand-Creator ROI Framework; Regulatory Compliance |
| Competitive Landscape | YouTube, TikTok, Meta, Spotify, Patreon, Twitch, Substack, Shopify, CreatorIQ, Grin, Aspire, LTK, Beehiiv |