What is the Compressed Air Energy Storage (CAES) Market Size?
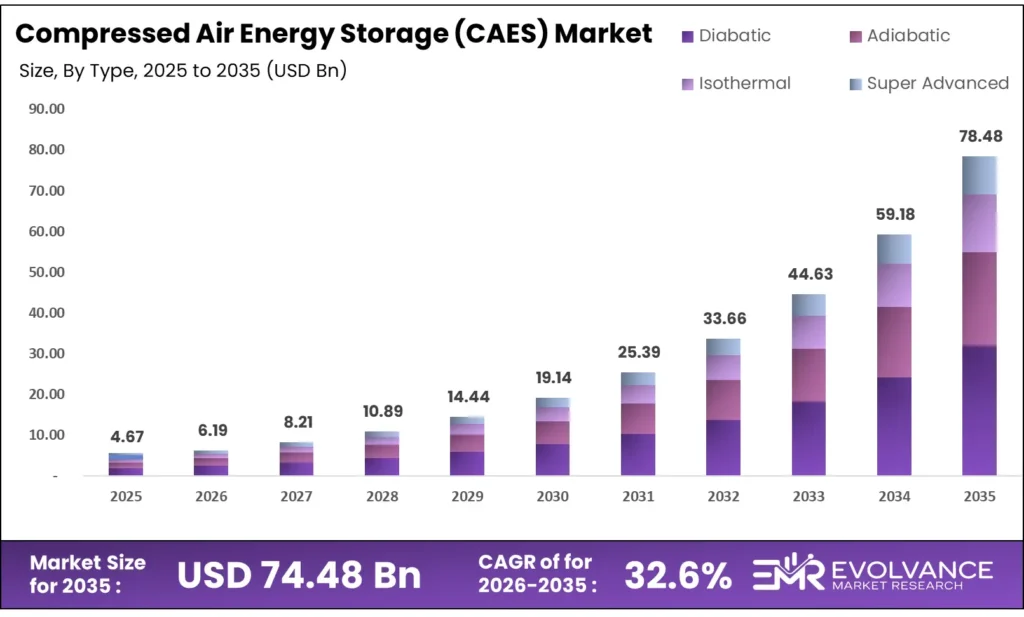
The Global Compressed Air Energy Storage (CAES) Market size will be worth around USD 74.48 Billion by 2035 from USD 4.67 Billion in 2025, growing at a CAGR of 32.6% during the forecast period 2026 to 2035. Utility-scale renewable mandates and grid reliability requirements are pushing power buyers toward long-duration storage assets. Enterprise procurement is shifting from lithium-ion to multi-hour storage, creating direct demand for CAES at the grid operator level. However, high upfront capital costs and limited suitable geological sites create real constraints for rapid deployment at scale.
Market Highlights
- The Global Compressed Air Energy Storage (CAES) Market valued at USD 4.67 Billion in 2025, reaching USD 74.48 Billion by 2035 at a CAGR of 32.6%.
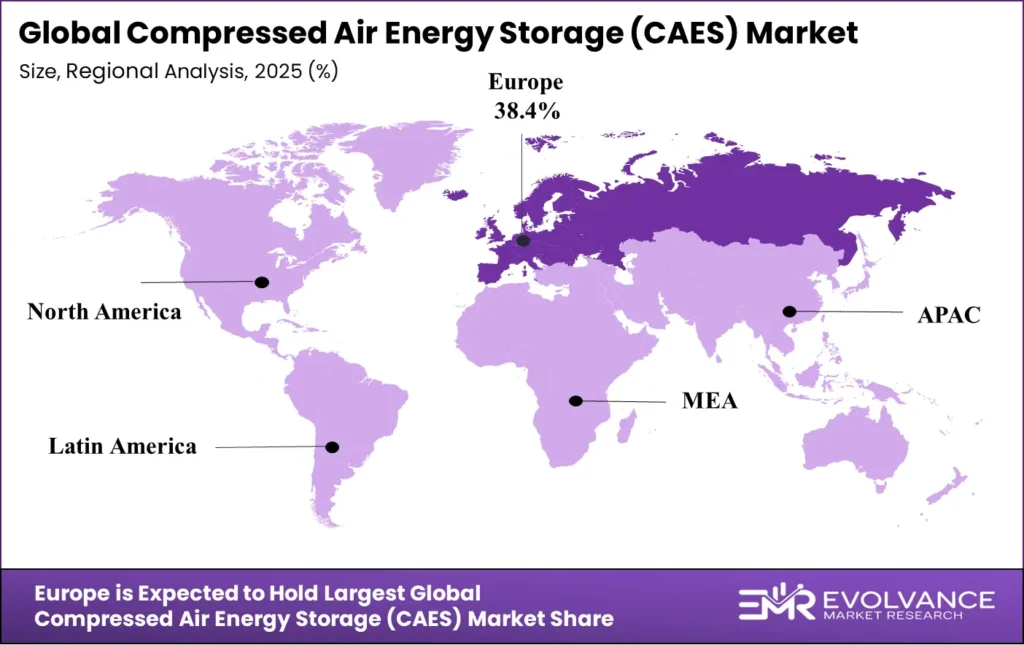
- Europe dominates with 38.4% market share, valued at USD 1.8 Billion.
- Diabatic CAES leads by type with 42.7% share; Small-scale (Below 10 MW) leads by power capacity with 67.3% share.
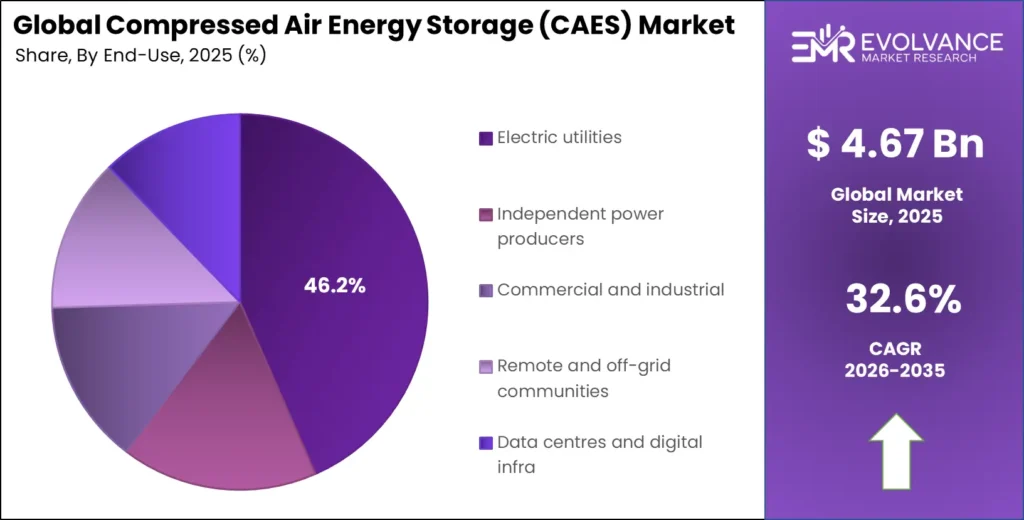
- Renewable-integration firming leads by application with 41.7% share; Electric utilities lead by end-user with 46.2% share.
- Salt-domed cavern leads by storage configuration with 39.4% share.
Market Overview
Compressed air energy storage (CAES) systems store electricity by compressing air into underground caverns or pressure vessels, then releasing it to drive turbines when power is needed. The technology bridges the gap between intermittent renewable generation and reliable grid energy storage dispatch. Unlike batteries, CAES installations operate with service lives of 30 to 40 years, making them compelling for long-term grid infrastructure investment.
CAES plants can deliver electricity discharge durations ranging from 2 to 30 hours, a range no current lithium-ion system can match at grid scale. This structural advantage positions CAES as a preferred solution for utilities managing large renewable portfolios. As solar and wind curtailment losses climb, grid operators face growing financial pressure to deploy storage that absorbs excess generation at scale.
- Government capital support is accelerating project development at a pace the private sector alone could not sustain. The US Department of Energy issued a $1.76 billion loan guarantee for the 500 MW / 4,000 MWh Willow Rock Advanced-CAES project, targeting 8-hour long-duration storage for the California grid. This single commitment signals that federal energy policy is now backing CAES as a bankable, utility-scale technology — reducing financing risk for developers and drawing in institutional capital.
According to the International Energy Agency, typical CAES systems store compressed air at pressures between 45 bar and 70 bar in caverns located between 500 and 800 meters underground. This physical specification matters commercially: only regions with suitable salt formations, hard rock, or aquifer geology can host utility-scale plants. The geological constraint is both the market’s core bottleneck and its strongest competitive moat for developers who secure sites early.
CAES system efficiency ranges from 40% to 60% depending on plant design and heat recovery technology. Despite lower efficiency than batteries, long-duration storage and lower lifetime costs make the Compressed Air Energy Storage (CAES) Market increasingly attractive for utilities. The market also supports the Carbon Capture, Utilization And Storage by enabling reliable large-scale energy storage for continuous carbon capture operations and grid stability.
Type Insights
Diabatic dominates with 42.7% due to proven commercial deployment and lower upfront technology risk.
In 2025, Diabatic CAES held a dominant market position in the By Type segment of the Compressed Air Energy Storage Market, with a 42.7% share. Its leadership reflects the fact that both large commercial plants currently operating globally — Huntorf in Germany and McIntosh in Alabama — use diabatic designs. Utilities and grid operators favor proven configurations when committing to long-duration infrastructure with 30-year asset lives, making diabatic the default starting point for new procurement decisions.
Adiabatic CAES represents the most commercially significant next-generation design, eliminating fossil fuel combustion by storing compression heat in thermal media such as molten salt. Industrial deployments targeting approximately 71% round-trip efficiency without natural gas use are closing the gap with conventional diabatic plants. As carbon pricing and decarbonization mandates tighten, adiabatic systems will shift from demonstration status to procurement-ready alternatives for large utilities.
Isothermal CAES maintains near-constant temperature during compression to reduce energy losses inherent in standard diabatic systems. This design targets higher theoretical efficiency, but commercial-scale deployment remains limited. Developers building on isothermal principles are attracting R&D investment from utilities seeking next-cycle storage options, particularly in markets where fossil fuel combustion faces regulatory barriers.
Super Advanced Isothermal CAES builds on isothermal designs with enhanced heat management and compression control systems. While still at early commercial stages, this configuration attracts attention in markets targeting storage systems capable of operating without any thermal losses. The Chinese Academy of Sciences recently developed a 101 MW high-efficiency CAES compressor achieving 10.1 MPa pressure and 88.1% efficiency, pointing toward a new performance ceiling for advanced CAES equipment.
Storage Configuration Insights
Salt-domed cavern dominates with 39.4% due to lower excavation costs and superior sealing properties.
In 2025, Salt-domed cavern held a dominant market position in the By Storage Configuration segment of the Compressed Air Energy Storage Market, with a 39.4% share. Salt caverns are solution-mined at lower cost than hard rock excavation and provide natural airtight seals under pressure. The Huai’an plant in Jiangsu, China — now the world’s largest CAES facility at 600 MW and 2,400 MWh — stores compressed air in salt caverns with volumes of about 980,000 cubic meters located 1,150 to 1,500 meters underground, demonstrating what salt geology enables at gigawatt scale.
Hard-rock or mined cavern storage suits regions lacking salt deposits but possessing stable granite or basalt formations. Hydrostor’s advanced compressed air storage technology targets hard-rock configurations, as demonstrated by the Silver City Energy Storage project in New South Wales, Australia, which carries 200 MW power capacity and 1,600 MWh storage. Hard-rock deployment unlocks markets across Europe, North America, and Australia where salt geology is absent but underground rock formations are viable.
Aquifer storage uses porous subsurface rock layers saturated with water as the containment medium for compressed air. This configuration expands the geographic reach of CAES beyond salt and hard-rock zones. However, aquifer systems require detailed geological surveys to confirm pressure containment integrity, raising pre-development costs and timelines compared to salt-cavern alternatives.
Abandoned mine and tunnel configurations repurpose existing underground infrastructure, reducing excavation costs significantly. These assets attract developers in coal-transition regions seeking to redeploy legacy infrastructure for energy storage. The economic case depends heavily on existing mine geometry and structural integrity, limiting this segment to specific geographies with documented underground networks.
Power Capacity Insights
Small-scale (Below 10 MW) dominates with 67.3% due to modular deployment flexibility and lower site requirements.
In 2025, Small-scale (Below 10 MW) held a dominant market position in the By Power Capacity segment of the Compressed Air Energy Storage Market, with a 67.3% share. This share reflects the large number of distributed and microgrid deployments across commercial, industrial, and remote-community applications where above-ground pressure vessels or small geological formations enable fast installation. Small-scale systems are not waiting for large cavern sites — they are deploying now in markets where speed-to-grid matters more than raw storage volume.
Medium-scale (10 to 100 MW) systems occupy the space between distributed microgrid solutions and utility-scale cavern plants. These configurations suit regional grid operators and independent power producers managing peak-shaving obligations or T&D deferral requirements. As project financing for mid-tier storage matures and geological surveys expand to identify additional cavern sites, medium-scale deployments will capture a growing share of new-build orders from utilities that lack the load profiles to justify gigawatt-class systems.
Application Insights
Renewable-integration firming dominates with 41.7% due to direct alignment with global wind and solar capacity additions.
In 2025, Renewable-integration firming held a dominant market position in the By Application segment of the Compressed Air Energy Storage Market, with a 41.7% share. Grid operators managing large solar and wind portfolios face curtailment losses and frequency instability when generation exceeds demand. The Huai’an CAES facility in China, operating at approximately 71% round-trip efficiency, generates about 792 million kWh annually for grid peak-shaving and frequency regulation — a live demonstration of renewable firming at scale that utilities globally are now benchmarking.
Peak-shaving and load-shifting applications use CAES to absorb low-cost off-peak electricity and release it during high-demand periods. This use case generates direct revenue through arbitrage in deregulated energy markets. As time-of-use pricing spreads across more grid regions, peak-shaving economics improve for CAES operators, drawing in commercial and industrial buyers who face punitive peak demand charges.
T&D deferral applications use distributed storage to delay or avoid expensive transmission and distribution upgrades. Grid planners facing capacity constraints in congested corridors find CAES installations more cost-effective than new line construction, particularly where land acquisition and permitting timelines extend upgrade schedules by years. This application creates a procurement pathway through regulated utility planning processes rather than merchant energy markets.
Backup and resilience or microgrid applications deploy CAES to provide standby power for critical facilities and isolated communities. Military bases, hospitals, data centers, and island grids represent high-value buyers with firm capacity requirements and limited tolerance for supply interruptions. Long discharge duration — up to 30 hours in well-sized systems — gives CAES a clear advantage over shorter-duration battery systems for multi-day resilience needs.
Industrial waste-heat recovery uses heat generated during compression cycles to serve industrial process needs, improving overall system efficiency. This co-generation approach makes CAES economically attractive to industrial buyers who can monetize both storage capacity and heat output simultaneously. Cement, steel, and chemical facilities with large on-site energy loads represent the most immediate target market for this application.
Power-to-X hydrogen hybrids integrate CAES with hydrogen production systems, using excess compressed air and electricity to drive electrolysis. This application links CAES to the hydrogen economy, positioning it as dual-function infrastructure that serves both grid balancing and clean fuel production. While still at early commercial stages, the application aligns with long-term decarbonization roadmaps in Europe and East Asia where hydrogen is a strategic energy carrier.
End-User Insights
Electric utilities dominate with 46.2% due to direct grid management obligations and large procurement capacity.
In 2025, Electric utilities held a dominant market position in the By End-User segment of the Compressed Air Energy Storage Market, with a 46.2% share. Regulated utilities have both the capital access and the regulatory mandate to procure long-duration storage assets at scale. The International Energy Agency reported approximately 5,175 MW of CAES capacity under planning in North America across eight projects — the bulk of which involves utility-sponsored development as utilities respond to state-level clean energy standards requiring multi-hour storage procurement.
Independent power producers (IPPs) participate in merchant energy markets where CAES arbitrage and capacity revenues generate returns. IPPs bring faster procurement cycles than regulated utilities, but face tighter financing constraints for capital-intensive CAES projects. As project finance structures for long-duration storage mature and government loan guarantees reduce development risk, IPP participation in utility-scale CAES development will expand.
Commercial and industrial buyers deploy CAES primarily for peak demand management and backup power at large facilities. Manufacturers, logistics hubs, and processing plants facing high energy costs and grid reliability risks are evaluating modular CAES systems as a controllable energy asset. Cost competitiveness against diesel generation and battery systems remains the key adoption barrier at this buyer segment.
Remote and off-grid communities represent a structurally underserved market where CAES offers a compelling alternative to diesel generation for islands, mining camps, and rural settlements. Long discharge duration is the decisive advantage: a CAES system can sustain a remote community through multi-day weather events where solar generation drops and battery reserves are exhausted. Capital cost and logistics remain the primary barriers to deployment in these markets.
Market Segments Covered in the Report
By Type
- Diabatic
- Adiabatic
- Isothermal
- Super Advanced Isothermal
By Storage Configuration
- Salt-domed cavern
- Hard-rock/mined cavern
- Aquifer
- Abandoned mine/tunnel
- Above-ground pressure vessel
- Underwater/seabed pipe
By Power Capacity
- Small-scale (Below 10 MW)
- Medium-scale (10 to 100 MW)
By Application
- Renewable-integration firming
- Peak-shaving and load-shifting
- T&D deferral
- Backup and resilience/microgrids
- Industrial waste-heat recovery
- Power-to-X hydrogen hybrids
By End-User
- Electric utilities
- Independent power producers
- Commercial and industrial
- Remote and off-grid communities
- Data centres and digital infra
Regional Insights
Europe Dominates the Compressed Air Energy Storage Market with a Market Share of 38.4%, Valued at USD 1.8 Billion
Europe leads with 38.4% market share and a valuation of USD 1.8 Billion, anchored by the Huntorf plant in Germany — the world’s first commercial CAES facility. Germany’s Huntorf operates with 321 MW generation capacity and approximately 1,200 MWh of storage in underground caverns. Europe’s regulatory push toward renewable integration and carbon neutrality makes it the most policy-aligned region for CAES procurement. The International Energy Agency reports approximately 1,100 MW of additional CAES capacity planned across five European projects, signaling sustained pipeline growth.
North America Compressed Air Energy Storage Market Trends
North America holds the second-largest position, driven by the McIntosh plant in Alabama — operational at 110 MW with approximately 2,860 MWh storage capacity and 26-hour discharge capability. The US DOE’s $1.76 billion loan guarantee for the Willow Rock project signals federal commitment to building the next generation of grid-scale CAES. The IEA reports approximately 5,175 MW of CAES capacity under development across eight North American projects — the largest pipeline globally and a clear signal of where the next wave of utility-scale deployments will emerge.
Asia Pacific Compressed Air Energy Storage Market Trends
Asia Pacific is the fastest-scaling region, led by China’s aggressive buildout of salt-cavern CAES infrastructure. The Huai’an facility in Jiangsu now holds the title of the world’s largest CAES plant at 600 MW and 2,400 MWh, surpassing Yingcheng’s 300 MW / 1,500 MWh system in Hubei. The Jintan project in Jiangsu adds two more units at 350 MW each with 2.8 GWh total storage. China’s pace of deployment is redefining global CAES benchmarks and compressing the technology’s cost curve for all markets.
Latin America Compressed Air Energy Storage Market Trends
Latin America is an emerging CAES market where large renewable energy targets and expanding grid infrastructure create conditions for long-duration storage adoption. Brazil and Mexico, the region’s largest power markets, are deploying solar and wind at scale, creating grid balancing requirements that CAES can serve. Geological surveys to identify suitable salt and hard-rock cavern sites remain early-stage, but project development activity is growing as regional power developers assess CAES options alongside battery storage alternatives.
Middle East & Africa Compressed Air Energy Storage Market Trends
The Middle East and Africa region holds early-stage CAES potential, particularly across GCC countries with large salt formations and industrial-scale power demand. Saudi Arabia and UAE are investing in renewable energy diversification, and long-duration storage is a strategic requirement for stabilizing these new generation portfolios. South Africa’s grid reliability challenges and large renewable energy ambitions create a specific demand signal for multi-hour storage systems that CAES can address where suitable geology is confirmed.
Key Regions and Countries
North America
- US
- Canada
Europe
- Germany
- France
- The UK
- Spain
- Italy
- Rest of Europe
Asia Pacific
- China
- Japan
- South Korea
- India
- Australia
- Rest of APAC
Latin America
- Brazil
- Mexico
- Rest of Latin America
Middle East & Africa
- GCC
- South Africa
- Rest of MEA
Regulatory Landscape
The US Department of Energy issued a $1.76 billion loan guarantee in 2024–2025 for the Willow Rock Advanced-CAES project under the Loan Programs Office mandate to support long-duration energy storage. This commitment directly de-risks private capital deployment into CAES infrastructure by converting federal credit support into bankable project finance. For developers and utilities, this policy signal means the US government has formally classified advanced CAES as eligible clean energy infrastructure.
China’s National Energy Administration has coordinated state-backed approvals for multiple multi-hundred-MW CAES projects since 2022, enabling construction of the Yingcheng, Huai’an, and Jintan facilities under national grid reliability and renewable integration mandates. The Chinese government treats CAES as strategic energy infrastructure, allocating land use rights and grid connection priority to approved projects. This regulatory framework has allowed China to deploy more CAES capacity in three years than the rest of the world built over three decades.
The European Union’s 2024 Net-Zero Industry Act and revised Renewable Energy Directive require member states to accelerate long-duration energy storage procurement as part of grid stability planning. Germany’s existing salt-cavern CAES infrastructure at Huntorf benefits from regulatory continuity, while new EU storage targets create procurement obligations that favor CAES at the multi-hundred-MW scale. The 1,100 MW of European CAES capacity under planning reflects how regulatory mandates translate directly into project pipelines.
Australia’s Capacity Investment Scheme, active since 2023, provides revenue underwriting for dispatchable clean energy projects including long-duration storage. Hydrostor’s Silver City project in New South Wales is structured around this scheme, making it a model for how state-backed revenue guarantees enable CAES project financing. As more jurisdictions adopt capacity mechanism frameworks, CAES developers gain a repeatable financing pathway that reduces merchant revenue risk during the early operational years of new plants.
Compressed Air Energy Storage (CAES) Market Dynamics
Drivers
Government Capital Support and Gigawatt-Scale Deployments Are Validating CAES as Utility Infrastructure
The US DOE’s $1.76 billion loan guarantee for the Willow Rock project is not just funding — it is a credit signal that reclassifies CAES from an experimental technology to bankable grid infrastructure. When a federal agency backs a 500 MW / 4,000 MWh project with sovereign credit, institutional lenders and pension funds can follow with project finance at commercial rates. This shifts the CAES investment case from technology risk to execution risk — a material change for private capital allocation.
- China’s commissioning of the Huai’an CAES plant in Jiangsu at 600 MW and 2,400 MWh — with an estimated project investment of $520 million and expected annual output of 792 GWh — provides the global benchmark that project sponsors elsewhere now reference for cost modeling. This single project proves that salt-cavern CAES can operate at scale with approximately 71% round-trip efficiency and deliver measurable grid services. Utilities in Europe and North America are now comparing Huai’an’s performance data against their own procurement models.
Moreover, China’s Jintan Salt Cavern project is adding two more units at 350 MW each with up to 2.8 GWh total storage capacity and approximately 330 annual charge-discharge cycles. This level of operational intensity demonstrates that salt-cavern CAES can deliver the cycling performance required for daily renewable-firming duty rather than just occasional peak coverage. For grid planners globally, this operational evidence is more persuasive than any modeling study.
Restraints
High Capital Costs and Geological Site Limits Constrain How Fast the Market Can Scale
A 2025 academic cost analysis identified economic viability challenges for long-duration CAES stemming from high upfront capital costs and limited revenue streams in current electricity markets. Unlike batteries, which can be deployed at any location with grid access, CAES plants require specific underground geology — salt formations, hard rock, or suitable aquifer structures — found only in select regions. This geological dependency creates a hard ceiling on deployable capacity regardless of market demand.
The financial structure of CAES projects compounds the capital challenge. Plants require large upfront engineering, geological assessment, and civil construction costs before generating any revenue. In deregulated energy markets without long-term capacity contracts or storage-specific revenue mechanisms, projects struggle to close financing. Only markets with regulatory frameworks that explicitly value long-duration storage — such as California, the UK, and Australia — currently provide the revenue certainty that CAES project finance requires.
Additionally, long development timelines intensify the capital burden. Geological surveys, permitting, site preparation, and plant construction for a utility-scale CAES facility typically span five to ten years. During this period, project sponsors carry pre-construction costs without revenue offset. Developers who cannot secure early-stage government support or anchor off-take agreements face a high risk of project abandonment before construction begins, limiting new entrant participation in the market.
Growth Factors
Long-Duration Storage Mandates and Industrial Adiabatic Designs Are Opening New Revenue Streams
CAES systems can be designed to deliver storage capacities ranging from approximately 50 MWh to 27,000 MWh per installation, according to IEA storage technology data. This range maps directly onto long-duration energy storage (LDES) market requirements, where multi-hour to multi-day storage beyond lithium-ion limits is the procurement target. As LDES markets formalize through regulatory mandates — particularly in California, the EU, and Australia — CAES sits at the top of the technology shortlist for utility-scale LDES procurement.
- Industrial deployment of adiabatic CAES systems using molten-salt and thermal water storage targets approximately 71% round-trip efficiency without fossil fuel combustion. This performance profile makes adiabatic CAES directly competitive with pumped hydro on efficiency grounds while avoiding the geographic constraints of hydroelectric sites. Hydrostor’s Silver City project in New South Wales, designed for 200 MW and 1,600 MWh, demonstrates that advanced CAES can attract $670 million in estimated local economic benefits — a value proposition that goes beyond energy alone to regional economic development.
Furthermore, breakthrough compression equipment is opening the efficiency frontier for all CAES configurations. The Chinese Academy of Sciences developed a 101 MW CAES compressor reaching 10.1 MPa pressure and 88.1% efficiency. When compressor efficiency at this scale reaches the mid-to-high eighties, the round-trip efficiency of next-generation CAES systems will challenge pumped hydro — historically considered the gold standard for bulk energy storage. Equipment suppliers who reach this milestone first gain a durable pricing advantage in the utility-scale storage equipment market.
Emerging Trends
Salt-Cavern Buildout and Non-Combustion Designs Are Setting the New Technical Standard for Grid Storage
China’s rapid scaling of salt-cavern CAES infrastructure is demonstrating a deployment model that other markets will replicate. The Jintan facility in Jiangsu stores compressed air in underground caverns exceeding approximately 1.2 million cubic meters — a storage volume that dwarfs any above-ground battery installation. When cavern volumes of this scale become the design reference, project engineers globally begin sizing their geological surveys and capital plans against Chinese benchmarks rather than the aging Huntorf and McIntosh templates from the 1970s and 1990s.
The shift toward adiabatic and non-combustion CAES designs is redefining what buyers can demand from storage contracts. Traditional diabatic plants burn natural gas to reheat compressed air during discharge, creating both carbon emissions and fuel price exposure. Next-generation designs eliminate this dependency entirely, allowing CAES plants to offer firm, zero-combustion capacity to utilities operating under strict decarbonization targets. This design shift is not incremental — it changes the regulatory classification and carbon accounting treatment of CAES output in jurisdictions with clean energy mandates.
Additionally, the emergence of gigawatt-scale CAES demonstration projects in the 4,000 MWh class — such as Willow Rock — is establishing a new scale threshold for how utilities conceptualize long-duration storage procurement. When a single project can store enough energy to power hundreds of thousands of homes for 8 or more hours, CAES moves from a grid-support tool to a primary dispatch asset. Early movers who secure geological sites capable of hosting gigawatt-class systems will control a scarce resource as the LDES market reaches scale.
Key Companies Insights
Hydrostor is the most commercially advanced developer of advanced compressed air energy storage outside China, with its proprietary A-CAES technology eliminating fossil fuel use during discharge. Its Silver City project in Broken Hill, New South Wales, targets 200 MW and 1,600 MWh of long-duration storage and is structured around Australia’s Capacity Investment Scheme revenue support. Hydrostor’s model — securing hard-rock geology, government revenue backing, and project finance — is the template that competing CAES developers are trying to replicate in North America and Europe.
Siemens AG brings turbomachinery engineering and global utility relationships to the CAES market through its industrial power division and its Dresser-Rand business unit. Siemens compressors and expanders are core components in both the Huntorf and McIntosh legacy plants, giving the company decades of operational performance data that new entrants cannot match. As utilities designing next-generation CAES plants look for proven equipment at the hundred-megawatt scale, Siemens’ equipment track record positions it as the default supplier for compression and expansion systems in regulated procurement processes.
Magnum Development focuses on salt-cavern development in the western United States, owning and operating a large portfolio of solution-mined caverns in Utah. Its strategic value in the CAES market is geological: it holds permitted, existing underground storage assets that eliminate the site development phase for CAES projects. For utilities and IPPs seeking to develop CAES in the US West — where California’s storage mandates create the largest near-term demand — Magnum’s cavern inventory represents a shortcut to project development that would otherwise require years of geological assessment and permitting.
Apex Compressed Air Energy Storage, LLC is a dedicated CAES project developer focused on bringing utility-scale projects to commercial operation in North America. The company’s project pipeline targets markets with the most supportive regulatory environments for long-duration storage procurement. Apex’s focus on CAES as a single-technology play — rather than a diversified storage portfolio — allows it to concentrate engineering, permitting, and financing expertise on salt-cavern configurations, where its geological partnerships give it a development-cycle advantage over generalist energy storage developers.
Key Companies
- Apex Compressed Air Energy Storage, LLC
- Bright Energy Storage Technologies
- Hydrostor
- Magnum Development
- Pacific Gas and Electric Company
- The Ridge Group
- Siemens AG
- STORELECTRIC LIMITED
- ALACAES
- Dresser-Rand – A Siemens Business
- General Compression Ltd.
- LightSail Energy
- SustainX
Recent Development
- March 2026 – China commissioned the Huai’an Salt Cavern CAES power station in Jiangsu Province, reaching 600 MW generation capacity and 2,400 MWh storage, making it the world’s largest operational CAES facility. The project required an estimated investment of $520 million and is expected to generate 792 GWh of electricity annually and reduce approximately 600,000 tons of CO2 emissions per year.
- January 2025 – China’s Yingcheng compressed air energy storage plant in Hubei Province commenced full operation with 300 MW power capacity and 1,500 MWh energy storage, supporting roughly 500 GWh annual electricity generation for the regional grid.
- In 2025 – The US Department of Energy issued a $1.76 billion loan guarantee for the Willow Rock Advanced-CAES Project, targeting 500 MW / 4,000 MWh long-duration storage with 8-hour grid dispatchability for the California grid.
- Ongoing – China’s Jintan Salt Cavern CAES project in Jiangsu Province is progressing with two units rated at 350 MW each and a total storage capacity of approximately 2.8 GWh per charge cycle, with approximately 330 annual charge-discharge cycles planned.
Market Scope
| Report Features | Description |
|---|---|
| Market Value (2025) | USD 4.67 Billion |
| Forecast Revenue (2035) | USD 74.48 Billion |
| CAGR (2026-2035) | 32.6% |
| Base Year for Estimation | 2025 |
| Historic Period | 2020-2024 |
| Forecast Period | 2026-2035 |
| Report Coverage | Revenue Forecast, Market Dynamics, Competitive Landscape, Recent Developments |
| Segments Covered | By Type (Diabatic, Adiabatic, Isothermal, Super Advanced Isothermal), By Storage Configuration (Salt-domed cavern, Hard-rock/mined cavern, Aquifer, Abandoned mine/tunnel, Above-ground pressure vessel, Underwater/seabed pipe), By Power Capacity (Small-scale Below 10 MW, Medium-scale 10 to 100 MW), By Application (Renewable-integration firming, Peak-shaving and load-shifting, T&D deferral, Backup and resilience/microgrids, Industrial waste-heat recovery, Power-to-X hydrogen hybrids), By End-User (Electric utilities, Independent power producers, Commercial and industrial, Remote and off-grid communities, Data centres and digital infra) |
| Regional Analysis | North America (US and Canada), Europe (Germany, France, The UK, Spain, Italy, and Rest of Europe), Asia Pacific (China, Japan, South Korea, India, Australia, and Rest of APAC), Latin America (Brazil, Mexico, and Rest of Latin America), Middle East & Africa (GCC, South Africa, and Rest of MEA) |
| Competitive Landscape | Apex Compressed Air Energy Storage LLC, Bright Energy Storage Technologies, Hydrostor, Magnum Development, Pacific Gas and Electric Company, The Ridge Group, Siemens AG, STORELECTRIC LIMITED, ALACAES, Dresser-Rand – A Siemens Business, General Compression Ltd., LightSail Energy, SustainX |
| Customization Scope | Customization for segments, region/country-level will be provided. Moreover, additional customization can be done based on the requirements. |
| Purchase Options | We have three licenses to opt for: Single User License, Multi-User License (Up to 5 Users), Corporate Use License (Unlimited User and Printable PDF) |
