What is the Sustainable Industrial Chemicals Market Size?
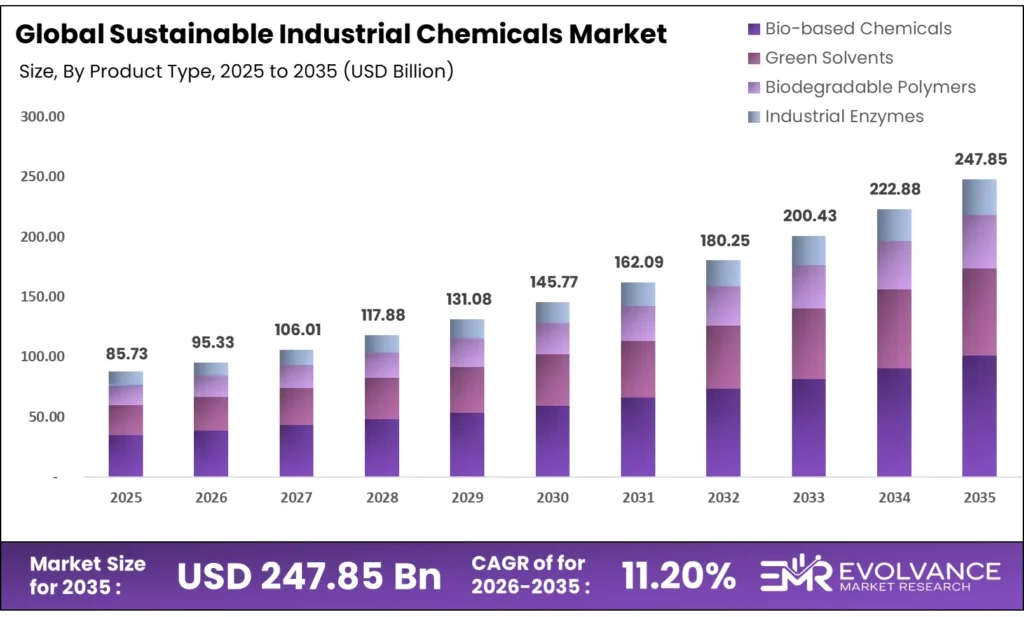
The Global Sustainable Industrial Chemicals Market size will be worth around USD 247.85 Billion by 2035 from USD 85.73 Billion in 2025, growing at a CAGR of 11.20% during the forecast period 2026 to 2035. Corporate sustainability mandates and tightening EU emissions rules are redirecting chemical procurement away from fossil-based inputs. Buyers are shifting budgets toward bio-based and low-VOC alternatives as Scope 3 reporting becomes standard. Raw material price swings and coal-heavy feedstock dependency in key producing nations remain the primary supply-side constraint on margin stability.
Market Highlights
- The Global Sustainable Industrial Chemicals Market will grow from USD 85.73 Billion in 2025 to USD 247.85 Billion by 2035, at a CAGR of 11.20%.
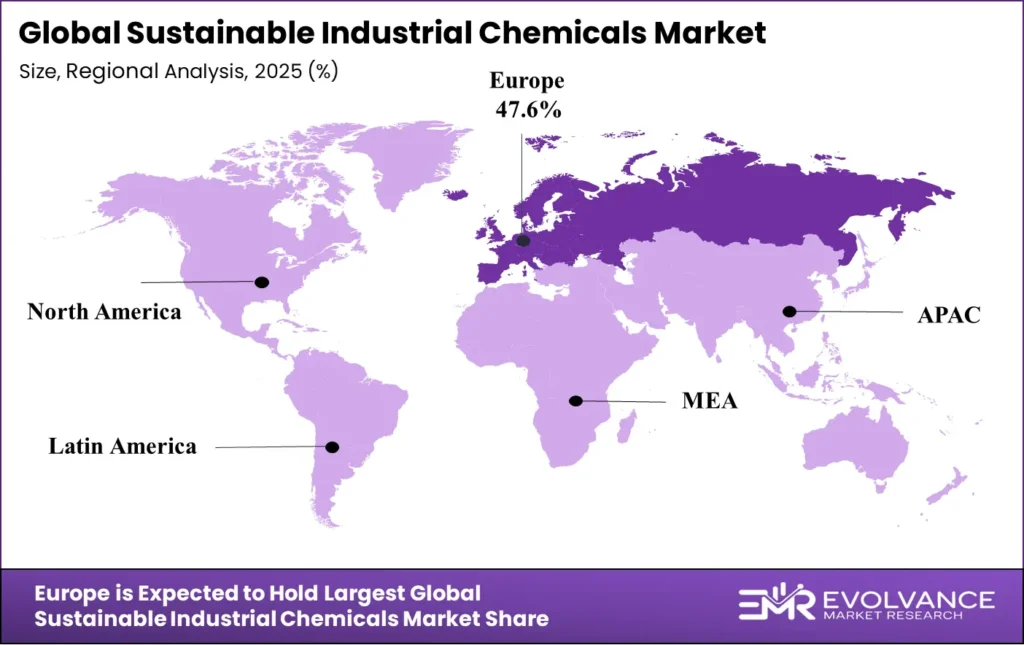
- Europe leads regional demand with a 47.6% share, valued at USD 40.8 Billion.
- Bio-based Chemicals dominate the Product Type segment with a 62.4% share.
- Solvents lead the Functionality segment with a 53.6% share.
- Bio-based leads Sustainability Attribute with a 44.3% share.
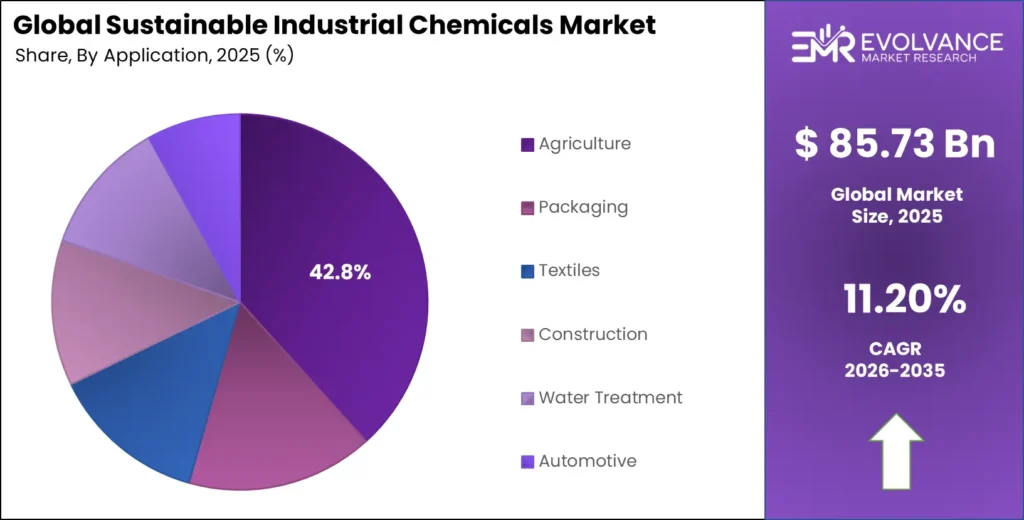
- Agriculture leads the Application segment with a 42.8% share.
- Large enterprises dominate the End-User segment with a 43.2% share.
Market Overview
The sustainable industrial chemicals market covers Bio-based Chemicals, biodegradable, and low-carbon chemical products used across agriculture, packaging, textiles, and water treatment. These products replace fossil-derived inputs with renewable feedstocks or cleaner production methods. The shift is not cosmetic — it reflects hard regulatory deadlines and measurable cost exposure for non-compliant producers and buyers.
Europe leads this transition, with the EU Green Deal Industrial Plan and Net-Zero Industry Act creating binding targets for chemical producers. The chemical sector contributes approximately 5% of total global greenhouse gas emissions, making it a primary target for policy intervention. Producers that delay green reformulation face compliance costs, procurement exclusions, and shrinking access to public contracts.
According to the IEA, chemical sector emissions must fall by approximately 15% by 2030 relative to current levels to align with net-zero pathways, even as production volumes rise. This creates a structural tension — output must grow while emissions fall — and only producers with clean feedstock strategies can resolve it profitably. The market for sustainable alternatives is not optional; it is the only viable compliance path.
Primary chemicals account for around two-thirds of total energy consumption in the global chemical sector. This concentration of energy intensity in a narrow set of products means that even partial decarbonization of ammonia, methanol, and high-value chemicals delivers outsized emissions impact. Vendors that serve these core segments with low-carbon solutions hold the highest-leverage position in the sustainable chemicals value chain.
Government investment is accelerating the transition at the infrastructure level. The European Union holds the highest number of electrolysis-based ammonia and methanol production projects globally, according to IEA data. This concentration of project activity signals that the policy framework is now translating into physical capacity — giving European producers a structural lead in green chemistry supply chains.
Product Type Insights
Bio-based Chemicals dominates with 62.4% due to regulatory alignment and broad end-use demand.
In 2025, Bio-based Chemicals held a dominant market position in the By Product Type segment of the Sustainable Industrial Chemicals Market, with a 62.4% share. Their lead reflects a structural alignment between renewable feedstock availability, EU mass-balance accounting frameworks, and the purchasing priorities of FMCG and pharma buyers mandating bio-content minimums in supplier contracts. This segment is not growing by accident — it is the direct beneficiary of policy and procurement pressure.
Green Solvents serve as a high-priority substitution target within industrial cleaning and extraction workflows. Buyers replacing legacy solvent systems face near-term compliance triggers — particularly under EU VOC Directive updates and US EPA Clean Air Act revisions. Demand is most concentrated in pharmaceuticals, coatings, and electronics manufacturing, where solvent purity and low-toxicity standards are non-negotiable and switching costs are manageable at volume.
Biodegradable Polymers are gaining commercial traction as single-use plastics regulations tighten across Europe, Asia, and Latin America. Packaging buyers are under retailer-led mandates to meet compostability certifications by set deadlines. The segment’s challenge is cost parity with conventional polymers — a gap that is narrowing but has not yet closed, limiting penetration outside premium and regulated applications.
Industrial Enzymes offer a differentiated value proposition: they replace energy-intensive chemical reactions in textiles, food processing, and pulp manufacturing. Their adoption is driven by operational cost savings, not just sustainability targets. Vertec BioSolvents and Novozymes are among the players advancing enzyme-based chemical substitution, with Novozymes especially active in scaling fermentation-derived solutions for industrial customers.
Functionality Insights
Solvents dominates with 53.6% due to broad industrial application and active regulatory pressure.
In 2025, Solvents held a dominant market position in the By Functionality segment of the Sustainable Industrial Chemicals Market, with a 53.6% share. Their lead stems from their near-universal role across cleaning, extraction, and coating processes — sectors where regulators are actively shortening compliance timelines for hazardous solvent phase-outs. Buyers cannot delay substitution without facing operational shutdowns or import restrictions.
Cleaning applications within sustainable solvents are driven by healthcare and food processing sectors, where pathogen control mandates intersect with low-toxicity procurement rules. Green cleaning chemistry is no longer a premium option — many hospital and food safety standards now require it. This makes cleaning the fastest-conversion sub-application within the solvents segment.
Extraction uses are concentrated in pharmaceutical and botanical processing, where solvent residue limits are governed by pharmacopoeial standards. Green extraction solvents must meet both purity and environmental criteria, creating a dual compliance burden that limits supplier options and supports premium pricing for certified green alternatives.
Coatings and Paints based on bio-content or low-VOC formulations are advancing across architectural and industrial coating markets. EU Directive 2004/42/CE on VOC limits in decorative paints has driven reformulation across the European market, and similar standards are extending to Asia Pacific through national equivalents.
Sustainability Attribute Insights
Bio-based dominates with 44.3% due to policy support and supply chain traceability.
In 2025, Bio-based held a dominant market position in the By Sustainability Attribute segment of the Sustainable Industrial Chemicals Market, with a 44.3% share. The European Commission’s proposals to formalize mass-balance accounting for bio-based chemicals have given procurement teams a standardized framework to verify renewable content claims — removing a key barrier to large-scale adoption. Bio-based certification is now a bankable procurement criterion, not just a marketing label.
Biodegradable/Compostable attributes are gaining specification weight in packaging and agriculture, where end-of-life disposal regulations are tightening. Industrial composting infrastructure in Europe and Japan is maturing, making biodegradable claims more commercially viable as the disposal pathway becomes reliable and certified.
Low carbon footprint credentials are driven by Scope 3 reporting obligations under CSRD and SEC climate disclosure rules. Chemical buyers must now account for upstream emissions in their own ESG filings — making a supplier’s carbon intensity a direct financial consideration, not just a preference. BASF’s target to cut absolute CO₂ by 25% by 2030 versus 2018 levels reflects how leading producers are repositioning their entire portfolio around this attribute.
Circular chemistry — products designed for reuse, recycling, or closed-loop recovery — is emerging as a distinct purchasing criterion among large manufacturers with public circular economy commitments. ExxonMobil’s expansion of plastic waste processing to over 250 million pounds per year represents one of the most visible commitments to circular feedstock infrastructure in the sector.
Application Insights
Agriculture dominates with 42.8% due to crop nutrition mandates and bio-input regulations.
In 2025, Agriculture held a dominant market position in the By Application segment of the Sustainable Industrial Chemicals Market, with a 42.8% share. The EU Farm to Fork Strategy’s target to cut chemical pesticide use by 50% by 2030 is forcing agri-chemical buyers to reformulate crop protection and nutrition products with bio-based inputs. ICL’s renewed strategic focus on specialty crop nutrition exemplifies how suppliers are reorienting portfolios to capture this mandated shift.
Packaging is the second-largest application, driven by extended producer responsibility laws across Europe, Japan, and increasingly the US. Brand owners are sourcing bio-based resins and compostable coatings to meet recyclability and bio-content targets embedded in packaging regulations. The segment’s growth is linked directly to legislative calendars, not demand cycles.
Textiles buyers are under supply chain due diligence pressure from the EU Corporate Sustainability Due Diligence Directive (CSDDD), which requires chemical traceability from fiber to finished product. This is driving specification of low-VOC dyes, bio-based finishing chemicals, and enzyme-based textile processing agents in global apparel supply chains.
End-User Insights
Large enterprises dominate with 43.2% due to capital capacity and regulatory exposure.
In 2025, Large enterprises held a dominant market position in the By End-User segment of the Sustainable Industrial Chemicals Market, with a 43.2% share. Large manufacturers face the greatest regulatory scrutiny under CSRD, SEC climate rules, and national carbon pricing schemes — making sustainable chemical sourcing a compliance necessity rather than a voluntary initiative. Their procurement scale also allows them to negotiate long-term bio-based supply agreements that smaller buyers cannot access.
SMEs face adoption barriers primarily around cost and technical expertise. Bio-based and low-VOC alternatives typically carry a price premium over conventional inputs, and SMEs lack the in-house chemistry teams to manage reformulation risk. Policy support through EU SME relief provisions and green chemistry incentive programs is reducing but not yet eliminating this adoption gap.
FMCG companies are among the fastest-moving adopters in this market, driven by consumer-facing sustainability commitments and retailer-imposed sourcing standards. Major FMCG groups have published public timelines for transitioning to bio-based packaging and cleaning chemistry — timelines that are now flowing into formal supplier qualification requirements.
Pharma and Healthcare end-users are transitioning to green solvents and bio-based excipients under pharmacopoeial pressure and hospital procurement sustainability criteria. The EU Pharma Legislation revision and US FDA guidance on green chemistry in drug manufacturing are formalizing what was previously a voluntary market signal into a compliance requirement with audit implications.
Market Segments Covered in the Report
By Product Type
- Bio-based Chemicals
- Green Solvents
- Biodegradable Polymers
- Industrial Enzymes
By Functionality
- Solvents
- Cleaning
- Extraction
- Surfactants
- Detergents
- Emulsifiers
- Adhesives and Sealants
- Coatings and Paints
- Lubricants
By Sustainability Attribute
- Bio-based
- Biodegradable/Compostable
- Low carbon footprint
- Non-toxic/low VOC
- Circular
By Application
- Agriculture
- Packaging
- Textiles
- Construction
- Water Treatment
- Automotive
By End-User
- Large Enterprises
- SMEs
- FMCG
- Pharma and Healthcare
Regional Insights
Europe Dominates the Sustainable Industrial Chemicals Market with a Market Share of 47.6%, Valued at USD 40.8 Billion
Europe controls 47.6% of the global market, worth USD 40.8 Billion in 2025. This lead is structural, not cyclical. The EU Green Deal, REACH regulations, and binding net-zero targets force chemical producers and buyers to adopt sustainable inputs ahead of any other major region. The European Commission’s formalization of mass-balance bio-based accounting has also removed a key procurement barrier, accelerating corporate spend on certified green chemistry.
North America Market Trends
North America is the second most active region, driven by US Inflation Reduction Act incentives for low-carbon chemical technologies and clean hydrogen production. The IRA creates direct investment pathways for producers reformulating with sustainable inputs. California’s CARB standards and federal TSCA reform are tightening domestic chemical specifications, pushing US manufacturers toward bio-based and low-VOC alternatives faster than voluntary ESG commitments alone would achieve.
Asia Pacific Market Trends
Asia Pacific holds significant production scale but lags on green transition speed. Around 85% of China’s ammonia output relies on coal feedstocks, creating deep structural inertia in the region’s chemical base. However, China and Japan are both advancing national carbon market mechanisms and green chemistry standards, and domestic bio-based polymer capacity is growing to serve export markets that require certified sustainable inputs.
Latin America Market Trends
Latin America is an early-stage but structurally important market for bio-based chemicals. Brazil’s large sugarcane-based ethanol and biopolymer sector gives the region a natural feedstock advantage in bio-chemical production. Braskem, headquartered in Brazil, produces bio-based polyethylene from sugarcane — a model that demonstrates how regional feedstock assets can translate into global market share in sustainable polymers.
Middle East & Africa Market Trends
The Middle East is transitioning from pure petrochemical production toward lower-carbon chemical portfolios, driven by sovereign wealth fund diversification goals and growing export market requirements. SABIC’s portfolio optimization program — which helped lift operating profit by 58.2% in 2024 — includes a shift toward specialty and sustainable chemistry lines that command better margins and align with European buyer requirements.
Key Regions and Countries
North America
- US
- Canada
Europe
- Germany
- France
- The UK
- Spain
- Italy
- Rest of Europe
Asia Pacific
- China
- Japan
- South Korea
- India
- Australia
- Rest of APAC
Latin America
- Brazil
- Mexico
- Rest of Latin America
Middle East & Africa
- GCC
- South Africa
- Rest of MEA
Regulatory Landscape
The EU Green Deal Industrial Plan, enacted in 2023 and extended through 2025, mandates net-zero technology adoption across the chemicals sector. It sets binding production targets for low-carbon chemical outputs and ties public procurement eligibility to verified sustainability credentials. Producers outside compliance risk losing access to the EU’s €440 billion public procurement market.
The US Inflation Reduction Act, signed in August 2022 and active through the forecast period, allocates over USD 369 billion to clean energy and industrial decarbonization. For chemical producers, this covers tax credits for low-carbon feedstock use, clean hydrogen production, and sustainable fuels. The IRA has already triggered over USD 100 billion in announced clean chemical investments across the US.
The European REACH Regulation continues to restrict hazardous substances in chemical products, with substance of very high concern (SVHC) updates issued annually. 2024 updates added new restrictions on persistent organic pollutants used in industrial solvents and coatings. Each SVHC addition effectively creates a mandatory substitution deadline, driving direct procurement shifts toward bio-based and non-toxic alternatives.
China’s National Carbon Market, launched in 2021 and expanded in 2024 to include chemical production sectors, creates direct carbon cost exposure for coal-based chemical producers. With 85% of China’s ammonia production relying on coal feedstocks, the carbon pricing mechanism creates structural pressure to invest in renewable feedstock substitution — or face rising per-unit production costs that erode export competitiveness.
Drivers
EU Policy Mandates and Corporate Net-Zero Commitments Push Bio-based Chemical Procurement
The EU Green Deal Industrial Plan is converting sustainability aspirations into hard procurement requirements for chemical buyers across Europe. Chemical sector emissions must fall by approximately 15% by 2030, according to IEA data, even as output volumes rise. Producers that cannot demonstrate decarbonized supply chains are being removed from qualified supplier lists by large FMCG and pharma buyers.
BASF’s strategic pivot toward low-carbon footprint products and circular economy chemistry reflects a direct response to buyer-driven demand shifts, not just regulatory compliance. Their target to cut absolute CO₂ by 25% by 2030 versus 2018 baselines signals that portfolio repositioning toward sustainable chemistry is now a core business strategy, not a side initiative. Buyers tracking Scope 3 emissions now treat their supplier’s carbon intensity as a direct financial input in procurement decisions.
Moreover, Kemira’s 2030 target to generate over EUR 500 million revenue from its renewable chemistries portfolio demonstrates that financial targets — not just sustainability reports — are being built around green chemistry growth. This shift from cost-center framing to revenue-center framing for sustainable chemistry portfolios signals a market maturation that attracts capital investment and pricing confidence in the segment.
Restraints
Raw Material Cost Volatility and Fossil Feedstock Dependency Compress Green Chemistry Margins
Persistent raw material price swings create margin uncertainty that slows capital allocation toward sustainable chemistry investments. BASF reported EBITDA of €6.681 billion in FY2024, down from €7.18 billion in 2023, partly due to energy cost pressures and transition investment costs. When energy prices spike, the cost advantage of bio-based feedstocks over petrochemicals narrows — and adoption decisions slow.
Geopolitical headwinds compound this challenge. BASF’s 2025 earnings guidance was revised downward after an initially strong start to the year, reflecting persistent demand weakness in Europe and price deflation across key chemical segments. These conditions reduce buyers’ willingness to pay the premium that sustainable chemical alternatives currently carry over conventional benchmarks.
Furthermore, coal-based feedstock dependency in major producing nations creates structural inertia in the global chemical supply base. Around 85% of China’s ammonia production relies on coal feedstocks, as reported by the IEA. China accounts for 30% of global ammonia output — meaning a large portion of the world’s primary chemical feedstock base is structurally misaligned with decarbonization targets, creating supply-side resistance that policy incentives alone cannot quickly resolve.
Growth Factors
IRA and Net-Zero Policy Incentives Unlock Capital for Low-Carbon Chemical Infrastructure
US and EU policy incentives under the Inflation Reduction Act and Net-Zero Industry Act are directly reducing the capital cost of building sustainable chemical capacity. These programs cover clean hydrogen production, electrolysis-based ammonia, and bio-based feedstock processing — the three core infrastructure pillars of the low-carbon chemicals supply chain. Early movers that secure incentive packages gain structural cost advantages over late entrants.
ExxonMobil’s expansion of plastic waste processing capacity to over 250 million pounds per year, alongside tripling its Proxxima resins output, shows how incentive-backed capacity investment translates directly into circular feedstock supply. This type of infrastructure investment creates long-term feedstock security for sustainable chemical producers — reducing the raw material risk that has historically deterred buyers from committing to bio-based supply contracts.
Additionally, Kemira is targeting average annual organic growth above 4% and doubled water revenue by 2030 through expansion in water solutions and renewable chemistries. Their strategy demonstrates that the growth opportunity in sustainable industrial chemicals is measurable and investor-grade — not aspirational. Investors can now point to named revenue targets from established chemical majors as proof of commercial viability.
Emerging Trends
Mass-Balance Accounting and Scope 3 Reporting Reshape Sustainable Chemical Procurement Standards
The European Commission’s proposal to formalize mass-balance accounting for bio-based chemicals is converting a complex technical concept into a standardized procurement tool. This means buyers can now verify renewable content claims using auditable accounting frameworks — removing the uncertainty that has slowed bio-based specification in large corporate procurement programs. The standardization effect is comparable to what organic food certification did for consumer retail: it creates a trusted signal that scales adoption.
Scope 3 emissions reporting under CSRD and SEC climate disclosure rules is making chemical input selection a financial decision, not just a procurement preference. dsm-firmenich’s total sales grew to €12.799 billion in FY2024, driven partly by bio-based and nutrition chemistry demand — evidence that sustainable specialty chemistry is outperforming conventional segments even in a weak global chemical market. Buyers tracking supplier emissions now have financial incentives, not just ethical ones, to prefer low-carbon inputs.
Furthermore, the integration of carbon capture and clean hydrogen into chemical production processes is shifting from pilot-scale to capital investment decisions. IEA data shows the EU leads globally in electrolysis-based ammonia and methanol projects — a structural investment position that will define green chemistry supply economics for the next decade. Companies that build carbon management into their core chemistry today will have lower cost-to-comply as regulations tighten through 2030 and beyond.
Key Companies Insights
Arkema Group has built a specialty chemicals portfolio weighted toward bio-based adhesives, coatings, and high-performance materials. Their focus on renewable feedstock integration across adhesive and coating product lines positions them directly in the highest-growth sub-segments of the sustainable chemicals market. Arkema’s shift toward specialty and performance chemistry — rather than commodity volume — gives them margin resilience in periods of raw material volatility that pressure broad-base chemical producers.
Braskem SA operates the world’s largest bio-based polyethylene production platform, using sugarcane ethanol as its primary feedstock. This gives Braskem a structurally differentiated supply position in the biodegradable polymers segment — one that competitors relying on imported bio-feedstocks cannot easily replicate. Their Latin American feedstock base provides cost stability in a market where bio-based premium pricing is gradually compressing as scale increases and certification frameworks mature.
Novozymes A/S is the global leader in industrial enzyme production, serving agriculture, food processing, and textile chemical markets. Their fermentation-derived enzyme products replace energy-intensive synthetic chemical reactions — delivering both sustainability and operational cost benefits to industrial buyers. This dual value proposition, combining emissions reduction with measurable process efficiency gains, gives Novozymes a stronger sales argument than sustainability credentials alone.
LanzaTech Global, Inc. commercializes carbon capture technology that converts industrial waste gases into bio-based chemical feedstocks. Their platform directly addresses the circular chemistry trend by turning CO₂-rich waste streams into raw material inputs for sustainable chemicals. LanzaTech’s technology is deployed at commercial scale with steel and industrial gas partners, providing verified carbon utilization data that supports both customer sustainability reporting and regulatory compliance claims.
Key Companies
- Arkema Group
- Braskem SA
- Novozymes A/S
- LanzaTech Global, Inc.
- TotalEnergies Corbion B.V.
- Vertec BioSolvents, Inc.
- GFBiochemicals Ltd.
- CJ Biomaterials, Inc.
- Mitsubishi Chemical Corporation
- Eastman Chemical Company
Recent Development
- In September 2024, Abolis Biotechnologies raised €35 million (~$38.6M) in a funding round backed by L’Oréal and Evonik to develop bio-based ingredients using microorganisms.
- In November 2024, BASF partnered with Acies Bio to develop fermentation-based production of fatty alcohols using renewable methanol.
- In April 2024, Neste partnered with Lotte Chemical to supply renewable raw materials for lower-emission chemicals and plastics production.
- In October 2025, DOMO Chemicals introduced new low-carbon polyamide materials (including recycled and CO₂-reduced grades) at K 2025.
Market Scope
| Report Features | Description |
|---|---|
| Market Value (2025) | USD 85.73 Billion |
| Forecast Revenue (2035) | USD 247.85 Billion |
| CAGR (2026-2035) | 11.20% |
| Base Year for Estimation | 2025 |
| Historic Period | 2020-2024 |
| Forecast Period | 2026-2035 |
| Report Coverage | Revenue Forecast, Market Dynamics, Competitive Landscape, Recent Developments |
| Segments Covered | By Product Type (Bio-based Chemicals, Green Solvents, Biodegradable Polymers, Industrial Enzymes), By Functionality (Solvents, Cleaning, Extraction, Surfactants, Detergents, Emulsifiers, Adhesives and Sealants, Coatings and Paints, Lubricants), By Sustainability Attribute (Bio-based, Biodegradable/Compostable, Low carbon footprint, Non-toxic/low VOC, Circular), By Application (Agriculture, Packaging, Textiles, Construction, Water Treatment, Automotive), By End-User (Large Enterprises, SMEs, FMCG, Pharma and Healthcare) |
| Regional Analysis | North America (US and Canada), Europe (Germany, France, The UK, Spain, Italy, and Rest of Europe), Asia Pacific (China, Japan, South Korea, India, Australia, and Rest of APAC), Latin America (Brazil, Mexico, and Rest of Latin America), Middle East & Africa (GCC, South Africa, and Rest of MEA) |
| Competitive Landscape | Arkema Group, Braskem SA, Novozymes A/S, LanzaTech Global Inc., TotalEnergies Corbion B.V., Vertec BioSolvents Inc., GFBiochemicals Ltd., CJ Biomaterials Inc., Mitsubishi Chemical Corporation, Eastman Chemical Company |
| Customization Scope | Customization for segments, region/country-level will be provided. Moreover, additional customization can be done based on the requirements. |
| Purchase Options | We have three licenses to opt for: Single User License, Multi-User License (Up to 5 Users), Corporate Use License (Unlimited User and Printable PDF) |
