What is the Renewable Energy Storage System Market Size?
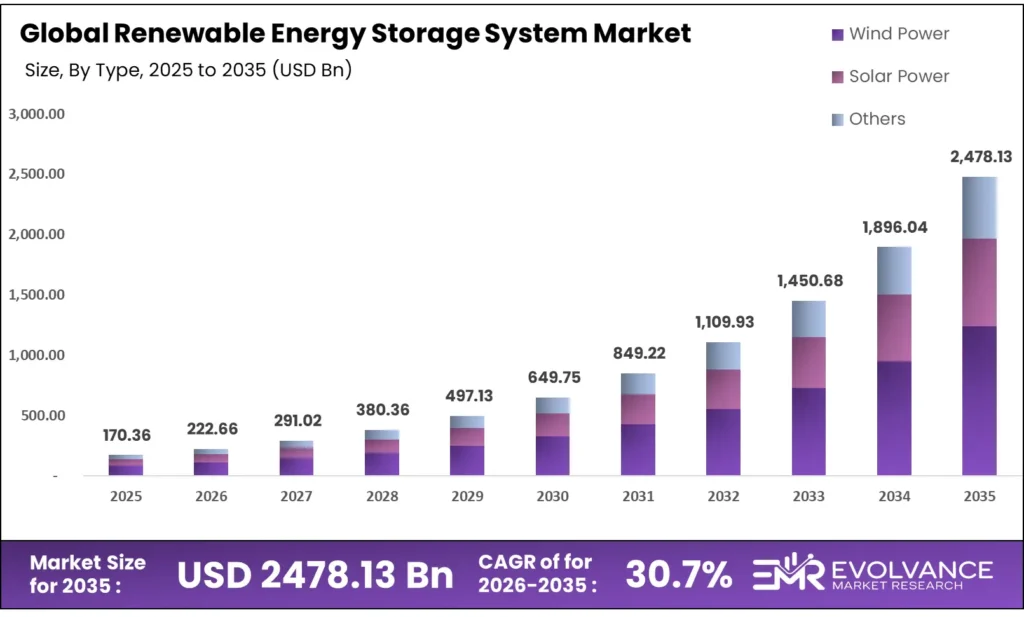
The Global Renewable Energy Storage System Market size will be worth around USD 2,478.13 Billion by 2035 from USD 170.36 Billion in 2025, growing at a CAGR of 30.7% during the forecast period 2026 to 2035. U.S. grid reliability needs and AI data center power demands are pushing utilities to procure storage at record scale. Buyers are shifting from long-term contracts to shorter procurement cycles, chasing falling battery pack prices. Supply chain exposure to critical lithium materials remains a real constraint on accelerated rollout timelines.
Market Highlights
- The Global Renewable Energy Storage System Market valued at USD 170.36 Billion in 2025, reaching USD 2,478.13 Billion by 2035 at a CAGR of 30.7%.
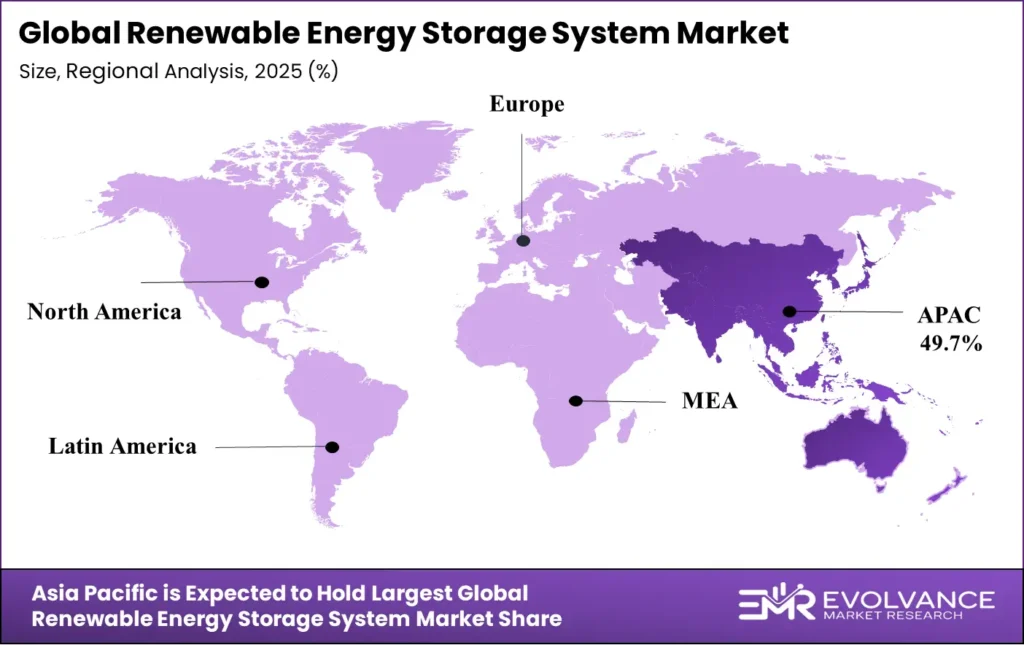
- Asia Pacific leads all regions with a 49.7% share, valued at USD 84.7 Billion.
- Wind Power dominates the By Type segment with a 48.6% share.
- Pumped Hydro leads the By Technology segment with a 43.6% share.
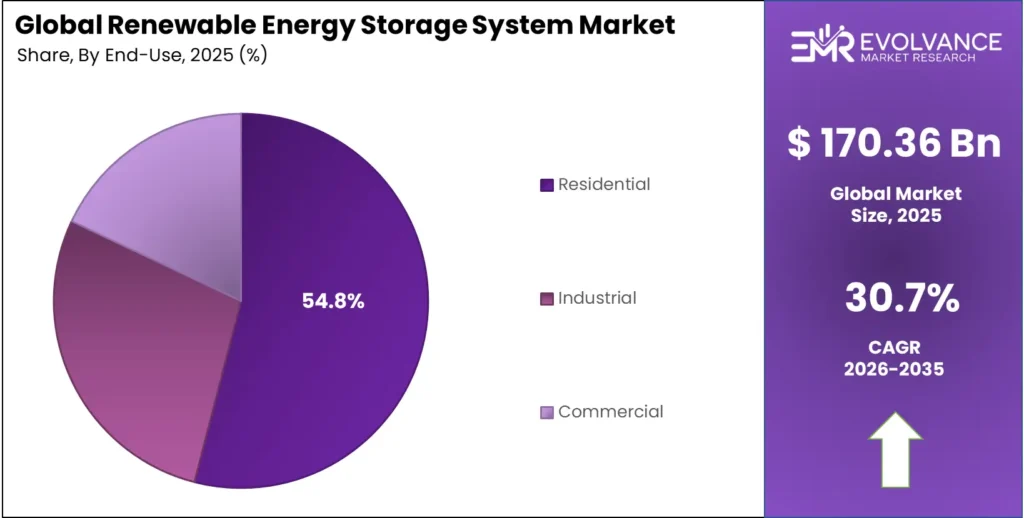
- Residential end users hold the largest share at 54.8% in the By End User segment.
Market Overview
The renewable energy storage system market covers technologies that capture, store, and release energy from wind, solar, and other clean sources. These systems include battery banks, pumped hydro plants, compressed air facilities, and thermal units. Their core function is to bridge gaps between when power is generated and when consumers need it.
Storage systems are now central to grid planning, not optional add-ons. Utilities can no longer depend on dispatchable fossil fuel plants to cover renewable intermittency without a storage layer. Grid Energy Storage operators in key markets are mandating storage alongside new renewable capacity, making these systems a structural part of energy infrastructure.
- According to the International Energy Agency, global grid-scale battery storage capacity stood at nearly 28 GW by end of 2022, with around 11 GW of new capacity added that year alone. This pace then accelerated sharply — data from the IEA shows battery storage capacity in the power sector grew from 1 GW in 2013 to more than 85 GW by 2023. That scale shift tells buyers and investors one thing: this is no longer an emerging segment, it is a core infrastructure asset class.
Government mandates, falling battery costs, and the electrification push from sectors like transport and data centers are reshaping procurement timelines. NLC India announced a ₹10,000 crore investment in pumped hydro storage as part of its broader ₹41,000 crore green energy program — a signal that state-backed players are now committing capital at scale.
Moreover, global battery storage additions reached approximately 69 GW of new capacity in 2024, nearly doubling cumulative installed capacity worldwide, as reported by the IEA. This acceleration means the window for early-mover advantage in supply contracts, project development, and technology licensing is closing fast for latecomers.
Type Insights
Wind Power dominates with 48.6% due to large-scale grid pairing mandates.
In 2025, Wind Power held a dominant market position in the By Type segment of the Renewable Energy Storage System Market, with a 48.6% share. Wind farms generate power in bursts tied to weather, not demand cycles. Grid operators require paired storage to smooth these peaks, making storage a mandatory component of most new wind project approvals. Utility buyers now treat wind-plus-storage as a single procurement package, not two separate assets.
Wind Energy Storage Systems form the core infrastructure layer within wind power deployments. These systems store excess output during high-generation periods and release it during evening peaks or low-wind intervals. Utilities in the U.S. and China are contracting these systems at multi-hundred megawatt scale to meet reliability standards set by grid regulators.
Battery Storage for Wind Energy has become the fastest-scaling sub-segment within wind storage because lithium-iron-phosphate (LFP) battery prices fell to $70/kWh in 2025 — a 45% drop from 2024. That price drop makes battery pairing with wind economically viable at scales that were previously only feasible for pumped hydro. Project developers are now treating battery storage as a standard line item in wind farm capital budgets.
Solar Power covers storage systems paired with photovoltaic panels and concentrated solar installations. Solar generation peaks at midday but demand peaks in the early evening, creating a structural mismatch that only storage can resolve. This gap is the primary driver of solar-paired storage procurement across residential, commercial, and utility segments globally.
Photovoltaic (PV) Energy Storage Solutions link battery banks directly to solar panel arrays for real-time energy balancing. These systems are the backbone of utility-scale solar-plus-storage projects. China’s battery power station fleet reached approximately 62 GW or 141 GWh of capacity by end of 2024, with a large share co-located with PV installations. That deployment density gives Chinese operators significant data advantages in optimizing PV-paired storage dispatch.
Geothermal Energy Storage captures heat from the earth and stores it for use in heating networks and power generation. It provides baseload-like stability that wind and solar cannot offer. Geothermal storage is gaining traction in Iceland, Kenya, and parts of the U.S. West, where geology supports large-scale development at competitive costs.
Hydrogen Storage Systems convert surplus renewable electricity into hydrogen through electrolysis and store it for later power generation or industrial use. Hydrogen storage addresses the seasonal mismatch problem — where summer solar surpluses need to be stored for winter demand — that battery systems are too costly to solve at scale. Several European governments are funding hydrogen storage pilots as a long-duration hedge against battery-only grid strategies.
Flywheel Energy Storage Systems use rotating mechanical energy to store and release power within seconds. Flywheels excel at frequency regulation — the sub-second grid balancing task where batteries face more wear-related cost penalties. Grid operators use flywheels in tandem with batteries to extend battery cycle life while maintaining tight frequency control across transmission networks.
Technology Insights
Pumped Hydro dominates with 43.6% due to decades of installed base and zero-battery-cost structure.
In 2025, Pumped Hydro held a dominant market position in the By Technology segment of the Renewable Energy Storage System Market, with a 43.6% share. IEA data confirms pumped-storage hydropower held approximately 160 GW of installed capacity worldwide in 2021 — a base so large it still defines the technology mix a decade later. Grid operators favor pumped hydro for its low operating cost per cycle and multi-day discharge capability, advantages that lithium-ion cannot yet match at the same capital efficiency.
Electro-Chemical storage, led by lithium-ion battery systems, is the fastest-growing technology segment. Global battery storage additions reached approximately 69 GW in 2024, nearly doubling cumulative capacity, according to IEA deployment data. The speed of this growth reflects two forces: falling battery pack prices and rising mandates for fast-response storage that pumped hydro cannot provide within urban and suburban grid zones.
Electro-Mechanical storage — including flywheels and CAES — serves specialized grid functions that neither pumped hydro nor batteries handle cost-effectively. Flywheels provide millisecond-level frequency response. CAES delivers bulk long-duration storage. Together, these technologies fill the performance gaps that keep pure battery or pure pumped-hydro grids from reaching full reliability targets.
Thermal storage converts electrical energy into heat or cold and releases it on demand. Thermal systems are the lowest-cost storage option for heating and cooling applications, which represent a large share of total building energy consumption. As electrification of heat accelerates across Europe and Asia, thermal storage capacity will scale alongside heat pump adoption, creating a parallel storage market outside the traditional power-sector frame.
End User Insights
Residential dominates with 54.8% due to solar-plus-storage bundling and time-of-use tariff pressure.
In 2025, Residential held a dominant market position in the By End User segment of the Renewable Energy Storage System Market, with a 54.8% share. Homeowners in markets with high retail electricity prices — Germany, Australia, California — are installing solar-battery systems to cut bill exposure. The combination of falling battery costs and rising utility rates has made residential storage a straightforward payback calculation for millions of households.
Industrial end users deploy storage to manage peak demand charges, improve power quality, and ensure backup power for critical processes. Factories, data centers, and manufacturing plants face electricity costs structured around their highest 15-minute consumption peak each month. A correctly sized storage system can shave those peaks consistently, generating savings that justify capital outlay within three to five years in most markets.
Commercial users — office buildings, retail centers, hospitals — occupy the mid-tier between residential simplicity and industrial complexity. Commercial storage systems often combine demand charge management with backup power and participation in utility demand-response programs. As AI data centers expand their footprint globally, the commercial segment will absorb significant storage capacity to maintain uptime and manage volatile power costs.
Market Segments Covered in the Report
By Type
- Wind Power
- Wind Energy Storage Systems
- Compressed Air Energy Storage (CAES)
- Battery Storage for Wind Energy
- Solar Power
- Solar Battery Storage Systems
- Photovoltaic (PV) Energy Storage Solutions
- Concentrated Solar Power (CSP) Storage
- Other
- Geothermal Energy Storage
- Hydrogen Storage Systems
- Thermal Energy Storage (TES)
- Flywheel Energy Storage Systems
By Technology
- Pumped Hydro
- Electro-Chemical
- Electro-Mechanical
- Thermal
By End User
- Residential
- Industrial
- Commercial
Renewable Energy Storage System Market Regional Insights
Asia Pacific Dominates the Renewable Energy Storage System Market with a Market Share of 49.7%, Valued at USD 84.7 Billion
Asia Pacific holds 49.7% of the global market, worth USD 84.7 Billion in 2025. China alone accounted for approximately 55% of new energy storage installations globally in 2023 and reached 62 GW or 141 GWh of battery capacity by end of 2024. State-directed grid expansion programs, domestic LFP battery supply chains, and mandatory storage mandates tied to renewable project approvals give this region structural advantages no other geography can replicate near-term.
North America Renewable Energy Storage System Market Trends
North America is the world’s second-largest storage deployment market. The U.S. added more than 8 GW of new battery storage in 2023 and approximately 12.3 GW or 37.1 GWh in 2024. U.S. installations reached a record 57.6 GWh in 2025 — a 30% increase from 2024. Domestic manufacturing incentives and state-level reliability mandates are pushing projected U.S. additions to 70 GWh in 2026, signaling that procurement pipelines remain full despite federal policy uncertainty.
Europe Renewable Energy Storage System Market Trends
Europe reached approximately 61 GWh of installed battery storage by end of 2024, following annual additions of about 21 GWh. The EU added approximately 6 GW of battery storage in 2023, concentrated in Germany and Italy. The United Kingdom recorded around 4.6 GW or 5.9 GWh of installed capacity by June 2024, driven by grid balancing needs tied to rising offshore wind generation. Europe’s storage growth is structural — it mirrors the pace of renewable capacity additions, not speculative demand.
Latin America Renewable Energy Storage System Market Trends
Latin America is an emerging deployment zone with strong underlying demand drivers. Brazil and Mexico hold large renewable energy potential, and both governments are introducing storage-friendly grid codes to attract project investment. The region’s storage market is still early-stage, but falling global battery prices now make utility-scale projects viable without the subsidy support that drove early adoption in North America and Europe.
Middle East & Africa Renewable Energy Storage System Market Trends
The Middle East and Africa region is using storage to solve two distinct problems: grid reliability in fossil-fuel-dependent economies and energy access in off-grid communities. Gulf states are integrating large-scale storage into solar megaprojects to reduce gas peaker plant reliance. Sub-Saharan Africa is deploying smaller behind-the-meter systems to power communities where grid extension is not economically viable in the near term.
Key Regions and Countries
North America
- US
- Canada
Europe
- Germany
- France
- The UK
- Spain
- Italy
- Rest of Europe
Asia Pacific
- China
- Japan
- South Korea
- India
- Australia
- Rest of APAC
Latin America
- Brazil
- Mexico
- Rest of Latin America
Middle East & Africa
- GCC
- South Africa
- Rest of MEA
Regulatory Landscape
The U.S. Inflation Reduction Act, enacted in 2022 and actively administered through 2024-2025, extended investment tax credits to standalone battery storage systems. This policy shift removed the previous requirement that batteries be paired with solar. It directly expanded the addressable market for utility-scale storage developers and triggered a wave of domestic manufacturing investment to capture the credits.
The European Union’s Net Zero Industry Act, advanced through 2024, sets targets for domestically produced clean tech including battery storage systems. The regulation requires member states to streamline permitting for strategic projects. This cuts project approval timelines from years to months in qualifying cases — a direct response to the gap between Europe’s storage ambitions and its actual deployment pace.
- India’s Ministry of Power issued the Battery Energy Storage Systems Policy Framework in 2023, updated through 2024, mandating storage procurement by distribution companies. The policy supports 4,000 MWh of storage through viability gap funding. This framework gives project developers a government backstop that reduces off-take risk — the key barrier that had slowed private investment in Indian storage projects.
China’s National Development and Reform Commission issued updated grid storage policies in 2024, requiring new utility-scale renewable projects above a set capacity threshold to include paired storage systems. This mandate locked storage into China’s renewable project approval process, creating guaranteed demand for domestic battery manufacturers at a scale no other market has matched.
Renewable Energy Storage System Market Dynamics
Drivers
Record U.S. Installations and Global Capacity Additions Signal Structural Demand Shift
U.S. grid-scale storage installations reached 57.6 GWh in 2025 — a 30% increase from 2024 — driven by grid reliability requirements and surging power demand from AI data centers and industrial electrification. This is not cyclical growth. Grid operators are replacing the dispatchable capacity that retiring coal and gas plants provided, and storage is the only technology that can fill that role at speed.
- Global capacity additions reached 92 GW or 247 GWh in 2025, a 23% rise year-over-year, with China and the U.S. accounting for the largest shares. The breadth of this expansion — across regions, technologies, and end-user types — signals that storage has crossed from incentive-driven adoption to demand-driven procurement. Vendors with established supply chains and proven project track records will capture disproportionate share as this wave accelerates.
Additionally, SPML Infra invested ₹175 crore to build a battery energy storage manufacturing facility in Pune with an initial capacity of 2.5 GW, scalable to 10 GW. This type of capacity-building investment in emerging markets like India shows that the demand signal is now strong enough to justify greenfield manufacturing commitments — not just project-level procurement decisions.
Restraints
Policy Uncertainty and Supply Chain Risks Slow Deployment in Key Markets
U.S. federal actions targeting clean energy programs and trade restrictions on battery components have created planning uncertainty for project developers. When policy frameworks shift mid-cycle, developers delay final investment decisions on projects already in advanced development. This uncertainty does not kill demand — it defers it, creating revenue timing risk for vendors and financiers who have priced projects under previous policy assumptions.
- Supply chain vulnerabilities tied to critical battery materials — lithium, cobalt, and nickel — remain a structural constraint. China accounts for over 90% of global energy storage battery cell supply, with the top nine suppliers all based there. This concentration creates geopolitical exposure for buyers in North America and Europe who must source from supply chains their governments are actively trying to diversify away from.
Geopolitical tensions add further complexity. Export controls, tariffs, and bilateral trade disputes can disrupt material flows that battery supply chains depend on. Vendors without multi-source procurement strategies face margin pressure and project delays when single-source supply is disrupted. For buyers in regulated utility markets, these delays can trigger contract penalties and grid reliability violations.
Growth Factors
Cost Reductions and Renewable Integration Create a Self-Reinforcing Expansion Cycle
Fully installed battery storage project costs dropped 93% from 2010 to 2024, with an additional 32-38% reduction in 2024 alone. Storage now pencils out for a far wider range of buyers than it did three years ago. Every incremental cost reduction expands the addressable market by pulling in buyers who were previously just above the economic threshold — creating a compounding demand effect as prices continue falling.
- Integration with renewables accounted for 67% of capacity additions in 2024 and remains the primary use case going forward. GE Vernova reported $2.6 billion in electrification segment revenue in Q3 2025, a 34.9% year-over-year increase, as grid infrastructure and battery storage equipment orders surged. That revenue signal confirms that the infrastructure layer supporting renewables-plus-storage is scaling in lockstep with generation capacity.
U.S. projections target 70 GWh of new storage in 2026, driven by domestic manufacturing incentives and state reliability policies. Markets beyond China and the U.S. — India, Australia, Southeast Asia, and parts of Europe — are now entering their own scaling phases. Vendors that built market presence in early-adopter geographies now have a replicable playbook to apply in the next wave of deployment markets.
Emerging Trends
Price Collapse in Battery Storage Reshapes Competitive Dynamics and Market Structure
Stationary storage became the lowest-priced lithium-ion segment in 2025, with battery energy storage prices falling to one-third of 2020 levels. This is not a minor pricing adjustment — it is a structural repricing of the entire segment. When the cost floor drops this fast, the competitive moat built on price advantage disappears, and winners shift from lowest-cost producers to those with the best project execution, software, and service capabilities.
- Global battery storage installations grew more than 20-fold over the five years through 2025. Chinese companies exported more than $65 billion worth of lithium-ion batteries in 2025 as global demand for storage infrastructure scaled. This export volume is reshaping trade flows and forcing non-Chinese manufacturers to differentiate on performance, warranty, and supply chain transparency rather than competing on unit cost alone.
Furthermore, key markets like China are shifting toward market-based mechanisms for storage dispatch, moving away from guaranteed-price support. This trend is significant: once storage competes in open energy markets without subsidies, it signals that the technology has reached genuine cost competitiveness. Early movers who have optimized dispatch algorithms and developed merchant storage business models will have a structural edge as this market structure spreads globally.
Companies Insights
Hitachi Ltd. brings grid infrastructure depth that pure battery vendors cannot match. Hitachi integrates storage with transmission hardware, grid control software, and long-cycle asset management — a bundle that appeals to utilities managing complex, multi-technology grids. This full-stack positioning allows Hitachi to compete for large government-backed grid modernization contracts where a single vendor relationship reduces procurement complexity for buyers.
Tesla Inc. has built one of the most recognized storage brands globally through the Megapack product line. Tesla’s vertical integration — manufacturing cells, packs, inverters, and software — gives it cost and performance data advantages over assemblers who buy components externally. The company’s direct-to-utility sales model and software-driven dispatch optimization make its storage systems attractive to buyers who want a single accountable vendor across hardware and performance.
General Electric Company — now operating its energy business as GE Vernova — posted electrification orders of $14.6 billion in Q3 2025, up 55% year-over-year, as grid modernization and energy storage deployment accelerated globally. GE Vernova’s strength lies in its existing relationships with grid operators worldwide. These relationships give it preferred vendor access to large storage tenders that smaller, storage-only competitors cannot access without years of relationship-building.
BYD Company Limited reported total revenue of 777.1 billion yuan ($108 billion) in 2024, with energy storage contributing meaningfully alongside its dominant EV business. BYD’s scale in battery manufacturing — spanning chemistry R&D, cell production, and pack assembly — allows it to price storage systems aggressively while maintaining margin through vertical integration. Its global export strategy means BYD storage systems are entering markets across Asia, Europe, and Latin America simultaneously.
Key Companies
- Hitachi Ltd.
- Tesla Inc.
- General Electric Company
- BYD Company Limited
- LG Chem Ltd.
- Siemens Energy AG
- NextEra Energy Resources LLC
- PARKER HANNIFIN CORPORATION
- Trina Solar Co. Ltd.
- Commonwealth Edison Company
- Fluence Energy LLC
- Nippon Electric Company Limited
- Vivint Solar Inc.
- Invenergy LLC
- Greenko Group PLC
- EVLO Energy Storage Inc.
- GreenSmith Energy Management Systems LLC
- Eos Energy Storage LLC
- Xtreme Power Inc.
- Sonnen GmbH
Recent Development
- In 2024 – LG Energy Solution reported consolidated revenue of $17.7 billion for FY2024, driven by large-scale Electric Vehicle and energy storage battery supply contracts in North America and Europe. Operating profit reached KRW 575.4 billion at a 2.2% margin as ESS and EV battery production expanded globally.
- In 2024 – CALB reported energy storage system revenue of 8.2 billion yuan in 2024, a 72.4% year-over-year increase as large-scale grid storage demand expanded in China and Europe. Yiwei Lithium Energy generated 7.774 billion yuan in storage battery revenue in H1 2024 with shipments of 20.95 GWh, up 133.18% year-over-year.
- In 2024 – CATL generated total revenue of $50.1 billion in 2024 and sold 475 GWh of lithium-ion batteries, including 93 GWh of energy storage batteries — a 34.32% increase in storage battery sales versus 2023. Net profit reached 50.7 billion yuan ($7.01 billion).
- In 2025 – GE Vernova recorded total revenue of $9.97 billion in Q3 2025 while electrification orders surged 55% to $14.6 billion. The electrification segment alone posted $2.6 billion in revenue, a 34.9% year-over-year gain, as grid modernization projects accelerated.
- In 2025 – NLC India announced a ₹10,000 crore investment in pumped hydro energy storage as part of its ₹41,000 crore green energy expansion. The company also plans to deploy 500 MWh of battery energy storage in Tamil Nadu and scale national BESS capacity to 5 GWh.
Market Scope
| Report Features | Description |
|---|---|
| Market Value (2025) | USD 170.36 Billion |
| Forecast Revenue (2035) | USD 2,478.13 Billion |
| CAGR (2026-2035) | 30.7% |
| Base Year for Estimation | 2025 |
| Historic Period | 2020-2024 |
| Forecast Period | 2026-2035 |
| Report Coverage | Revenue Forecast, Market Dynamics, Competitive Landscape, Recent Developments |
| Segments Covered | By Type (Wind Power, Solar Power, Other), By Technology (Pumped Hydro, Electro-Chemical, Electro-Mechanical, Thermal), By End User (Residential, Industrial, Commercial) |
| Regional Analysis | North America (US and Canada), Europe (Germany, France, The UK, Spain, Italy, and Rest of Europe), Asia Pacific (China, Japan, South Korea, India, Australia, and Rest of APAC), Latin America (Brazil, Mexico, and Rest of Latin America), Middle East & Africa (GCC, South Africa, and Rest of MEA) |
| Competitive Landscape | Hitachi Ltd., Tesla Inc., General Electric Company, BYD Company Limited, LG Chem Ltd., Siemens Energy AG, NextEra Energy Resources LLC, PARKER HANNIFIN CORPORATION, Trina Solar Co. Ltd., Commonwealth Edison Company, Fluence Energy LLC, Nippon Electric Company Limited, Vivint Solar Inc., Invenergy LLC, Greenko Group PLC, EVLO Energy Storage Inc., GreenSmith Energy Management Systems LLC, Eos Energy Storage LLC, Xtreme Power Inc., Sonnen GmbH |
| Customization Scope | Customization for segments, region/country-level will be provided. Moreover, additional customization can be done based on the requirements. |
| Purchase Options | We have three licenses to opt for: Single User License, Multi-User License (Up to 5 Users), Corporate Use License (Unlimited User and Printable PDF) |
