What is the Protein Hydrolysate Market Size?
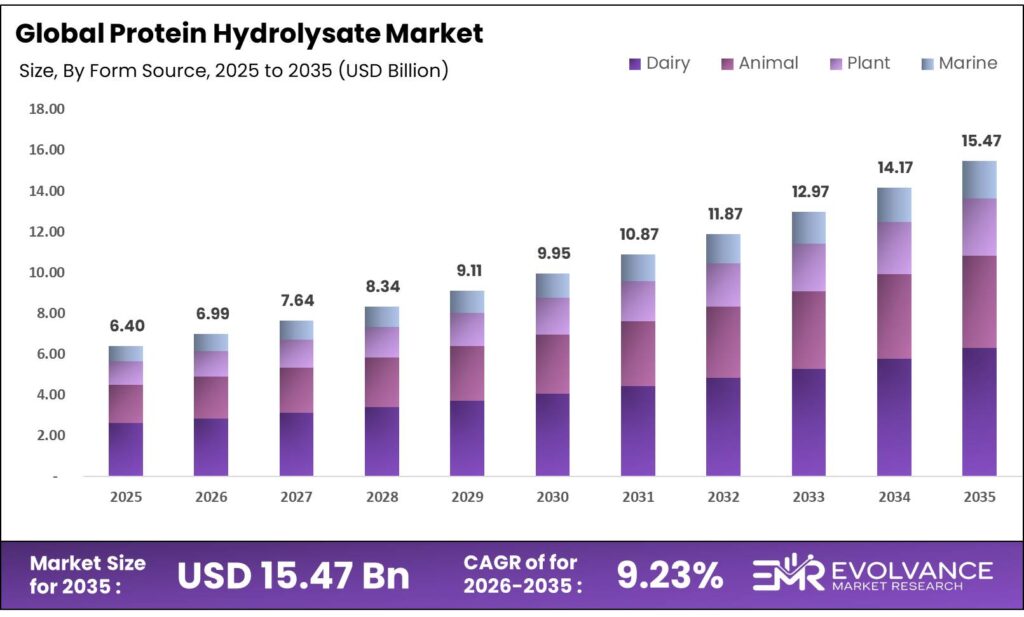
The Global Protein Hydrolysate Market size will be worth around USD 15.47 Billion by 2035 from USD 6.40 Billion in 2025, growing at a CAGR of 9.23% during the forecast period 2026 to 2035. Enzymatic advances are enabling better peptide control, pushing clinical and sports nutrition buyers to shift from intact proteins to hydrolysates. Procurement in infant formula and medical nutrition is moving toward taste-improved, high-density formats. However, high enzymatic processing costs continue to constrain market access for smaller ingredient suppliers.
Market Highlights
- The Global Protein Hydrolysate Market valued at USD 6.40 Billion in 2025, projected to reach USD 15.47 Billion by 2035 at a CAGR of 9.23%.
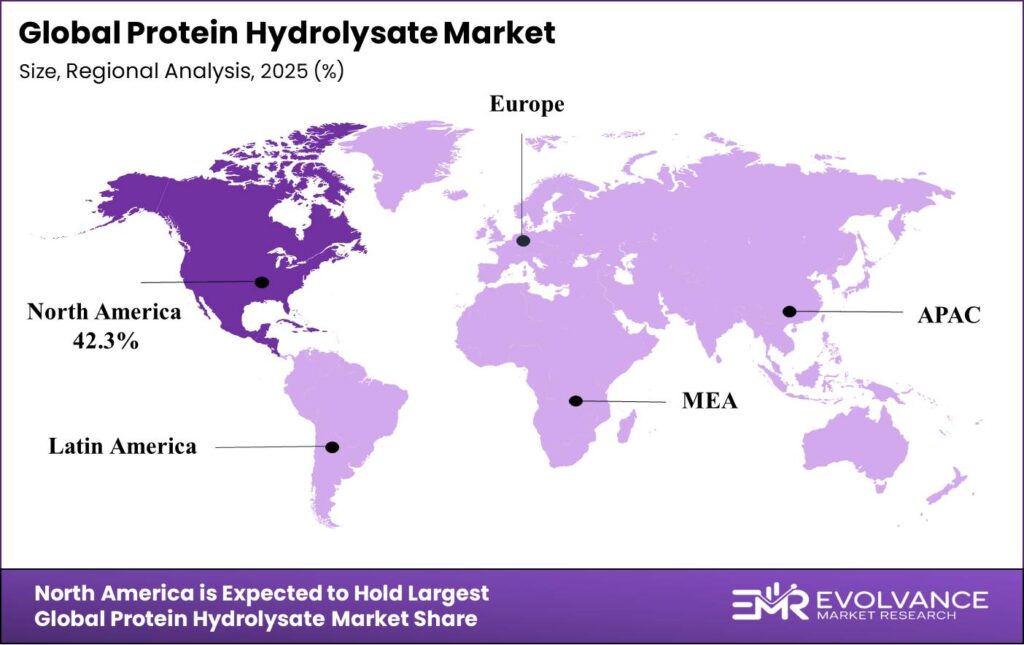
- North America leads regional demand with a 42.3% market share, valued at USD 2.70 Billion.
- Powder form dominates the By Form Type segment with a 76.2% share.
- Dairy source leads the By Source segment with a 43.6% share.
- Food and Beverages leads the By Application segment with a 38.1% share.
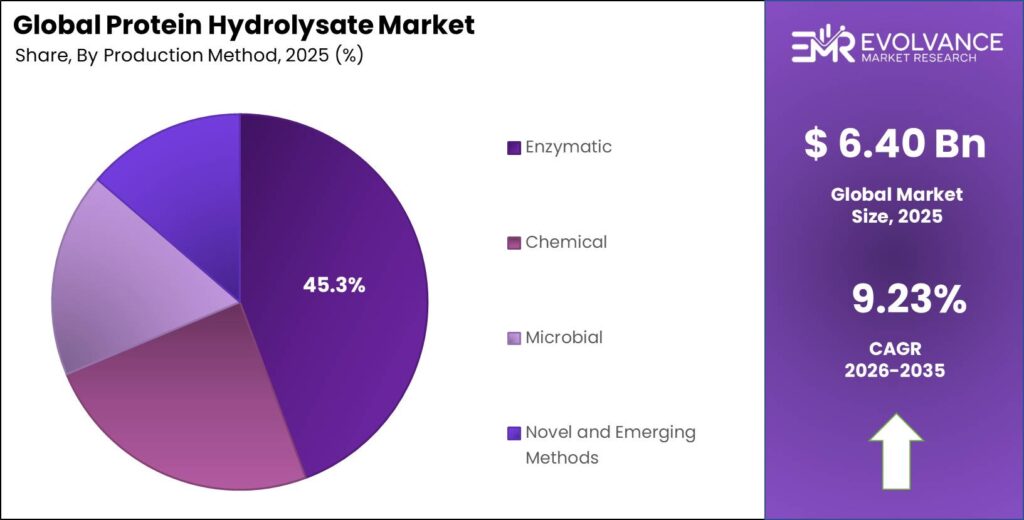
- Enzymatic production method holds the largest By Production Method share at 45.3%.
- Direct Sales leads the By Distribution Channel segment with a 47.2% share.
- B2B Food and Beverage Manufacturers dominate the By End Use segment with a 34.6% share.
Market Overview
Protein hydrolysates are proteins broken into smaller peptide chains through enzymatic, chemical, or microbial processes. They serve as functional ingredients in food, sports nutrition, infant formula, medical nutrition, animal feed, and personal care. Their ability to improve digestion, bioavailability, and allergen reduction makes them valuable across a wide set of industries.
Demand is growing as manufacturers replace intact proteins with hydrolysates in products where faster absorption and reduced allergenicity matter. Clinical nutrition and infant formula producers are the clearest examples — they are shifting toward taste-improved, high-density hydrolysate formats. This shift signals that buyer specifications have become more precise, favoring suppliers with advanced enzymatic capability.
Regulatory bodies are actively reshaping the supply landscape. In July 2024, the FDA confirmed four Arla Foods Ingredients whey protein hydrolysates for use in U.S. infant formula, directly expanding addressable supply channels. The EU followed in October 2024, approving FrieslandCampina Ingredients’ Hyvital Whey HA 300 for infant and follow-on formulas. These approvals signal that regulators are treating hydrolysates as a category worthy of structured oversight — which raises barriers for new entrants but rewards compliant incumbents with durable commercial positions.
Global protein hydrolysate exports recorded 1,588 shipments across 28 exporting countries and 46 importing countries during July 2024 to June 2025. This span across 203 countries shows deep global trade penetration, meaning the supply chain is distributed rather than consolidated — a dynamic that keeps pricing competitive but also creates sourcing complexity for large buyers.
United States protein hydrolysate exports reached 585 shipments during July 2024 to June 2025, accounting for approximately 39% of global export share. This level of export concentration in one country means that supply disruptions in U.S. production facilities would have immediate effects on global ingredient availability — a key procurement risk for international buyers.
Form Type Insights
Powder dominates with 76.2% due to shelf stability and ease of formulation.
In 2025, Powder held a dominant market position in the By Form Type segment of the Protein Hydrolysate Market, with a 76.2% share. Powder hydrolysates offer superior shelf life and are easier to blend into dry mixes, capsules, and powdered supplements — conditions that make them the default choice for B2B food and beverage manufacturers, sports nutrition brands, and infant formula producers. Their lower shipping cost per unit of protein further reinforces the preference.
Liquid hydrolysates serve applications where powder reconstitution adds friction for the end user. Ready-to-drink clinical nutrition, medical beverages, and certain infant formulas require liquid formats with UHT stability and low viscosity. As convenient high-protein delivery formats grow in medical nutrition, liquid hydrolysate demand is expected to track this shift — though it will remain a smaller share of overall volume.
Source Insights
Dairy dominates with 43.6% due to established whey and casein processing infrastructure.
In 2025, Dairy held a dominant market position in the By Source segment of the Protein Hydrolysate Market, with a 43.6% share. Whey protein hydrolysates benefit from decades of processing know-how, scale production, and regulatory recognition — as confirmed by FDA and EU approvals in 2024. Casein and milk hydrolysates add complementary options for slow-release and allergy-management applications, reinforcing dairy’s structural lead in clinical and infant nutrition.
Whey is the most commercially mature dairy sub-segment. Arla Foods Ingredients’ November 2024 launch of Lacprodan DI-3092 — delivering 10g protein per 100ml with improved taste profile — shows whey innovation is now focused on sensory quality rather than basic protein content. This matters because taste compliance in medical nutrition directly affects patient outcomes, making sensory optimization a competitive differentiator.
Casein serves buyers seeking slow-digestion profiles for overnight recovery and meal replacement formats. Its film-forming properties also make it relevant in food processing beyond nutrition. As weight management and functional food categories grow, casein hydrolysate demand will grow alongside them.
Animal source hydrolysates — covering meat, collagen, and egg — serve specialized applications where amino acid profiles and structural proteins matter. Collagen hydrolysates are the most commercially active sub-category, driven by demand in cosmetics, joint health nutraceuticals, and premium food formats. Meat and egg hydrolysates serve niche food formulation and pet nutrition markets.
Marine hydrolysates from fish, seafood, and other marine sources are gaining ground through by-product valorization. Fishing and seafood processing waste is being converted into functional peptides for aquaculture feed, cosmetics, and nutraceuticals — turning a cost center into a revenue stream. This supply model makes marine hydrolysates cost-competitive despite lower production volumes.
Application Insights
Food and Beverages dominates with 38.1% due to broad formulation use across product categories.
In 2025, Food and Beverages held a dominant market position in the By Application segment of the Protein Hydrolysate Market, with a 38.1% share. Hydrolysates improve flavor, solubility, and functional performance in a wide range of food systems — from high-protein beverages and functional foods to bakery, meat alternatives, and dairy substitutes. This cross-category utility makes food and beverages the largest and most structurally stable application segment.
Infant Nutrition is the most regulatory-sensitive application. FDA and EU approvals in 2024 for specific whey hydrolysates in infant formula like Goat milk have created a clearer path to market — but stringent safety requirements also mean that only suppliers with validated hydrolysate profiles can access this segment. Barriers are high, but so is the reward for compliant suppliers.
Animal Feed and Pet Food are growing application areas as premium pet nutrition and aquaculture feed producers seek functional protein ingredients. By-product valorization from fish and marine processing is making marine hydrolysates cost-effective in this segment, supporting both nutrition and palatability.
Cosmetics and Personal Care use hydrolysates — particularly collagen and silk peptides — as conditioning agents in haircare and skincare. Their bioavailability and skin-penetration properties make them effective active ingredients in premium personal care formulations.
Clinical and Medical Nutrition is a high-value segment where taste compliance and protein density are critical. Arla Foods Ingredients’ Lacprodan DI-3092 launch — delivering 10g protein per 100ml with improved palatability — directly addresses the adherence gap in peptide-based medical nutrition. Improved sensory profiles are becoming a clinical outcome driver, not just a marketing feature.
Pharmaceuticals and Nutraceuticals use hydrolysates as bioactive ingredient platforms for gut health, immune function, and metabolic support products. Their peptide-level bioactivity differentiates them from intact protein sources in high-efficacy nutraceutical formulations.
Production Method Insights
Enzymatic dominates with 45.3% due to controlled peptide profiles and clean-label compatibility.
In 2025, Enzymatic held a dominant market position in the By Production Method segment of the Protein Hydrolysate Market, with a 45.3% share. Enzymatic hydrolysis produces controlled peptide profiles without chemical residues, making it the preferred method for infant formula, clinical nutrition, and clean-label applications. Advances in enzyme engineering now allow producers to target specific molecular weight ranges — a precision capability that chemical and microbial methods cannot match.
Chemical hydrolysis remains relevant in applications where cost efficiency outweighs label concerns, such as flavor enhancers and animal feed ingredients. However, acid or alkali treatment produces less predictable peptide profiles and faces growing resistance from clean-label product developers.
Microbial hydrolysis uses fermentation-based enzymatic activity to produce hydrolysates with unique flavor profiles and bioactive peptide concentrations. It serves niche markets in functional foods and nutraceuticals where fermentation-derived attributes add product positioning value.
Novel and Emerging Methods — including high-pressure processing, ultrasonic-assisted hydrolysis, and membrane filtration — are entering pilot and early commercial stages. These methods promise greater selectivity and reduced bitterness, directly addressing the sensory optimization challenge in highly hydrolyzed proteins for medical use.
Distribution Channel Insights
Direct Sales dominates with 47.2% due to large B2B contract volumes and custom specification requirements.
In 2025, Direct Sales held a dominant market position in the By Distribution Channel segment of the Protein Hydrolysate Market, with a 47.2% share. Large food manufacturers, infant formula producers, and clinical nutrition companies require custom hydrolysate specifications that only direct supplier relationships can support. This locks in volume through long-term contracts and reduces price sensitivity — giving suppliers with strong direct sales infrastructure a structural advantage.
Online B2B Platforms are expanding access for mid-tier buyers who previously relied on brokers. Digital procurement platforms enable faster quote comparison, sample ordering, and spec verification — compressing the buying cycle and reducing reliance on intermediaries for standard-grade hydrolysates.
Distributors and Wholesalers remain important for buyers in emerging markets and smaller formulators who lack the volume to negotiate direct supplier terms. They also play a key role in markets where regulatory complexity makes local distribution expertise valuable — such as Southeast Asia and parts of Latin America.
End Use Insights
B2B Food and Beverage Manufacturers dominate with 34.6% due to high-volume procurement and broad formulation use.
In 2025, B2B Food and Beverage Manufacturers held a dominant market position in the By End Use segment of the Protein Hydrolysate Market, with a 34.6% share. These buyers source hydrolysates in large volumes for use across multiple product lines — from protein beverages and functional snacks to dairy alternatives and infant formula bases. Their scale gives them buying power, but it also makes them the most specification-sensitive buyers, pushing supplier innovation.
Pharmaceutical Companies use hydrolysates as excipients and active pharmaceutical ingredients in oral supplements and drug delivery formats. Their regulatory compliance requirements are strict, favoring suppliers with documented quality systems and ingredient traceability.
Direct-To-Consumer Brands in sports nutrition and health supplements are among the fastest-moving buyers, responding to consumer trends by reformulating products on shorter cycles. Their demand for premium hydrolysates — with fast absorption claims and clean labels — supports higher price points and supplier margin.
Research and Academic Institutions purchase hydrolysates in small volumes for bioavailability studies, peptide bioactivity research, and functional food trials. Their procurement is low-volume but high-specification, often driving early commercial validation of novel hydrolysate ingredients.
Market Segments Covered in the Report
By Form Type
- Powder
- Liquid
By Source
- Dairy
- Whey
- Casein
- Milk
- Animal
- Meat
- Collagen
- Egg
- Plant
- Soy
- Pea
- Rice
- Wheat
- Others
- Marine
- Fish
- Seafood
- Marine
By Application
- Food and Beverages
- Functional Foods
- Beverages
- Bakery and Confectionery
- Meat and Meat Alternatives
- Dairy Products and Alternatives
- Sports Nutrition
- Powders and Supplements
- Weight Management Products
- Pre- and Post-Workout Products
- Recovery and Endurance Products
- Infant Nutrition
- Animal Feed and Pet Food
- Cosmetics and Personal Care
- Clinical and Medical Nutrition
- Pharmaceuticals and Nutraceuticals
By Production Method
- Enzymatic
- Chemical
- Microbial
- Novel and Emerging Methods
By Distribution Channel
- Direct Sales
- Online B2B Platforms
- Distributors and Wholesalers Others
By End Use
- B2B Food and Beverage Manufacturers
- Pharmaceutical Companies
- Direct-To-Consumer Brands
- Research and Academic Institutions
- Nutraceutical and Supplement Companies
- Animal Feed and Pet Food Manufacturers
- Cosmetics and Personal Care Companies
Regional Insights
North America Dominates the Protein Hydrolysate Market with a Market Share of 42.3%, Valued at USD 2.70 Billion
North America holds 42.3% of global market value at USD 2.70 Billion, driven by mature procurement infrastructure in clinical nutrition, sports supplements, and infant formula. The FDA’s July 2024 confirmation of four whey protein hydrolysates for U.S. infant formula use directly expanded the commercial base. Established regulatory pathways and large B2B food manufacturers make North America the most commercially productive region for hydrolysate suppliers.
Europe Protein Hydrolysate Market Trends
Europe is the second-largest region, supported by strict food safety regulation and strong demand in clinical nutrition and infant formula. The EU’s October 2024 approval of FrieslandCampina Ingredients’ Hyvital Whey HA 300 under updated Commission Delegated Regulation expands the approved ingredient base for infant and follow-on formulas. The Netherlands logged 100 export shipments during July 2024 to June 2025, confirming its role as a European distribution hub.
Asia Pacific Protein Hydrolysate Market Trends
Asia Pacific is the most dynamic growth region, with infant nutrition and sports supplement demand expanding in China, India, and Southeast Asia. India recorded 525 protein hydrolysate export shipments and 120 import shipments during July 2024 to June 2025 — operating as both a producer and active buyer. Malaysia’s hydrolysate imports reached 51 shipments in a recent trade period, confirming Southeast Asia as an emerging demand center. Strategic supplier partnerships targeting Asia-Pacific represent a near-term market expansion priority.
Latin America Protein Hydrolysate Market Trends
Latin America is an emerging market for protein hydrolysates, with Brazil recording 39 export shipments during July 2024 to June 2025, reflecting the region’s participation in global protein ingredient trade. Mexico adds incremental demand from its food processing sector. Growth in functional foods and dietary supplements is pulling hydrolysate demand from imported sources, signaling an opportunity for suppliers to establish regional distribution agreements.
Middle East & Africa Protein Hydrolysate Market Trends
Middle East and Africa represent the earliest-stage regional market for protein hydrolysates. GCC countries are driving demand through premium infant formula imports and sports nutrition retail growth. South Africa contributes from its food processing and nutraceutical sectors. As disposable income rises and health-focused product categories grow, the region will shift from primarily import-dependent demand to selective local formulation activity over the forecast period.
Key Regions and Countries
North America
- US
- Canada
Europe
- Germany
- France
- The UK
- Spain
- Italy
- Rest of Europe
Asia Pacific
- China
- Japan
- South Korea
- India
- Australia
- Rest of APAC
Latin America
- Brazil
- Mexico
- Rest of Latin America
Middle East & Africa
- GCC
- South Africa
- Rest of MEA
Regulatory Landscape
The FDA issued confirmation in July 2024 permitting four Arla Foods Ingredients whey protein hydrolysates — the Peptigen and Lacprodan ranges — for use in U.S. infant formula. This ruling directly validates specific hydrolysate profiles for allergy management and gut comfort in early-life nutrition, creating a compliant supply pathway that excludes non-validated competitors from the regulated infant formula segment.
The European Commission updated its delegated regulation in October 2024, approving FrieslandCampina Ingredients’ Hyvital Whey HA 300 for use in infant and follow-on formulas. EU ingredient approvals require extensive safety and suitability data, meaning suppliers without validated dossiers cannot access this segment. This regulatory barrier protects approved suppliers but demands sustained compliance investment.
Beyond infant formula, hydrolysates used in clinical and medical nutrition face labeling and safety requirements that vary across jurisdictions. The trend toward heightened regulatory activity — as seen in both FDA and EU actions in 2024 — signals that governments view hydrolysate ingredients as a category requiring structured oversight. Suppliers operating across multiple regions must manage overlapping compliance frameworks, adding cost but also creating credibility advantages for those who meet all standards.
Protein Hydrolysate Market Dynamics
Drivers
FDA and EU Regulatory Approvals Accelerate Commercial Access in Infant and Medical Nutrition
Regulatory clearances are functioning as market entry gates in infant nutrition — and the gates opened wider in 2024. FDA’s confirmation of four whey hydrolysates for U.S. infant formula and EU approval of Hyvital Whey HA 300 create validated supply channels where none existed before. Suppliers with approved ingredient profiles now hold defensible commercial positions against competitors still navigating regulatory pipelines.
These approvals also signal to the broader market that hydrolysate use in early-life nutrition is moving from niche to standard. Infant formula manufacturers can now reformulate toward hypoallergenic hydrolysate bases with regulatory certainty. This is a structural pull for dairy hydrolysate suppliers, particularly those with whey processing capability at clinical-grade quality.
Moreover, Arla Foods Ingredients’ revenue reached EUR 1,015 million in 2024, reflecting a 5.4% increase from EUR 963 million in 2023, driven by global demand for whey-based hydrolysates in clinical and sports nutrition. This revenue trajectory confirms that regulatory-approved hydrolysate ingredients command premium pricing — validating the commercial case for sustained compliance investment.
Restraints
High Enzymatic Processing Costs Limit Pricing Accessibility for Mid-Tier Buyers
Enzymatic hydrolysis produces superior peptide control, but the process requires expensive enzyme inputs, controlled reaction environments, and multi-step purification. These costs sit significantly above intact protein processing, making hydrolysates a premium ingredient that smaller food manufacturers and budget-constrained buyers cannot easily adopt. The cost gap narrows the total addressable buyer base.
Evolving regulatory requirements in infant formula and medical nutrition add a second cost layer. Suppliers must invest in safety validation, suitability documentation, and labeling compliance across multiple jurisdictions. For companies without dedicated regulatory teams, these requirements can halt commercialization — effectively reserving the most lucrative application segments for well-resourced incumbents.
Furthermore, the global protein hydrolysate export market experienced a -4% year-on-year change between July 2023–June 2024 and July 2024–June 2025. This contraction suggests that cost-sensitive buyers are moderating import volumes, limiting the near-term upside for export-dependent suppliers. Price reduction without process innovation is not a viable response — margin management and product differentiation are the more durable strategies.
Growth Factors
Hypoallergenic Hydrolysates and Plant-Based Innovation Open New Revenue Segments
Medical nutrition for patients with impaired digestive function is a high-value growth area. Taste-improved, high-density hydrolysate formats — such as Arla Foods Ingredients’ Lacprodan DI-3092 delivering 10g protein per 100ml — directly address adherence challenges in clinical settings. Better compliance translates to better clinical outcomes, making sensory-improved hydrolysates a measurable value proposition for hospital procurement teams.
Plant-based hydrolysates are entering high-growth phases. Glanbia and Roquette launched pea and rice hydrolysates in 2025 as allergen-free, sustainable alternatives in functional foods and beverages. Findings from Volza show that global protein hydrolysate trade involved 210 exporters and 211 buyers during July 2024 to June 2025 — a breadth of trade that reflects how quickly plant-based hydrolysate supply chains are maturing across geographies.
Additionally, marine hydrolysates from fish and seafood processing by-products are creating new revenue streams in aquaculture feed and premium pet nutrition. By turning processing waste into functional ingredients, producers reduce input costs while accessing growing markets. New Zealand’s 44 export shipments during July 2024 to June 2025 reflect this dairy- and marine-driven production capacity extending into global trade flows.
Emerging Trends
Sensory Optimization and Sustainable Sourcing Reshape Supplier Differentiation
Bitterness reduction in highly hydrolyzed whey proteins is no longer a product quality issue — it is a clinical compliance issue. Patients in medical nutrition who cannot tolerate bitter peptide-based products stop using them, making taste optimization a clinical outcome driver. Suppliers who solve bitterness technically — through enzyme selection, membrane fractionation, or masking formulation — gain access to the most sensitive and highest-value buyer segment.
The shift toward marine and plant-derived hydrolysates reflects a broader clean-label movement in food and feed formulation. By-product utilization from fishing and agricultural processing aligns with sustainability commitments that major food companies now embed in their procurement criteria. Spain’s hydrolysate imports reached 165 shipments during July 2024 to June 2025, accounting for approximately 14% of global import share — showing that European buyers with strong sustainability cultures are active importers of these ingredient categories.
Furthermore, integration of hydrolysates into UHT-stable ready-to-drink and ready-to-mix formats is driven by consumer preference for convenient protein delivery. This format shift creates formulation challenges — maintaining protein solubility, flavor stability, and viscosity under thermal processing — that only suppliers with advanced processing capability can consistently solve. Early movers who deliver stable, palatable RTD hydrolysate formats will capture the high-margin convenient protein segment.
Key Companies Insights
Arla Foods operates as a fully integrated dairy cooperative with end-to-end control from milk collection to clinical-grade hydrolysate production. Arla Foods Ingredients reached EUR 1,015 million in revenue in 2024, with an 80.1% value-add share from Europe-based operations. Their ability to secure FDA and EU regulatory approvals for specific hydrolysate ingredients — while simultaneously launching sensory-optimized formats — gives them a dual commercial advantage in both regulated and open markets.
Glanbia PLC brings strong sports nutrition and functional ingredient distribution across North America and Europe. Their 2025 launch of plant-based pea and rice hydrolysates positions them at the intersection of two demand trends: sports nutrition’s shift toward plant protein and functional food brands’ move to allergen-free ingredients. Glanbia’s direct access to end-consumer brands through its own nutrition labels gives it market intelligence that pure ingredient suppliers lack.
Archer Daniels Midland Company leverages its global agricultural processing scale to supply plant-derived hydrolysates — particularly soy-based — across food, feed, and industrial applications. ADM’s integrated supply chain from raw crop sourcing to protein processing gives it cost advantages in plant hydrolysate production. As food manufacturers scale plant-based product lines, ADM’s ability to supply high volumes at consistent specifications makes it a preferred supplier for large B2B buyers.
Nestlé S.A. applies protein hydrolysate technology primarily in its infant nutrition and clinical nutrition portfolios. With proprietary processing capability and global distribution, Nestlé uses hydrolysates as a functional differentiator in products targeting allergy management and medical dietary needs. Their internal R&D investment in hydrolysate science means they function as both a buyer of hydrolysate ingredients and a competitor to open-market suppliers in finished product markets.
Key Companies
- Arla Foods
- Agrilife
- BRISK BIO
- Glanbia PLC
- Archer Daniels Midland Company
- Tate and Lyle PLC
- Danone Nutricia
- Nestlé S.A.
- Koninklijke DSM N.V.
- Abbott
- Kerry Group PLC
Recent Development
- In November 2024, Arla Foods Ingredients received regulatory approval to acquire Volac’s Whey Nutrition business to strengthen its position in whey-based protein ingredients.
- In February 2025, Arla Foods announced over EUR 1 billion in investments in 2024, including expanded capacity for specialized whey proteins via Danmark Protein and a new permeate dryer facility in Argentina.
- In February 2026, Arla Foods reported continued expansion of its ingredients business driven by strong demand for protein ingredients, contributing to record EUR 15.1 billion revenue in 2025.
- In September 2024, Arla Foods Ingredients continued innovation in specialized whey protein ingredients, achieving 5.4% revenue growth in its ingredients segment driven by value-added protein solutions (including hydrolysates).
- In August 2024, Arla Foods reported EUR 6.6 billion revenue in H1 2024, supported by strong growth in branded protein products and rising demand for dairy-based nutrition solutions.
Market Scope
| Report Features | Description |
|---|---|
| Market Value (2025) | USD 6.40 Billion |
| Forecast Revenue (2035) | USD 15.47 Billion |
| CAGR (2026-2035) | 9.23% |
| Base Year for Estimation | 2025 |
| Historic Period | 2020-2024 |
| Forecast Period | 2026-2035 |
| Report Coverage | Revenue Forecast, Market Dynamics, Competitive Landscape, Recent Developments |
| Segments Covered | By Form Type (Powder, Liquid), By Source (Dairy, Animal, Plant, Marine), By Application (Food and Beverages, Sports Nutrition, Infant Nutrition, Animal Feed and Pet Food, Cosmetics and Personal Care, Clinical and Medical Nutrition, Pharmaceuticals and Nutraceuticals), By Production Method (Enzymatic, Chemical, Microbial, Novel and Emerging Methods), By Distribution Channel (Direct Sales, Online B2B Platforms, Distributors and Wholesalers Others), By End Use (B2B Food and Beverage Manufacturers, Pharmaceutical Companies, Direct-To-Consumer Brands, Research and Academic Institutions, Nutraceutical and Supplement Companies, Animal Feed and Pet Food Manufacturers, Cosmetics and Personal Care Companies) |
| Regional Analysis | North America (US and Canada), Europe (Germany, France, The UK, Spain, Italy, and Rest of Europe), Asia Pacific (China, Japan, South Korea, India, Australia, and Rest of APAC), Latin America (Brazil, Mexico, and Rest of Latin America), Middle East & Africa (GCC, South Africa, and Rest of MEA) |
| Competitive Landscape | Arla Foods, Agrilife, BRISK BIO, Glanbia PLC, Archer Daniels Midland Company, Tate and Lyle PLC, Danone Nutricia, Nestlé S.A., Koninklijke DSM N.V., Abbott, Kerry Group PLC |
| Customization Scope | Customization for segments, region/country-level will be provided. Moreover, additional customization can be done based on the requirements. |
| Purchase Options | We have three licenses to opt for: Single User License, Multi-User License (Up to 5 Users), Corporate Use License (Unlimited User and Printable PDF) |
