What is the Metal Additive Manufacturing Market Size?
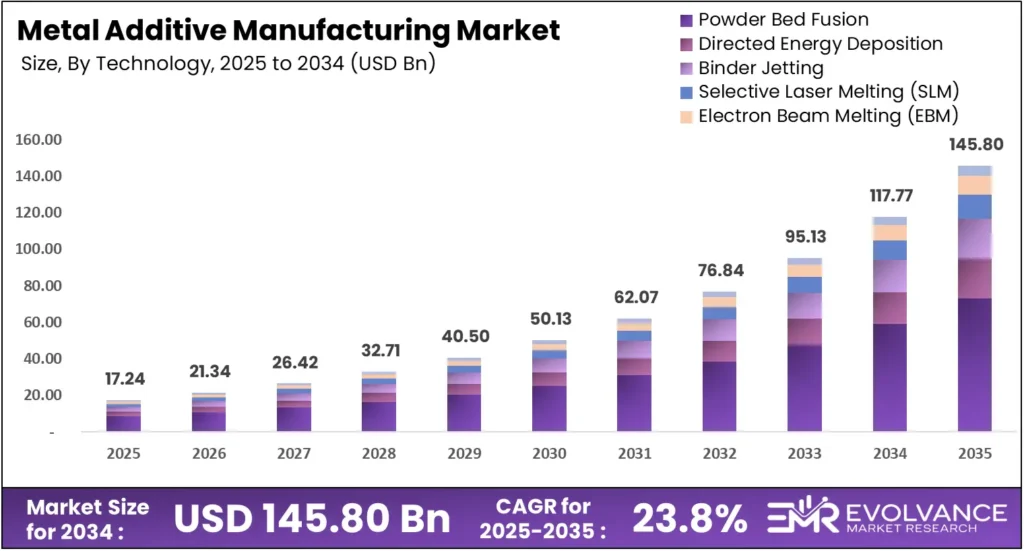
The global Metal Additive Manufacturing market will reach USD 145.80 billion by 2035 from USD 17.24 billion in 2025, growing at a CAGR of 23.8% during the forecast period 2026 to 2035. Aerospace, defense, and medical manufacturers are pushing adoption as metal AM moves from prototyping into serial production. North America leads all regions with a 42.6% share, valued at USD 7.32 billion in 2025.
Market Highlights
- The global Metal Additive Manufacturing market is valued at USD 17.24 billion in 2025 and is projected to reach USD 145.80 billion by 2035, growing at a CAGR of 23.8%.
- Powder Bed Fusion dominates the technology segment with a 49.3% market share, driven by precision requirements in aerospace and medical applications.
- Aerospace & Defense leads the application segment with a 36.8% share, anchored by flight-critical part qualification programs at Boeing, GE Aviation, and Lockheed Martin.
- North America holds the largest regional share at 42.6%, valued at USD 7.32 billion in 2025, supported by a strong aerospace and defense manufacturing base.
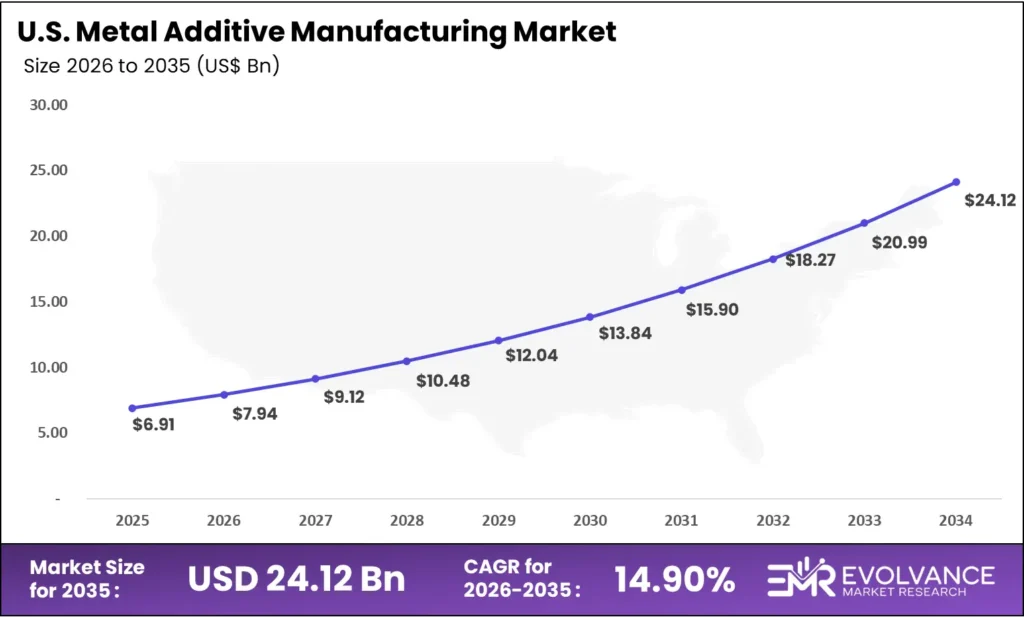
- The United States alone accounts for approximately 94% of the North American market, reaching USD 6.91 billion in 2025 and projected to grow to USD 27.67 billion by 2035 at a CAGR of 14.9%.
- Global metal AM system shipments reached 3,793 units in 2023, a 24.4% increase from 3,049 units in 2022.
- Asia Pacific averaged 19.8% revenue growth in 2025, making it the fastest-growing region in the metal AM market.
- AM services grew 15.5% in 2025, now representing 48% of total AM market value, while system sales rebounded only 3.6%.
Market Overview
The metal additive manufacturing market covers industrial processes that build fully dense metal parts layer by layer from digital files, serving aerospace, automotive, medical, defense, and energy manufacturers that need complex geometries, low-volume precision parts, or performance properties no standard process can match.
Evolvance Market Research analysts found consistent demand signals across 5 regional markets and 4 segmentation dimensions — technology, application, material, and component — covering 16 active companies across the full value chain, giving buyers a clear view of where value concentrates and which segments are compressing margins.
Metal additive manufacturing solves a core production constraint. Aerospace, automotive, and medical buyers need parts lighter, stronger, and more geometrically complex than casting allows. Existing tooling costs and lead time make standard supply chains unworkable for these geometries. Metal AM operates as the highest-value sub-category within the broader industrial 3D printing sector, spanning metal and polymer additive processes across the same industrial buyer base.
According to Wohlers Report 2026, AM revenues reached USD 24.2 billion in 2025 — with printing services at 48% of total value. Wohlers Report 2024 confirmed the industry reached USD 20.035 billion in 2023, representing 11.1% growth across 245 contributing organizations.
Metal Additive Manufacturing Market Segmentation Analysis
Technology choice defines cost per part, qualification pathway, and production volume ceiling — making the By Technology segment the highest-value dimension for operators and investors. Application segmentation reveals where certified demand is concentrated today, while material and component segments show where recurring revenue and supply chain leverage sit across the metal AM value chain.
Powder Bed Fusion Leads Technology Segment with 49.3% Share
| Sub-segment | Share % | Primary Driver |
|---|---|---|
| Powder Bed Fusion | 49.3% | Precision complex-geometry aerospace and medical parts |
| Directed Energy Deposition | N/A | Large-format repair and cladding in defense and energy |
| Binder Jetting | N/A | High-throughput lower-cost-per-part mid-market production |
| Selective Laser Melting (SLM) | N/A | Single-material full-density aerospace and medical production |
| Electron Beam Melting (EBM) | N/A | Titanium implant and aerospace structural part production |
| Material Extrusion | N/A | Low-cost entry-level metal part prototyping and tooling |
| Sheet Lamination | N/A | Multi-material and embedded-component niche applications |
Powder Bed Fusion dominates with 49.3% due to unmatched precision in complex aerospace parts.
In 2025, Powder Bed Fusion held a dominant market position in the By Technology segment of the Metal Additive Manufacturing Market, with a 49.3% share. This process covers both Laser Powder Bed Fusion (LPBF) and Electron Beam variants, producing the tightest dimensional tolerances of any metal AM method. Aerospace buyers use this process for flight-critical brackets and turbine components qualified under ISO/ASTM 52904.
Selective Laser Melting Leads the Metal Additive Manufacturing Market
Selective Laser Melting (SLM) — the most commercially deployed LPBF variant — builds fully dense single-material parts from titanium, Inconel, and stainless steel alloys with surface finish and mechanical properties that match or exceed casting. EOS GmbH, Nikon SLM Solutions, and TRUMPF anchor this segment with multi-laser platforms targeting serial aerospace and medical production runs.
Metal Binder Jetting Reshapes High-Volume Production Economics
Binder Jetting deposits a binding agent onto metal powder beds at speeds up to 100× faster than LPBF, then sinters the part to near-full density. This process targets mid-market manufacturers needing hundreds to thousands of identical parts per run — where laser-based cost-per-part becomes prohibitive — making it a disruptive force in high-volume segments.
Directed Energy Deposition (DED) uses a focused laser or electron beam to melt metal feedstock — wire or powder — as it deposits, enabling large-format part building and repair of existing components. Defense and energy operators value DED for turbine blade restoration and structural cladding on high-value assets, with WAAM variants cutting feedstock costs by replacing powder with wire.
Metal Additive Manufacturing Technology Comparison by Process
| Technology | Speed | Precision | Best Application | Key Players |
|---|---|---|---|---|
| Powder Bed Fusion (LPBF) | Medium | Very High | Aerospace, medical implants | EOS GmbH, TRUMPF, Nikon SLM Solutions |
| Electron Beam Melting (EBM) | Medium | High | Titanium aerospace and implants | GE Additive (Arcam) |
| Directed Energy Deposition | High | Medium | Repair, large structures, defense | DMG Mori, Optomec, BeAM Machines |
| Binder Jetting | Very High | Medium-High | High-volume mid-market parts | Desktop Metal, ExOne |
| Material Extrusion | Low | Medium | Prototyping, tooling, low-cost | Markforged, Desktop Metal |
| Sheet Lamination | High | Low-Medium | Multi-material niche parts | Fabrisonic |
Aerospace and Defense Leads Application Segment with 36.8% Share
| Sub-segment | Share % | Primary Driver |
|---|---|---|
| Aerospace & Defense | 36.8% | Flight-critical part qualification and weight reduction |
| Automotive | N/A | EV lightweighting and low-volume performance parts |
| Medical & Dental | N/A | Patient-specific implants and surgical tooling |
| Energy | N/A | Turbine repair and heat exchanger production |
| Industrial Machinery & Heavy Equipment | N/A | Complex tooling and on-demand spare parts |
| Consumer Goods | N/A | Customized high-value product components |
Aerospace & Defense dominates with 36.8% due to certified complex part demand from Boeing and Lockheed Martin.
In 2025, Aerospace & Defense held a dominant market position in the By Application segment of the Metal Additive Manufacturing Market, with a 36.8% share. Boeing, GE Aviation, and Lockheed Martin drive this share through qualification programs for flight-critical titanium and Inconel parts, where metal AM reduces buy-to-fly ratios and cuts lead times versus forged alternatives.
Automotive manufacturers use metal AM primarily for low-volume performance parts, motorsport components, and EV powertrain structures where lightweighting directly extends battery range. Ford, GM, and Tesla have each qualified metal AM parts for production vehicles, though high per-part cost still limits metal additive manufacturing in automotive to premium platforms and racing applications.
Medical & Dental buyers represent the fastest-growing certified application segment, with patient-specific titanium implants and cobalt-chrome dental frameworks qualifying under ISO 10993 biocompatibility standards. Orthopedic and spinal device manufacturers value porous lattice structures that metal AM produces — surface topographies encouraging bone ingrowth that no machining or casting process can replicate at comparable unit economics.
Energy sector operators use metal AM to restore high-value turbine components — blades, nozzles, and combustion liners — and to produce complex heat exchangers with internal channel geometries that stamping cannot form. Directed Energy Deposition dominates energy repair applications, while Powder Bed Fusion handles new production parts for gas turbines where alloy performance under extreme heat is non-negotiable.
Titanium Alloys Lead the Metal AM Materials Segment
Titanium Alloys lead the Material segment.
| Sub-segment | Dominant | Primary Driver |
|---|---|---|
| Titanium Alloys (Ti-6Al-4V) | Yes | Aerospace structural and medical implant demand; highest strength-to-weight ratio of any printable alloy; qualified under AMS specifications and ISO/ASTM 52907 |
| Nickel Alloys (IN718, IN625) | No | High-temperature turbine and combustion component production where oxidation resistance above 600°C is required |
| Stainless Steels (316L, 17-4PH) | No | Industrial tooling, medical instruments, and chemical processing parts requiring corrosion resistance at moderate cost |
| Aluminum Alloys (AlSi10Mg) | No | Automotive and consumer electronics lightweighting where low density and thermal conductivity are the primary selection criteria |
| Cobalt-Chrome Alloys | No | Dental frameworks and orthopedic implants requiring biocompatibility and wear resistance under ISO 10993 |
| Copper Alloys | No | Heat exchangers and RF waveguides where thermal and electrical conductivity drive material selection |
| Tool Steels | No | Conformal cooling inserts in injection molds where complex internal channel geometry cuts cycle time |
| Precious Metals | No | Jewelry and dental prosthetics in gold and platinum alloys where material value justifies AM economics |
Systems Lead the Metal Additive Manufacturing Component Segment
Systems lead the Component segment.
| Sub-segment | Dominant | Primary Driver |
|---|---|---|
| Systems | Yes | Capital hardware sales from OEMs including EOS GmbH, TRUMPF, and GE Additive driving initial market revenue; Wohlers 2026 signals system sales rebounding at 3.6% as services outpace hardware |
| Materials | No | Recurring powder revenue growing as installed base expands; metal AM materials market is the fastest-growing revenue stream as production volumes scale beyond prototyping |
| Service & Parts | No | Post-processing, contract manufacturing, and maintenance services growing at 15.5% in 2025 per Wohlers Report 2026, now representing 48% of total AM market value |
Market Segments Covered in the Report
By Technology
- Powder Bed Fusion
- Directed Energy Deposition
- Binder Jetting
- Selective Laser Melting (SLM)
- Electron Beam Melting (EBM)
- Material Extrusion
- Sheet Lamination
By Application
- Aerospace & Defense
- Automotive
- Medical & Dental
- Energy
- Industrial Machinery & Heavy Equipment
- Consumer Goods
By Material
- Titanium Alloys
- Nickel Alloys
- Stainless Steels
- Aluminum Alloys
- Cobalt-Chrome Alloys
- Copper Alloys
- Tool Steels
- Precious Metals
By Component
- Systems
- Materials
- Service & Parts
United States Metal Additive Manufacturing Market
The United States metal additive manufacturing market reaches USD 6.91 billion in 2025, growing to USD 24.12 billion by 2035 at a CAGR of 14.9%. The U.S. holds roughly 94% of the North American market, anchored by the world’s largest aerospace and defense procurement base.
Boeing, GE Aviation, and Lockheed Martin run active metal AM qualification programs for flight-critical components, and the U.S. Department of Defense Additive Manufacturing for Sustainment program is accelerating adoption at military depots and shipyards. This combination of private-sector demand and government-backed qualification makes the U.S. the single most important geography for metal AM capital deployment decisions through 2035.
Metal Additive Manufacturing Market Regional Insights
North America Holds 42.6% Share at USD 7.32 Billion
| Region | Market Value | Share % | Year |
|---|---|---|---|
| North America | USD 7.32 Billion | 42.6% | 2025 |
| Europe | N/A | N/A | 2025 |
| Asia Pacific | N/A | N/A | 2025 |
| Latin America | N/A | N/A | 2025 |
| Middle East & Africa | N/A | N/A | 2025 |
North America commands the largest regional share at 42.6% — USD 7.32 billion in 2025 — supported by a defense procurement base and aerospace OEM ecosystem that no other region matches in certified metal AM production volume. This concentration means North America will absorb a disproportionate share of new capital equipment investment through 2035.
The North America metal additive manufacturing market runs on U.S. defense and aerospace demand — Boeing, GE Aviation, and Lockheed Martin operate the most advanced certified metal AM supply chains globally. The U.S. Department of Defense Additive Manufacturing for Sustainment program further accelerates adoption at military depots, making government procurement a structural demand floor.
Asia Pacific Metal Additive Manufacturing Market Trends
Asia Pacific is the fastest-growing region in metal AM — Wohlers Report 2026 confirmed Asia-Pacific companies averaged 19.8% revenue growth in 2025, well ahead of 12.6% in the Americas and 9.0% in EMEA. Farsoon Technologies and BLT (Bright Laser Technologies) are expanding globally on system pricing that undercuts Western OEMs on comparable LPBF platforms.
Europe Metal Additive Manufacturing Market Trends
Europe remains the global center of metal AM system manufacturing — EOS GmbH, TRUMPF, and Renishaw all operate primary production and R&D facilities in Germany, the UK, and Italy. Horizon Europe has committed EUR 600 million to additive manufacturing R&D programs, making Europe the strongest government-backed innovation market outside the United States.
Latin America Metal Additive Manufacturing Market Trends
Latin America represents an early-stage metal AM market, with Brazil leading adoption through aerospace MRO and oil and gas sector demand for on-demand spare parts. Limited local powder supply chains and a small certified industrial buyer base constrain volume growth in 2025, though service bureaus are expanding access for mid-market manufacturers who cannot justify capital equipment purchases at present system prices.
Middle East and Africa Metal Additive Manufacturing Trends
The Middle East and Africa market is driven by UAE and Saudi Arabia defense modernization programs and energy sector MRO demand, with both governments actively investing in domestic advanced manufacturing under Vision 2030 and similar national industrial strategies. GCC buyers source most certified metal AM parts from European and North American service bureaus in 2025, creating a near-term import dependency.
Key Regions and Countries
North America
- US
- Canada
Europe
- Germany
- France
- The UK
- Spain
- Italy
- Rest of Europe
Asia Pacific
- China
- Japan
- South Korea
- India
- Australia
- Rest of APAC
Latin America
- Brazil
- Mexico
- Rest of Latin America
Middle East & Africa
- GCC
- South Africa
- Rest of MEA
Regulatory Landscape
ISO ASTM Standards and FAA Approval Shape Metal AM Qualification
The ISO/ASTM 52900 series — maintained by ASTM International F42 Committee and ISO TC 261 — establishes the global vocabulary, process classification, and quality framework for metal AM. Updated guidance under ISO/ASTM 52904 governs LPBF process qualification, giving aerospace buyers a certified pathway for flight-hardware approval under FAA and EASA rules.
FAA and EASA guidance issued between 2022 and 2025 allows metal AM components in type-certificated aircraft, conditional on full material traceability, in-process monitoring — increasingly supported by digital twin in manufacturing platforms — and post-process inspection.
The U.S. Department of Defense requires feedstock traceability, machine qualification logs, and destructive test coupons for all metal AM defense parts under MIL-STD guidelines. Medical buyers face ISO 10993 and ISO 13485 requirements for implant-grade alloys — adding a 12–18 month qualification runway that raises barriers for new market entrants.
Drivers
Aerospace Demand Drove Metal AM Shipments to 3,793 Units in 2023
According to Wohlers Report 2024, metal AM system shipments reached 3,793 units in 2023 — up 24.4% from 3,049 units in 2022. This was the highest annual unit count in 21 consecutive years of tracking. Aerospace and defense qualification programs drove this acceleration as Boeing, GE Aviation, and Lockheed Martin expanded certified production volume.
In our view, the shift from prototyping to serial production is the single most consequential structural change in metal AM demand. Aerospace and defense buyers are no longer evaluating metal AM against design intent — they are qualifying it against forged and machined supply chains on cost, lead time, and part performance, locking in recurring production contracts.
According to PR Newswire, VulcanForms raised USD 220 million Series D in February 2026 to scale its integrated digital metal manufacturing facilities near Boston, Massachusetts. When growth-stage capital at this scale targets a single metal AM operator, it signals institutional confidence in the future of additive manufacturing as a serial production platform.
Restraints
Slow System Sales Rebound Signals Metal AM Market Maturation in 2025
Wohlers Report 2026 confirmed AM services grew 15.5% in 2025 while system sales rebounded only 3.6% — exposing the divergence between vendor revenue ambitions and actual hardware demand. System OEMs that built on prototype-era growth assumptions now face a market where buyers prefer service bureau access over capital equipment ownership.
Post-processing remains the largest hidden cost barrier in metal AM adoption — every LPBF part requires hot isostatic pressing (HIP), heat treatment, support removal, and surface finishing before it meets drawing tolerances. These steps add 30–50% to total part cost and require specialized equipment and skilled operators that most mid-market manufacturers do not have in-house.
Metal powder supply chains carry concentration risk that most buyers underestimate — titanium and nickel superalloy powders meeting ISO/ASTM 52907 specifications are produced by a small number of qualified suppliers including Höganäs AB and Carpenter Technology. Any supply disruption or tariff escalation affecting raw titanium sponge sourcing from China or Russia creates immediate cost and availability pressure.
Growth Factors
Defense Investment and Metal AM Materials Demand Drive Growth
According to Machina Labs, Machina Labs closed USD 124 million Series C in February 2026, led by Woven Capital (Toyota’s growth venture arm) and Lockheed Martin Ventures, to build a 200,000 sq ft Intelligent Factory housing up to 50 RoboCraftsman metal-forming robotic cells for defense and aerospace customers.
According to Renishaw’s FY2024 results, Renishaw launched the RenAM 500 Ultra with TEMPUS technology, cutting metal AM build times by up to 50% and driving strong second-half sales from medical sector customers. Process speed improvements of this magnitude change the ROI calculation for serial production buyers evaluating metal AM against machined alternatives.
The metal AM materials market is the fastest-growing recurring revenue stream in the value chain — as the global installed base of metal AM systems expands, powder consumption scales proportionally without requiring new capital equipment sales. Höganäs AB and Carpenter Technology are positioned as primary beneficiaries, supplying qualified titanium, nickel, and stainless steel powders to a growing production base.
Emerging Trends
Consolidation Reshapes the Metal AM Competitive Landscape
According to GlobeNewswire, Nano Dimension announced it would acquire Desktop Metal for USD 183 million — a 27.3% premium — in July 2024, signaling that the era of standalone metal AM startups is ending. Consolidation concentrates IP and customer bases under fewer entities, reducing vendor optionality for industrial buyers.
Chinese OEM expansion is reshaping the global competitive map — Farsoon Technologies and BLT are qualifying multi-laser LPBF platforms at significantly lower price points, driven by Made in China 2025 mandates and a national push toward advanced and intelligent manufacturing that prioritizes cost-competitive serial production across domestic and export markets.
The metal AM service bureau model is accelerating mid-market adoption — manufacturers without capital budget for USD 500,000–1,000,000 LPBF systems are qualifying parts through contract bureaus such as Materialise and SPEE3D, accessing certified metal AM production without machine ownership. This shift confirms the broader additive manufacturing industry transition from hardware sales to recurring services revenue.
Metal Additive Manufacturing Market Key Companies Insights
We believe EOS GmbH holds the strongest defensible position in the global metal additive manufacturing competitive landscape — the company’s open-parameter LPBF platforms and proprietary powder qualification ecosystem create switching costs that persist across machine generations, anchoring the established industrial OEM archetype alongside TRUMPF and GE Additive.
According to 3D Systems’ press release, 3D Systems revenue reached USD 440.1 million in FY2024, down 10% from USD 488.1 million — with Industrial Solutions at USD 250.4 million and Healthcare Solutions at USD 189.7 million. The revenue decline reflects broader hardware market softness that hit system OEMs hardest in 2024.
According to Stratasys’ investor release, Stratasys total revenue reached USD 572.5 million in FY2024, down 8.8%, with systems falling 25.3% to USD 140.3 million while consumables held at USD 251.7 million. According to Stratasys’ announcement, Fortissimo Capital invested USD 120 million at a 10.6% premium in February 2025.
Renishaw plc posted record revenue of GBP 691.3 million in FY2024 — 3.7% underlying growth at constant currency — with strong second-half demand for multi-laser AM systems from medical customers, per Renishaw’s FY2024 preliminary results. Nikon SLM Solutions separately reported EUR 150 million in 2024 revenue, representing 36% growth, with NXG XII 600 production expanding in the United States.
Key Companies
- EOS GmbH
- 3D Systems Corporation
- GE Additive
- HP Inc.
- SLM Solutions Group AG
- Renishaw plc
- Desktop Metal Inc.
- Stratasys Ltd.
- Additive Industries
- Optomec Inc.
- Höganäs AB
- TRUMPF Group
- Materialise NV
- voxeljet AG
- DMG MORI
- Carpenter Technology Corporation
Recent Development
Metal AM Consolidation and Investment Activity 2024–2025
- April 2025 — Nano Dimension completed its Desktop Metal acquisition for USD 179.3 million. The deal closed at USD 5.295 per share following a court ruling upholding the merger obligation. The combined entity targets over USD 200 million in annual FY2024 revenue. According to GlobeNewswire, Nano Dimension completed the Desktop Metal acquisition in April 2025.
- April 2025 — Nano Dimension completed the acquisition of Markforged for USD 116 million (USD 5.00 per share), gaining access to 15,000+ deployed systems and approximately USD 85 million in 2024 annual revenue at roughly 50% non-GAAP gross margin. According to GlobeNewswire, the Markforged acquisition closed April 25, 2025.
- September 2024 — Nano Dimension announced it would acquire Markforged at USD 5.00 per share — a 71.8% premium to the September 24, 2024 VWAP — for total consideration of USD 115 million. According to GlobeNewswire, Nano Dimension announced the Markforged acquisition in September 2024.
- March 2025 — Delaware Court of Chancery ruled on March 24, 2025 that Nano Dimension had materially breached its Merger Agreement with Desktop Metal and must complete the acquisition. According to Nano Dimension’s investor relations, the court ruling obligated Nano Dimension to close the Desktop Metal deal.
- March 2025 — 3D Systems reported a net loss of USD 255.6 million for FY2024 — an improvement of USD 107.1 million versus prior year — with gross profit margin declining to 37.3% from 40.2% in 2023, per 3D Systems’ FY2024 press release.
- March 2025 — Stratasys reported adjusted EBITDA of USD 26.0 million for FY2024, ending the year with USD 150.7 million in cash and no debt on the balance sheet, per Stratasys’ FY2024 investor release — signaling financial stability despite top-line contraction.
- September 2024 — Renishaw completed the first phase of expansion of its Miskin, Wales production facility on time and under budget, adding manufacturing floor capacity for AM, CMM, and encoder products; total capital expenditure for the year reached GBP 65.2 million, per Renishaw’s FY2024 preliminary results.
Market Scope
| Report Features | Description |
|---|---|
| Market Value (2025) | USD 17.24 Billion |
| Forecast Revenue (2035) | USD 145.80 Billion |
| CAGR (2026–2035) | 23.8% |
| Base Year for Estimation | 2025 |
| Historic Period | 2020–2024 |
| Forecast Period | 2026–2035 |
| Report Coverage | Revenue Forecast, Market Dynamics, Competitive Landscape, Recent Developments |
| Segments Covered | By Technology (Powder Bed Fusion, Directed Energy Deposition, Binder Jetting, Selective Laser Melting, Electron Beam Melting, Material Extrusion, Sheet Lamination), By Application (Aerospace & Defense, Automotive, Medical & Dental, Energy, Industrial Machinery & Heavy Equipment, Consumer Goods), By Material (Titanium Alloys, Nickel Alloys, Stainless Steels, Aluminum Alloys, Cobalt-Chrome Alloys, Copper Alloys, Tool Steels, Precious Metals), By Component (Systems, Materials, Service & Parts) |
| Regional Analysis | North America (US and Canada), Europe (Germany, France, The UK, Spain, Italy, and Rest of Europe), Asia Pacific (China, Japan, South Korea, India, Australia, and Rest of APAC), Latin America (Brazil, Mexico, and Rest of Latin America), Middle East & Africa (GCC, South Africa, and Rest of MEA) |
| Competitive Landscape | EOS GmbH, 3D Systems Corporation, GE Additive, HP Inc., SLM Solutions Group AG, Renishaw plc, Desktop Metal Inc., Stratasys Ltd., Additive Industries, Optomec Inc., Höganäs AB, TRUMPF Group, Materialise NV, voxeljet AG, DMG MORI, Carpenter Technology Corporation |
| Customization Scope | Customization for segments, region/country-level will be provided. Moreover, additional customization can be done based on the requirements. |
| Purchase Options | We have three licenses to opt for: Single User License, Multi-User License (Up to 5 Users), Corporate Use License (Unlimited User and Printable PDF) |
Sources
Market Statistics
- Wohlers Report 2026 – AM Revenues Reached USD 24.2 Billion in 2025; Services at 48% of Total Value; System Sales Rebounded 3.6%; AM Services Grew 15.5%; Asia-Pacific Revenue Growth Averaged 19.8%
- Wohlers Report 2024 – Metal AM System Shipments Reached 3,793 Units in 2023, Up 24.4% from 3,049 Units in 2022; Industry Reached USD 20.035 Billion in 2023 with 11.1% Growth
- Renishaw FY2024 Preliminary Results – Record Revenue of GBP 691.3 Million, 3.7% Underlying Growth; RenAM 500 Ultra Cuts Build Times by Up to 50%; Capital Expenditure Reached GBP 65.2 Million
- 3D Systems FY2024 Financial Results – Revenue USD 440.1 Million, Down 10%; Net Loss of USD 255.6 Million; Gross Profit Margin Declined to 37.3%
- Stratasys FY2024 Full Year Results – Total Revenue USD 572.5 Million, Down 8.8%; Systems Fell 25.3% to USD 140.3 Million; Adjusted EBITDA USD 26.0 Million
- PR Newswire – VulcanForms Raises USD 220 Million Series D to Scale Integrated Digital Metal Manufacturing (February 2026)
- Machina Labs – Closes USD 124 Million Series C to Build 200,000 Sq Ft Intelligent Factory with 50 Robotic Cells for Defense and Aerospace (February 2026)
Recent Developments
- GlobeNewswire – Nano Dimension Completes Desktop Metal Acquisition for USD 179.3 Million at USD 5.295 Per Share (April 2025)
- GlobeNewswire – Nano Dimension Closes Markforged Acquisition for USD 116 Million, Gaining Access to 15,000+ Deployed Systems (April 25, 2025)
- Nano Dimension Investor Relations – Delaware Court Rules Nano Dimension Must Complete Desktop Metal Acquisition (March 24, 2025)
- GlobeNewswire – Nano Dimension Announces Markforged Acquisition at USD 5.00 Per Share, a 71.8% Premium (September 2024)
- GlobeNewswire – Nano Dimension Announces Desktop Metal Acquisition for USD 183 Million at 27.3% Premium (July 2024)
- Stratasys Investor Relations – Fortissimo Capital Invests USD 120 Million at 10.6% Premium (February 2025)