What Is the Industrial 3D Printing Market Size?
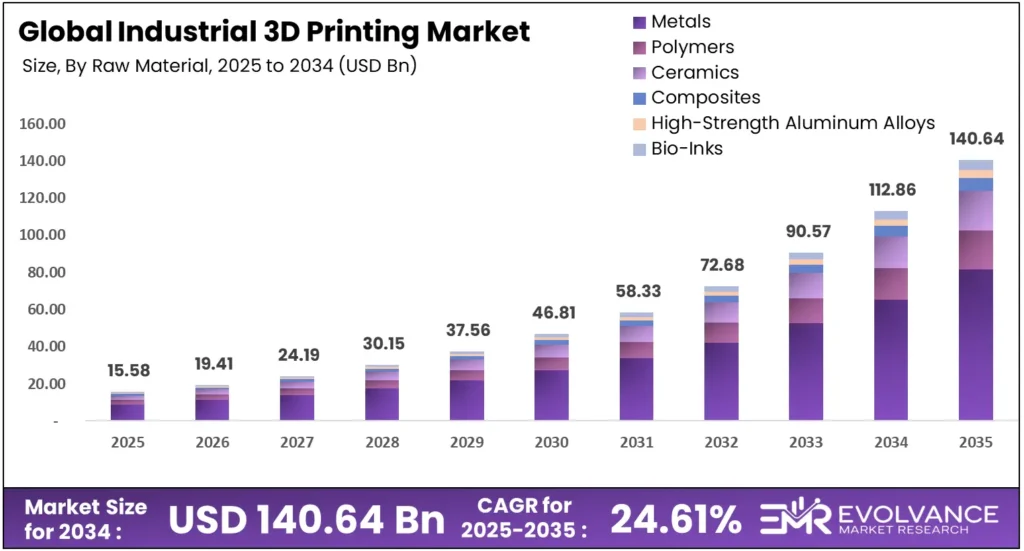
The global industrial 3D printing market will reach USD 140.64 billion by 2035 from USD 15.58 billion in 2025, growing at a CAGR of 24.61% during the forecast period 2026 to 2035. Hardware systems, metal powder bed fusion, and aerospace-grade functional parts lead demand across the forecast period. According to Stratasys investor reports, a USD 120 million strategic investment from Fortissimo Capital in February 2024 signals growing institutional conviction in the sector’s production-grade transition.
Market Highlights
- The industrial 3D printing market was valued at USD 15.58 billion in 2025 and will reach USD 140.64 billion by 2035, growing at a CAGR of 24.61%.
- Hardware leads the component segment with a 68.2% share, driven by capital investment in industrial-grade printer systems across aerospace and automotive manufacturers.
- Stereolithography (SLA) holds the largest technology segment share at 32.6%, anchored by high-precision resin output for tooling and functional prototypes.
- Metals account for 53.8% of material demand, reflecting the shift from polymer prototyping to end-use metal part production in aerospace and defense.
- Prototyping represents 55.7% of application revenue — yet functional parts and serial production are the fastest-growing application segments through 2035.
- North America holds the leading regional position, with the United States market alone valued at USD 1.62 billion in 2025.
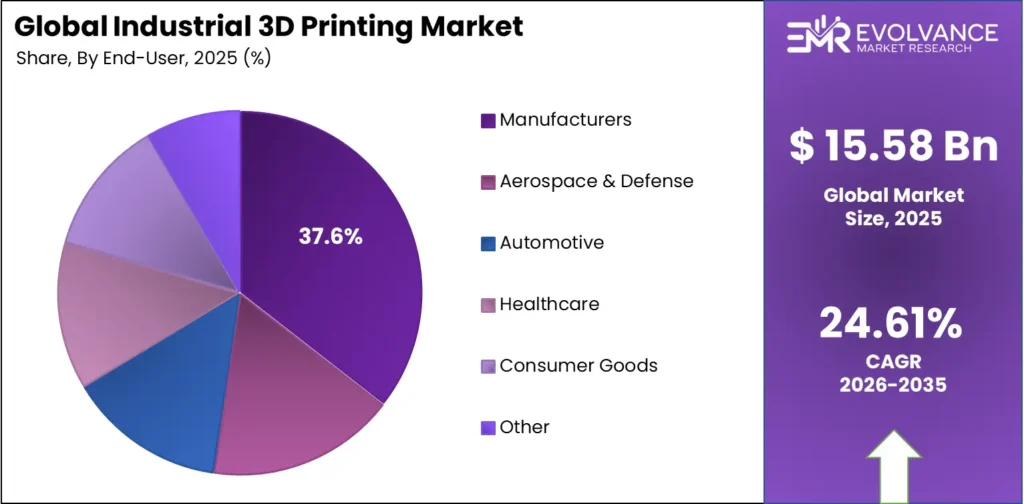
- Manufacturers represent 37.6% of end-user demand, with aerospace and defense, automotive, and healthcare driving the highest-value production applications.
Market Overview
Industrial 3D printing — also called additive manufacturing — builds physical components layer by layer from digital files. The industrial 3D printing market serves aerospace, automotive, healthcare, and defense manufacturers that need complex geometries, short production runs, or on-demand parts without traditional tooling, covering hardware, software, materials, and services.
This analysis draws on Wohlers Associates annual data, ISO TC 261 standards activity, and company financial disclosures. Evolvance Market Research analysts found consistent production-grade demand signals across 5 regional markets and 8 segmentation dimensions — combining financial verification with analyst validation to produce a forecast grounded in original synthesis, not aggregated public sources.
The core problem this market solves is manufacturing complexity at speed — traditional methods cannot produce internal lattice structures, consolidated assemblies, or patient-specific geometries that high-value buyers now require. Procurement teams spanning engineering, supply chain, and finance evaluate total cost of ownership, not sticker price alone.
This shift is visible in company financials. According to Stratasys’ Q3 2025 earnings, adjusted EBITDA reached USD 19.3 million year-to-date, up from USD 11.5 million prior year. 3D Systems reversed a USD 221.9 million net loss to record USD 49.4 million net income through September 2025 — a sector-wide signal on production adoption.
Industrial 3D Printing Market Segmentation Analysis
The technology and end-use segmentation dimensions carry the highest strategic significance for investors and market entrants — hardware dominance sets the capital intensity of the market, while end-use vertical mix determines whether demand is driven by prototyping budgets or production-grade procurement cycles.
Hardware Leads with 68.2% Share by Component
| Sub-segment | Share % | Primary Driver |
|---|---|---|
| Hardware | 68.2% | Capital investment in industrial printer systems |
| Software | — | AI-driven design and slicing platform growth |
| Services | — | Recurring OpEx via service bureaus and maintenance |
| AI-Powered Print Assistants | — | Emerging toolpath optimization and quality control |
Hardware dominates with 68.2% share, reflecting the capital-intensive nature of industrial printer procurement across aerospace, automotive, and defense manufacturers.
In 2025, hardware held a dominant position in the By Component breakdown, driven by high unit values of industrial-grade metal and polymer systems. Stratasys Ltd. recorded USD 391.9 million in product revenue in FY2024 alone — confirming that CapEx-driven hardware purchasing remains the primary revenue engine for platform vendors.
The industrial 3D printing software segment is the fastest-growing component by CAGR, as AI-driven slicing and topology optimization platforms reduce print failure rates and shorten design-to-production cycles. Materialise NV anchors the software layer with its Magics platform embedded across EOS and HP environments — making software a high-margin recurring revenue stream.
SLA Leads 9 Industrial 3D Printing Technology Types at 32.6%
| Sub-segment | Share % | Primary Driver |
|---|---|---|
| Stereolithography (SLA) | 32.6% | High-precision resin output for tooling and prototypes |
| Fused Deposition Modeling (FDM) | — | Low-cost polymer extrusion for functional parts |
| Selective Laser Sintering (SLS) | — | Support-free powder bed for complex geometries |
| Direct Metal Laser Sintering (DMLS) | — | Aerospace-grade metal component production |
| Binder Jetting | — | High-volume metal part output at lower energy cost |
| Direct Energy Deposition (DED) | — | Repair and large-format metal deposition |
| PolyJet | — | Multi-material and color prototyping accuracy |
| Pellet-Based Extrusion | — | Large-format low-cost industrial polymer output |
| Multi-Laser Systems | — | Throughput scaling for serial metal production |
Industrial 3D printing stereolithography leads the technology segment with 32.6% share, anchored by its precision output across dental, medical, and tooling applications.
In 2025, SLA held the dominant technology position, favored for smooth-surface, high-accuracy output without layer artifacts that limit powder bed fusion in fine-feature applications. Formlabs and 3D Systems Inc. lead this segment, with healthcare and dental buyers driving the highest repeat purchase rates.
Industrial 3D printing FDM and HP Multi Jet Fusion technology anchor the mid-market polymer production layer, offering the lowest per-part cost for functional parts and jigs at production volumes. Industrial 3D printing SLS holds the strongest position in support-free complex geometry output — critical for aerospace brackets and medical device housings where internal channels make traditional tooling impossible.
Metals Hold 53.8% Share in the Materials Segment
| Sub-segment | Share % | Primary Driver |
|---|---|---|
| Metals | 53.8% | Aerospace and defense functional part production |
| Polymers | — | Prototyping volume and consumer electronics tooling |
| Ceramics | — | High-temperature industrial and medical applications |
| Composites | — | Lightweight structural aerospace components |
| High-Strength Aluminum Alloys | — | EV lightweighting and aerospace bracket production |
| Bio-Inks | — | Bioprinting and patient-specific tissue scaffolds |
The industrial 3D printing metal segment dominates at 53.8% share, reflecting the market’s structural shift from polymer prototyping to end-use metal component production.
In 2025, metal powder demand concentrated in titanium, Inconel, and high-strength aluminum alloys — materials where additive manufacturing reduces buy-to-fly ratios versus traditional casting. EOS GmbH and GE Additive anchor metal powder bed fusion, while HP Inc. and ArcelorMittal advance sustainable steel AM through direct partnership.
Polymers remain the highest-volume material by unit count, supporting prototyping and tooling at lower per-kilogram cost than metals. Composites and high-strength aluminum alloys are gaining traction in EV lightweighting programs, where part consolidation economics — reducing assembly count from dozens of components to single printed structures — justify the premium over standard polymer extrusion.
Manufacturers Leads Industrial 3D Printing End-Users
| Sub-segment | Share % | Primary Driver |
|---|---|---|
| Manufacturers | 37.6% | On-demand tooling, jigs, and functional part production |
| Aerospace & Defense | — | Complex engine components and supply chain compression |
| Automotive | — | EV lightweighting and rapid tooling for new platforms |
| Healthcare | — | Patient-specific implants and surgical guide production |
| Consumer Goods | — | Customization at scale and short-run product launches |
| Humanoid Robotics | — | Complex joint and structural component fabrication |
| Low-Altitude Economy (Drones) | — | Rapid iteration on airframe and propulsion components |
Manufacturers hold 37.6% end-user share, anchoring demand across industrial tooling, jigs, fixtures, and functional part production.
In 2025, manufacturers dominate because additive manufacturing solves their core problem: low-volume, high-mix parts that traditional machining cannot justify economically. GE Additive’s multi-year agreement with a US aerospace supplier for engine component production confirms that industrial 3D printing aerospace and defense applications are shifting from prototype validation to contracted serial supply.
Industrial 3D printing healthcare demand centers on 3D printing patient-specific implants, surgical guides, and dental aligners. Materialise NV’s Medical segment grew 15.4% in FY2025 — the fastest revenue growth rate across any single end-user vertical tracked. Industrial 3D printing automotive applications focus on EV lightweighting and rapid tooling, cutting prototype lead times from weeks to days.
Prototyping Accounts for 55.7% of Application Revenue
| Sub-segment | Share % | Primary Driver |
|---|---|---|
| Prototyping | 55.7% | Design validation speed advantage over traditional tooling |
| Functional Parts | — | End-use aerospace, medical, and industrial components |
| Tooling | — | Low-volume jigs, fixtures, and molds at lower cost |
| Mass Production / Serial Production | — | Contracted repeat orders replacing traditional supply |
The industrial 3D printing prototyping segment dominates at 55.7% share, reflecting the market’s historical foundation in design validation — though functional parts and serial production represent the highest-growth applications through 2035.
In 2025, the prototyping segment dominates because most adopters entered the market for design iteration speed — compressing development cycles from months to days. This installed base is now converting to production applications. Stratasys Ltd. services revenue of USD 180.5 million in FY2024 confirms that prototyping users generate recurring production-phase spend.
Industrial 3D printing functional parts and serial production are the fastest-growing application sub-segments, driven by aerospace contracted supply, medical device serial runs, and Apple’s 2024 adoption of additive manufacturing for titanium consumer electronics chassis — a mass-market signal that production-grade 3D printing has crossed from aerospace-only into mainstream industrial supply chains.
Service Bureaus Lead the Business Model Segment
Service Bureaus lead the Business Model segment, operating as the primary access point for manufacturers without in-house additive systems — enabling on-demand manufacturing 3D printing without upfront capital commitment.
| Sub-segment | Dominant | Primary Driver |
|---|---|---|
| Service Bureaus | Yes | On-demand access without CapEx commitment |
| Cloud-Based Digital Inventories | No | Virtual stock replacing physical warehouse inventory |
| On-Demand Localized Production | No | Distributed manufacturing near point of use |
| Subscription-Based Hardware | No | OpEx model reducing hardware access barrier |
Low-Cost Systems Dominate by System Tier
Low-Cost Upstart Systems lead the System Tier segment, driven by Bambu Lab and similar entrants lowering the hardware access threshold for SMEs and first-time industrial adopters.
| Sub-segment | Dominant | Primary Driver |
|---|---|---|
| Low-Cost Upstart Systems | Yes | SME adoption and first-time industrial market entry |
| Professional / Prosumer Systems | No | Mid-market design studios and engineering firms |
| Industrial-Grade Systems | No | High-throughput aerospace and defense production |
Hybrid AM and CNC Leads Manufacturing Integration
Hybrid Manufacturing (AM + CNC) leads the Manufacturing Integration segment within 3D printing Industry 4.0 factory environments, combining additive deposition with subtractive finishing to meet aerospace surface tolerance requirements that pure additive processes cannot achieve alone.
| Sub-segment | Dominant | Primary Driver |
|---|---|---|
| Hybrid Manufacturing (AM + CNC) | Yes | Surface finish compliance for aerospace tolerances |
| In-Situ Automated Toolpath Generation | No | AI-driven real-time print path optimization |
| IT-OT Converged Factories | No | Smart factory integration across AM production lines |
Market Segments Covered in the Report
By Component
- Hardware
- Software
- Services
- AI-Powered Print Assistants
By Technology / Process
- Stereolithography (SLA)
- Fused Deposition Modeling (FDM)
- Selective Laser Sintering (SLS)
- Direct Metal Laser Sintering (DMLS)
- Binder Jetting
- Direct Energy Deposition (DED)
- PolyJet
- Pellet-Based Extrusion
- Multi-Laser Systems
By Raw Material
- Metals
- Polymers
- Ceramics
- Composites
- High-Strength Aluminum Alloys
- Bio-Inks
By End-User / Industry Vertical
- Manufacturers
- Aerospace & Defense
- Automotive
- Healthcare
- Consumer Goods
- Humanoid Robotics
- Low-Altitude Economy (Drones)
By Application
- Prototyping
- Functional Parts
- Tooling
- Mass Production / Serial Production
By Business Model
- Service Bureaus
- Cloud-Based Digital Inventories
- On-Demand Localized Production
- Subscription-Based Hardware
By System Tier
- Low-Cost Upstart Systems
- Professional / Prosumer Systems
- Industrial-Grade Systems
By Manufacturing Integration
- Hybrid Manufacturing (AM + CNC)
- In-Situ Automated Toolpath Generation
- IT-OT Converged Factories
United States Industrial 3D Printing Market
The United States industrial 3D printing market was valued at USD 1.62 billion in 2025 and will reach USD 9.32 billion by 2035, at a CAGR of 19.12%. The AM Forward initiative and state-level grants confirm that government policy is actively accelerating domestic additive manufacturing adoption. GKN Aerospace’s USD 2.5 million Connecticut award is one direct example.
Demand signals from major vendors reinforce this outlook. According to 3D Systems’ Q3 2025 filing, US revenue reached USD 157.4 million through September 2025 — down from USD 190.8 million prior year, reflecting CapEx softness rather than structural demand decline. Aerospace and medical verticals continue driving the highest per-order values in the US market.
Industrial 3D Printing Market Regional Insights
North America Leads with the Largest Market Share
North America holds the leading regional position in the industrial 3D printing market, anchored by the United States as the largest single-country market at USD 1.62 billion in 2025. Government-backed programs — including the AM Forward initiative and state-level aerospace grants — provide structural policy support. No other region replicates this at an equivalent scale.
Europe Industrial 3D Printing Market Trends
Europe’s industrial 3D printing market draws on Horizon Europe R&D funding and strong aerospace and automotive OEM demand across Germany, the UK, and France. According to Renishaw’s FY2025 annual report, total revenue reached £713.0 million, up 3.1% — though additive manufacturing system demand remained weaker, flagging a hardware procurement lag behind broader manufacturing recovery. The Germany 3D printing market and UK both represent priority European country opportunities for production-grade AM vendors.
Asia Pacific Industrial 3D Printing Market Trends
Asia Pacific is the fastest-growing region, anchored by China’s manufacturing scale. According to Fabbaloo’s 2025 production data, China produced 5.03 million units in 2025, up 33% from 3.8 million in 2024, with exports reaching USD 1.6 billion — up 39% year-over-year. The US absorbed 2.0 million units as the largest buyer.
Rest of World Industrial 3D Printing Market Trends
Latin America and the Middle East represent early-stage growth markets with expanding policy frameworks. Saudi Arabia’s Vision 2030 manufacturing diversification program and UAE investments in advanced industrial capacity are building the procurement base for industrial additive manufacturing adoption. Brazil leads Latin America’s AM activity, driven by aerospace and oil and gas maintenance applications.
Key Regions and Countries
North America
- US
- Canada
Europe
- Germany
- France
- The UK
- Spain
- Italy
- Rest of Europe
Asia Pacific
- China
- Japan
- South Korea
- India
- Australia
- Rest of APAC
Latin America
- Brazil
- Mexico
- Rest of Latin America
Middle East & Africa
- GCC
- South Africa
- Rest of MEA
Related Additive Manufacturing Markets
Industrial 3D printing sits at the center of a broader additive manufacturing ecosystem — with metal AM, healthcare bioprinting, and on-demand services each representing distinct sub-markets that share technology platforms, material suppliers, and industrial end-users. Buyers evaluating entry or investment in the industrial segment should track these adjacent markets for cross-sector demand signals and technology transfer opportunities.
Key Related Markets
- Metal Additive Manufacturing Market Valued at USD 17.24 billion in 2025 and projected to reach USD 145.46 billion by 2035 at a CAGR of 23.8%, this independently scoped market covers laser powder bed fusion, directed energy deposition, and metal binder jetting across aerospace, automotive, and energy end-users.
- Advanced and Intelligent Manufacturing Market — The broader smart manufacturing ecosystem within which industrial 3D printing operates, spanning AI-driven production systems, hybrid manufacturing, and IT-OT converged factory environments across aerospace, automotive, and defense verticals.
Regulatory Landscape
ISO/ASTM 52900, maintained jointly by ISO TC 261 and ASTM F42, establishes the global terminology and process classification framework for additive manufacturing. This standard governs how industrial processes are defined across procurement contracts, quality systems, and regulatory submissions — making compliance non-negotiable for aerospace and medical vendors supplying certified end-use parts.
The FAA’s airworthiness certification process and EASA’s Part 21 approval framework require additive manufacturing suppliers to demonstrate material traceability, process repeatability, and post-process inspection data before flight-critical parts receive approval. Qualification timelines of 18 to 36 months per part family represent the largest adoption barrier for aerospace buyers evaluating production-grade AM systems.
The European Union’s Additive Manufacturing Action Plan, aligned with the European Green Deal, requires industrial AM vendors to document life cycle emissions, material waste rates, and energy consumption per kilogram of deposited material. Vendors without verified sustainability data risk exclusion from EU public procurement contracts — a compliance cost that hits smaller service bureaus hardest.
Drivers
Government Grants and OEM Deals Drive Aerospace AM Adoption
Government grant programs are converting industrial 3D printing from a discretionary R&D spend into a funded supply chain priority. GKN Aerospace secured USD 2.5 million in state funding through Connecticut’s supply chain initiative to build domestic additive manufacturing capacity — confirming that public capital is actively subsidizing the CapEx barrier that slows private adoption.
In our view, OEM multi-year supply agreements are the most durable demand signal in the industrial 3D printing market — more reliable than spot hardware purchases. GE Additive’s multi-year contract with a US aerospace supplier confirms that contracted serial AM supply is replacing prototype orders. This shift is the primary revenue model change for industrial vendors.
Beyond this, platform-level innovation is lowering the cost floor of industrial adoption. HP Inc. introduced cost-efficient materials, workflow tools, and expanded Metal Jet platforms at Formnext 2024 — reducing the per-part economics of metal AM to a threshold where mid-tier manufacturers can justify production investment without aerospace-scale procurement volumes.
Restraints
Post-Processing Costs and CapEx Pressure Slow Mainstream Adoption
Post-processing complexity — support removal, heat treatment, surface finishing, and inspection labor — adds 30 to 60 percent to total part production time after printing completes. This hidden cost sits outside the hardware and materials line items that procurement teams evaluate, meaning total cost of ownership routinely exceeds initial estimates and slows repeat purchase decisions.
Hardware CapEx pressure is compressing vendor margins across the sector. According to 3D Systems’ FY2024 results, non-GAAP gross margin fell to 37.4% from 40.6% in the prior year — a 3.2 percentage point compression driven by buyers deferring hardware CapEx. Vendors without strong services revenue cannot absorb this margin pressure during procurement slowdowns.
Service bureau demand moderation adds a second constraint. According to Materialise’s FY2025 results, Manufacturing segment revenue fell 13.2% to 92,486 kEUR — even as total company revenue held stable through medical growth. This split confirms that general industrial service bureau demand is softening while high-regulation verticals maintain momentum.
Growth Factors
Materials Investment and Partnerships Open New AM Markets
Private capital flowing into advanced materials is expanding the industrial 3D printing addressable market beyond established metal and polymer categories. Alloyed secured £37 million to expand additive manufacturing and digital alloy capabilities — directly broadening feedstock options for aerospace, energy, and defense buyers that require certified alloy performance in printed end-use components.
Mass-market consumer electronics adoption is creating a new production-scale demand signal. Apple’s decision to 3D print a titanium chassis demonstrates that additive manufacturing can meet the volume, precision, and material consistency requirements of high-throughput consumer supply chains — validating production-grade AM for any manufacturer facing similar lightweighting and geometry complexity demands.
Critically, cross-industry material partnerships are building the supply chain systems that serial production requires. HP Inc. and ArcelorMittal are advancing sustainable steel additive manufacturing — combining Metal Jet platform capability with industrial steel feedstock development to serve a material category that traditional metal AM has not reached at production cost levels.
Emerging Trends
Generative AI and Large-Format AM Reshape 3D Printing Workflows
Generative design 3D printing and AI-powered 3D printing tools are compressing the design-to-print cycle. They automate toolpath generation, defect prediction, and topology optimization — tasks that previously required specialist engineers. Platforms like Aibuild 2.0 cut print preparation time by up to 25%, making AI workflow automation the fastest-adoption technology layer across industrial AM in 2025. This convergence of AI and simulation directly accelerates adoption of the Digital Twin in Manufacturing Market, enabling virtual print process validation before physical execution..
Academic institutions are scaling additive manufacturing systems, building the talent pipeline that commercial adoption requires. NITTE University’s collaboration with Wipro3D and the IIT Madras Fab Lab launch establish dedicated AM centers that train engineers on production-grade systems — building a regional skills base that supports domestic industrial adoption across South Asia.
What this signals is that multi-material 3D printing and large-format metal AM are moving from research into funded commercial programs. Caracol AM raised €10 million from CDP Venture Capital in April 2024 to scale large-format additive manufacturing systems — confirming that institutional investors are funding next-generation AM systems ahead of mainstream demand.
Industrial 3D Printing Market Key Companies Insights
Stratasys Ltd. — Revenue USD 572.5M in FY2024
Our forecast suggests that Stratasys Ltd. will maintain market leadership through recurring services revenue despite hardware CapEx headwinds. According to Stratasys’ FY2024 press release, total revenue reached USD 572.5 million. Services contributed USD 180.5 million — confirming that OpEx-driven usage sustains revenue through hardware softness.
EOS GmbH — 5,000 Industrial Systems Installed by January 2025
EOS GmbH has built the largest verified installed base of industrial powder bed fusion systems globally. According to EOS’s January 2025 press release, its installed base reached 5,000 units — with the milestone system, an M 400-4 multi-laser metal printer, installed at a North American customer running 18 EOS systems on one site. EOS GmbH additive manufacturing spans polymer and metal powder bed fusion across six continents, giving it the broadest geographic production coverage of any single-vendor installed base in the sector.
Materialise NV — Medical Revenue Up 15.4% in FY2025
Materialise NV holds total revenue stable at 267,633 kEUR in FY2025 despite a 13.2% Manufacturing segment decline — through vertical specialization in medical applications. Materialise’s FY2025 annual results show Medical segment revenue grew 15.4% to 134,239 kEUR, confirming healthcare as its highest-margin growth engine. Its expanded collaboration with HP Inc. in polymer printing accelerates this healthcare-led trajectory.
3D Systems Inc. — Industrial and Healthcare Revenue USD 440M
3D Systems Inc. operates across industrial and healthcare verticals with a broad polymer and metal platform portfolio. FY2024 total revenue reached USD 440.1 million, down 10% year-on-year — with Industrial Solutions contributing USD 250.4 million and Healthcare Solutions USD 189.7 million, confirming balanced exposure across the two highest-value AM verticals.
Key Companies
- Stratasys Ltd.
- 3D Systems Inc.
- Xometry
- Protolabs
- Farsoon Technologies
- Materialise NV
- EOS GmbH
- GE Additive
- HP Inc.
- Bambu Lab
- Nano Dimension Ltd.
- Desktop Metal
- Renishaw plc
- Markforged
- Carbon Inc.
- SLM Solutions (Nikon)
- TRUMPF
- Voxeljet AG
- Formlabs
- Ultimaker
- Prodways Group
Recent Development
- 2025 — Stratasys Ltd. guided full year 2025 revenue to USD 550–560 million, with adjusted EBITDA of USD 30–32 million and non-GAAP gross margins of 46.7%–47.0% — signaling management confidence in margin recovery despite sustained hardware volume pressure.
- 2025 — 3D Systems Inc. guided full year 2025 revenue to USD 420–435 million, with sequential Q4 growth of 8%–10% anticipated — the first explicit growth signal from 3D Systems after two consecutive years of revenue decline.
- May 2024 — Renishaw plc expanded its additive manufacturing facility in Gloucestershire, UK, to increase metal 3D printing capacity — reinforcing Europe’s position as the primary geography for industrial-grade metal AM hardware production.
- May 2024 — 3D Systems Corporation launched the EXT Titan Pellet 1070 pellet-based extrusion printer to support large-scale industrial polymer applications — extending its platform reach into large-format manufacturing segments previously served only by specialized vendors.
- March 2024 — EOS GmbH launched the EOS M 290-2 dual-laser metal 3D printer, designed to increase productivity and part quality for industrial metal powder bed fusion applications — adding throughput capacity to its core metal platform ahead of forecast production demand growth.
- January 2024 — Nano Dimension Ltd. completed its acquisition of Desktop Metal for approximately USD 300 million — the largest consolidation event in the industrial 3D printing sector during the 2024–2025 period, signaling accelerating market concentration among platform vendors.
Market Scope
| Report Features | Description |
|---|---|
| Market Value (2025) | USD 15.58 Billion |
| Forecast Revenue (2035) | USD 140.64 Billion |
| CAGR (2026–2035) | 24.61% |
| Base Year for Estimation | 2025 |
| Historic Period | 2020–2024 |
| Forecast Period | 2026–2035 |
| Report Coverage | Revenue Forecast, Market Dynamics, Competitive Landscape, Recent Developments |
| Segments Covered | By Component (Hardware, Software, Services, AI-Powered Print Assistants), By Technology (Stereolithography/SLA, Fused Deposition Modeling/FDM, Selective Laser Sintering/SLS, Direct Metal Laser Sintering/DMLS, Binder Jetting, Direct Energy Deposition/DED, PolyJet, Pellet-Based Extrusion, Multi-Laser Systems), By Raw Material (Metals, Polymers, Ceramics, Composites, High-Strength Aluminum Alloys, Bio-Inks), By End-User (Manufacturers, Aerospace & Defense, Automotive, Healthcare, Consumer Goods, Humanoid Robotics, Low-Altitude Economy/Drones), By Application (Prototyping, Functional Parts, Tooling, Mass Production/Serial Production), By Business Model (Service Bureaus, Cloud-Based Digital Inventories, On-Demand Localized Production, Subscription-Based Hardware), By System Tier (Low-Cost Upstart Systems, Professional/Prosumer Systems, Industrial-Grade Systems), By Manufacturing Integration (Hybrid Manufacturing/AM+CNC, In-Situ Automated Toolpath Generation, IT-OT Converged Factories) |
| Regional Analysis | North America (US and Canada), Europe (Germany, France, The UK, Spain, Italy, and Rest of Europe), Asia Pacific (China, Japan, South Korea, India, Australia, and Rest of APAC), Latin America (Brazil, Mexico, and Rest of Latin America), Middle East & Africa (GCC, South Africa, and Rest of MEA) |
| Competitive Landscape | Stratasys Ltd., 3D Systems Inc., Xometry, Protolabs, Farsoon Technologies, Materialise NV, EOS GmbH, GE Additive, HP Inc., Bambu Lab, Nano Dimension Ltd., Desktop Metal, Renishaw plc, Markforged, Carbon Inc., SLM Solutions (Nikon), TRUMPF, Voxeljet AG, Formlabs, Ultimaker, Prodways Group |
| Customization Scope | Customization for segments, region/country-level will be provided. Moreover, additional customization can be done based on the requirements. |
| Purchase Options | We have three licenses to opt for: Single User License, Multi-User License (Up to 5 Users), Corporate Use License (Unlimited User and Printable PDF) |