What is the High Performance Materials and Chemicals Market Size?
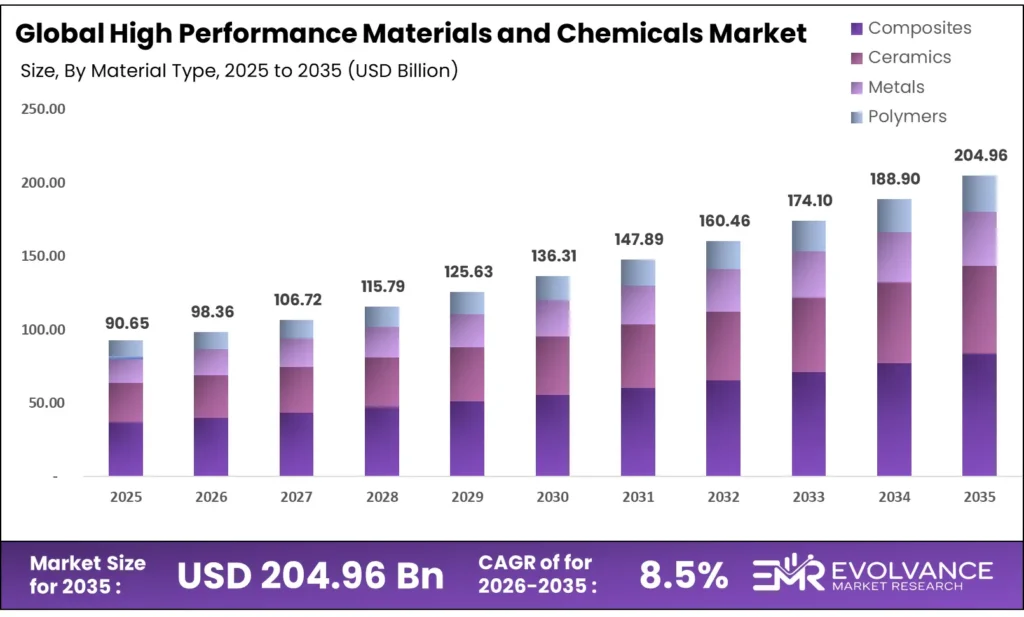
The Global High Performance Materials and Chemicals Market size will be worth around USD 204.96 Billion by 2035 from USD 90.65 Billion in 2025, growing at a CAGR of 8.5% during the forecast period 2026 to 2035. This acceleration reflects capital moving from Sustainable industrial chemicals toward specialized materials that enable AI infrastructure and Renewable energy systems. Procurement teams now prioritize supply chain security and verified sustainability credentials over short-term cost savings. Supply-side pressure is building as European producers face energy costs that outpace global competitors, triggering capacity rationalization in basic chemicals.
Market Highlights
- The Global High Performance Materials and Chemicals Market valued at USD 90.65 Billion in 2025, projected to reach USD 204.96 Billion by 2035 at a CAGR of 8.5%.
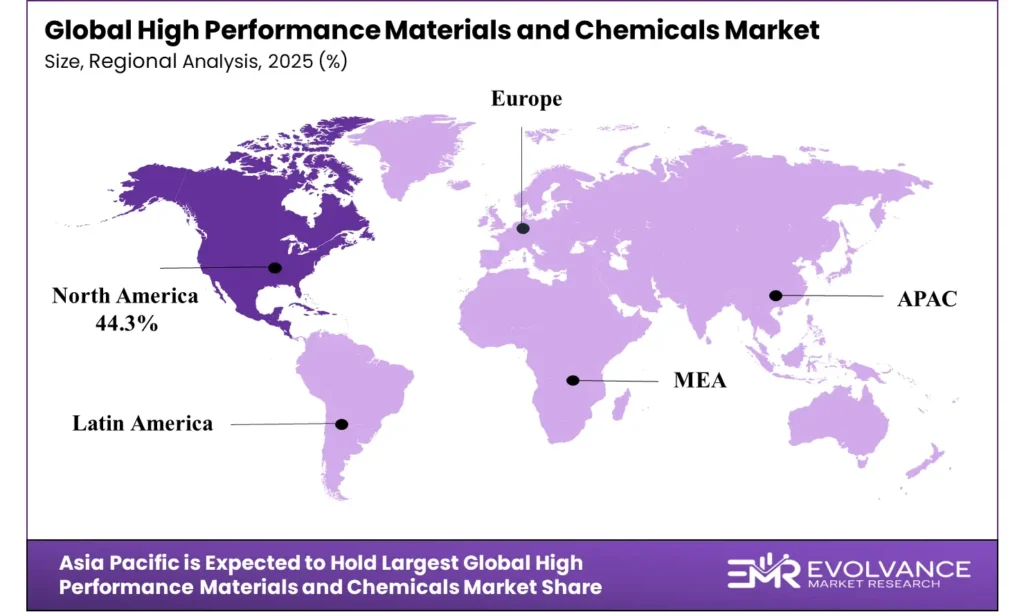
- North America leads all regions with a 44.3% share, valued at USD 40.15 Billion.
- Films dominates the Product Type segment with a 67.2% share.
- Composites leads the Material Type segment with a 43.5% share.
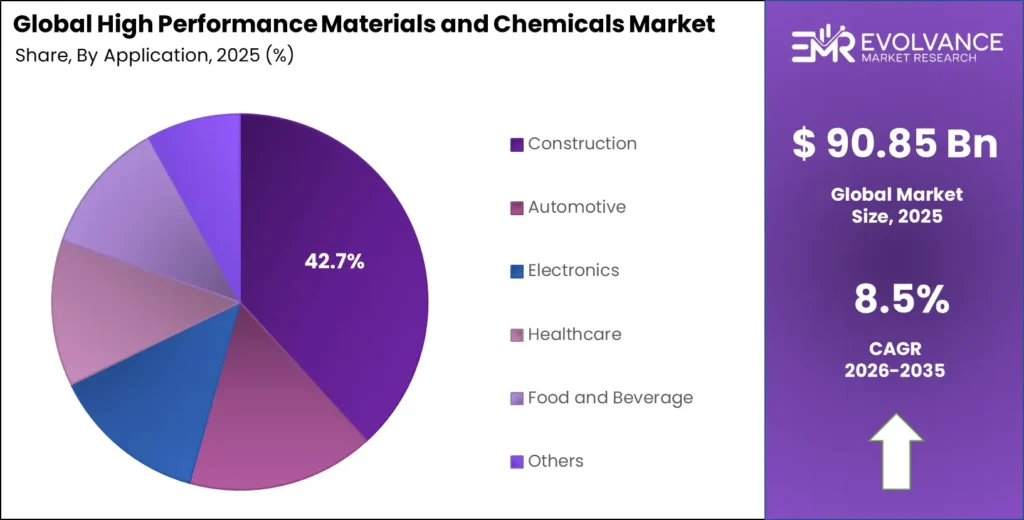
- Construction holds the largest Application Type segment share at 42.7%.
Market Overview
High performance materials and chemicals are engineered substances designed for use in extreme conditions or critical applications. These include smart polymers, specialty coatings, composites, and electronic chemicals that enable semiconductor manufacturing and aerospace components. End-users choose these materials not just for performance but for the long-term reliability they provide in complex systems like data centers and nuclear reactors.
This market sits at the intersection of advanced manufacturing and sustainability. Buyers in electronics, automotive, and healthcare sectors now require materials that meet both technical specifications and environmental standards. The shift is not incremental. Companies are redesigning products to use materials that lower global warming potential while maintaining or improving output.
Data published by the US Census Bureau shows shifting trade flows that signal realignment. US exports of advanced materials to Australia more than doubled to $122 million in 2025 from $61 million in 2024, while exports to China fell to $327 million from $466 million. This pattern indicates supply chains, creating new logistics corridors and pricing structures for specialty materials.
Findings from the European Chemical Industry Council (Cefic) reveal European chemical production volume dropped 2.4% in 2025 and remains 11% below the 2014-2019 average. Yet specialty chemicals exports hit 617 billion euros in the first 10 months of 2025. The implication is clear: European producers are losing ground in commodity chemicals but retaining strength in high-value specialties where performance and regulation create durable pricing power.
Government policy is now a primary demand lever. The CHIPS Act and Inflation Reduction Act in the US have funneled capital into domestic semiconductor and clean energy production. This policy shift forces material suppliers to build local capacity quickly. According to the Federal Reserve, US chemical industry value added totaled $478.3 billion, with pharmaceutical manufacturing alone contributing $173 billion, showing where high-value demand is concentrated.
Product Type Insights
Films dominates with 67.2% due to semiconductor packaging needs.
In 2025, Films held a dominant market position in the By Product Type segment of High Performance Materials and Chemicals Market, with a 67.2% share. The demand comes from electronics manufacturers who require specialized films for chip packaging and thermal management. As AI chips generate more heat, the need for high-performance polymer films with precise thickness and conductivity has outpaced other product forms.
Coatings serve as the functional layer that protects surfaces in automotive, aerospace, and industrial equipment. Buyers are moving toward coatings that offer corrosion resistance without the environmental trade-offs of older chemistries. This shift is driven by regulations that ban high-VOC products, forcing reformulation across the supply chain.
Other product types including adhesives, sealants, and specialty gases fill critical gaps in assembly and testing processes. While smaller in share, these materials often have higher margins because they are tailored to specific manufacturing lines. Suppliers in this category gain leverage by providing integrated solutions rather than standalone products.
Material Type Insights
Composites dominates with 43.5% due to lightweighting in transport.
In 2025, Composites held a dominant market position in the By Material Type segment of High Performance Materials and Chemicals Market, with a 43.5% share. Aerospace and automotive OEMs use composites to reduce weight while maintaining structural strength. The trend toward electric vehicles amplifies this because every kilogram saved extends battery range, directly affecting consumer purchase decisions.
Ceramics are critical for high-temperature applications in semiconductor fabrication and energy systems. Their ability to withstand extreme environments without degrading makes them non-negotiable in furnaces and reactors. Suppliers that can produce ceramics with consistent purity at scale capture premium pricing.
Metals in this market are not commodity grades but specialized alloys for aerospace fasteners, medical implants, and electronic connectors. China’s non-ferrous metal industry output increased 2.9% to 40.32 million tons in early 2025, while value added grew 7.6%. This gap between volume and value growth shows the move to higher-grade materials.
Polymers cover a wide range from engineering plastics to high-temperature thermoplastics. The growth here ties directly to the shift toward LGWP refrigerants and sustainable cooling. Manufacturers are reformulating polymers to work with new refrigerants, creating a one-time replacement cycle that benefits established producers.
Application Type Insights
Construction dominates with 42.7% due to infrastructure modernization.
In 2025, Construction held a dominant market position in the By Application Type segment of High Performance Materials and Chemicals Market, with a 42.7% share. This share reflects the use of high-performance coatings, sealants, and structural composites in commercial and industrial building projects. Government infrastructure programs in North America and Asia have accelerated specifications that require longer-lasting materials.
Automotive applications focus on lightweight composites, battery components, and electronic materials. With EV adoption, automakers now compete on range and charging speed. Materials that improve thermal management in battery packs or reduce weight in body panels directly impact vehicle specs. Suppliers that can certify materials for automotive safety standards secure multi-year contracts.
Electronics is the fastest-moving application in terms of material innovation. The proliferation of AI data centers and high-speed computing requires specialized materials for thermal management and semiconductor manufacturing. The US exports of advanced materials to the European Union totaled $733 million in 2025, with imports from the EU reaching $883 million. This transatlantic flow centers on electronics-grade materials.
Healthcare applications demand materials that are biocompatible, sterilizable, and traceable. Medical device manufacturers use high-performance polymers and specialty chemicals in implants, diagnostic equipment, and drug delivery systems. The regulatory barrier to entry is high, but approved suppliers gain long-term revenue streams with limited price pressure.
Food and Beverage applications use coatings and films that meet FDA and EU food contact standards. These materials must resist cleaning chemicals, maintain barrier properties, and not leach into products. The shift toward recyclable packaging is forcing reformulation, creating opportunities for materials that combine barrier performance with circular economy credentials.
Market Segments Covered in the Report
By Product Type
- Films
- Coatings
- Other
By Material Type
- Composites
- Ceramics
- Metals
- Polymers
By Application Type
- Construction
- Automotive
- Electronics
- Healthcare
- Food and Beverage
- Others
Regional Insights
North America holds 44.3% of the global market, valued at USD 40.15 Billion in 2025. This lead is not simply a product of market size — it reflects early policy action through the CHIPS Act and Inflation Reduction Act, which are channeling hundreds of billions into semiconductor and clean energy facilities that require specialty materials. U.S. paint, coating, and adhesive manufacturing alone added USD 24 Billion in value in 2022, according to the Federal Reserve Board, showing the depth of the domestic production base.
Europe Market Trends
Europe faces structural headwinds that are reshaping its role in global specialty materials supply. European chemical production fell 2.4% in 2025, sitting 11% below the 2014-2019 average, according to the European Chemical Industry Council (Cefic). Netherlands, Germany, and France all posted declines of 4.9%, 3.3%, and 2.9% respectively. High energy costs are the primary mechanism — they make European production economically uncompetitive for energy-intensive materials, accelerating a shift toward specialty segments where energy is a smaller share of total cost.
Asia Pacific Market Trends
Asia Pacific is scaling production capacity at a pace that is outrunning global demand growth. China’s non-ferrous metal industry operating income rose 15.9% year-over-year from January to May 2025, while profits gained 16.9% in the same period. Over 95% of China’s copper, lead, and zinc smelting capacity uses green processes. However, U.S. exports of advanced materials to China fell to USD 327 Million in 2025 from USD 466 Million in 2024 — a 30% drop that reflects both trade policy tightening and China’s drive for self-sufficiency in high-specification materials.
Latin America Market Trends
Latin America is an emerging destination for advanced material supply chains, particularly as North American manufacturers seek to reduce reliance on Asian sources. Brazil and Mexico hold the most credible positions, given existing automotive manufacturing clusters and improving logistics infrastructure. U.S. export flows to Curacao — a regional logistics hub — rose to USD 186 Million in 2025 from USD 107 Million in 2024, a signal that trans-shipment volumes for specialty materials through Latin American routes are building.
Middle East and Africa Market Trends
The Middle East and Africa region is at an early but accelerating stage of specialty materials adoption. Gulf Cooperation Council nations are investing in petrochemical-to-specialty chemical transitions as part of economic diversification programs. These investments create downstream demand for high-performance coatings, composites, and specialty polymers used in new industrial and construction projects.
Key Regions and Countries
North America
- US
- Canada
Europe
- Germany
- France
- The UK
- Spain
- Italy
- Rest of Europe
Asia Pacific
- China
- Japan
- South Korea
- India
- Australia
- Rest of APAC
Latin America
- Brazil
- Mexico
- Rest of Latin America
Middle East & Africa
- GCC
- South Africa
- Rest of MEA
Regulatory Landscape
The regulatory environment for high performance materials centers on chemical safety, environmental impact, and trade compliance. In the US, the CHIPS Act (2022) and Inflation Reduction Act (2022) allocate tax credits and direct funding for domestic semiconductor and clean energy manufacturing. These laws create demand pull for materials used in those sectors.
In Europe, the European Chemical Industry Council (Cefic) reports that regulatory pressure is reshaping production. The EU’s Carbon Border Adjustment Mechanism (CBAM), phased in from 2023, adds cost to imports of chemicals based on their embedded emissions. This changes procurement calculus for buyers, favoring suppliers with lower-carbon production methods.
In China, regulations focus on industrial upgrading and environmental performance. The government reports that over 95% of copper, lead, and zinc smelting capacity uses green processes. Digital transformation mandates in the non-ferrous metal sector push producers to adopt advanced monitoring and control systems, creating demand for specialized materials and chemicals used in automated processes.
Drivers
AI and Advanced Computing Expansion Drives Demand for Electronic Materials
The build-out of AI infrastructure requires specialized materials for semiconductor manufacturing and thermal management. Data centers need high-performance films, coatings, and composites that can handle increased power density. Suppliers that can certify materials for advanced node fabrication capture premium pricing and multi-year contracts. This demand is not cyclical; it is tied to a secular shift in computing architecture.
Exports of advanced materials to the European Union totaled $733 million in 2025, with imports from the EU reaching $883 million. This two-way flow centers on electronics-grade materials used in semiconductor and data center supply chains. The transatlantic exchange shows that no single region controls the entire value chain.
Corporate actions confirm the strategic importance of this driver. Honeywell completed the spin-off of its Advanced Materials business into Solstice Advanced Materials on October 30, 2025. This move creates a pure-play entity focused on high-margin specialty materials for electronics and sustainable cooling. The separation signals that even diversified industrials see concentrated exposure to this growth vector as value-creating.
Restraints
Persistent High Interest Rates and Market Uncertainty Slow Decarbonization Capital Expenditures
High borrowing costs in 2024 delayed capital projects aimed at reducing carbon emissions. Projects that require large upfront investment, such as advanced recycling facilities or bio-based feedstock plants, face longer payback periods. This restraint hits smaller specialty chemical firms hardest, as they have less access to low-cost capital than diversified majors.
The impact is visible in Europe, where chemical production volume declined 2.4% in 2025 and remains 11% below pre-pandemic averages. Energy prices and policy uncertainty make it difficult to justify new capacity investments. Producers focus on maintaining existing assets rather than expanding, which caps supply growth for certain specialty materials.
Regional cost disadvantages are forcing capacity rationalization. Netherlands production declined 4.9% in 2025, Germany 3.3%, and France 2.9%. This contraction is not uniform; Spain achieved growth of less than 1%. The divergence shows that even within a region, energy costs and regulatory environments create winners and losers, complicating supply chain planning for multinational buyers.
Growth Factors
Spokane Facility Expansion Targets AI-Driven Semiconductor Demand
An expansion of a Spokane electronic materials facility will double sputtering target capacity by 2029. This $200 million investment directly targets the AI-driven semiconductor demand that requires high-purity materials for chip fabrication. The project signals that capacity constraints in the supply chain are being addressed with targeted, large-scale investments.
This capacity expansion aligns with policy support from the CHIPS Act, which incentivizes domestic production of semiconductor materials. Buyers of electronic materials now prioritize suppliers with US-based capacity to qualify for incentives and reduce supply chain risk. The facility expansion creates a first-mover advantage in serving fabs built under the Act.
Rising adoption of high-performance protective fibers in defense applications adds another growth vector. Geopolitical priorities have shifted procurement toward materials that are not just high-performing. This creates a bifurcated market where materials from certain regions command premium pricing due to security considerations.
Emerging Trends
Shift Toward Independent Pure-Play Specialty Materials Companies Gains Momentum
The spin-off of Honeywell’s Advanced Materials business into Solstice Advanced Materials, completed October 30, 2025, exemplifies a broader trend. Corporate separations create entities focused solely on high-margin specialty portfolios, unburdened by exposure to commodity chemical cycles. These independent firms can allocate capital more nimbly to high-growth end markets.
Customer-driven innovation in bio-based feedstocks and advanced recycling is accelerating. Buyers are demanding materials that combine performance with circular economy credentials. This is not a niche requirement; it is becoming a baseline expectation for automotive, electronics, and consumer goods companies. Suppliers that develop certified sustainable alternatives gain preferred supplier status.
The proliferation of AI and data centers is not just driving volume; it is reshaping material specifications. Thermal management requirements for high-speed computing are forcing reformulation of polymers, coatings, and composites. Suppliers that can provide materials with validated thermal conductivity data at chip-level scales capture engineering design wins that lock in multi-generation product cycles.
Key Companies Insights
Arkema has built its specialty portfolio around high-performance polymers and adhesives that serve aerospace, electronics, and energy markets. Its focus on bio-based and recyclable materials positions it directly in the path of customer sustainability mandates that are now influencing procurement decisions. Arkema’s ability to offer fluoropolymers, polyamides, and specialty acrylics from a single supplier relationship gives it a bundling advantage that standalone producers cannot easily replicate.
DuPont operates at the intersection of electronics, water filtration, and protective materials — three segments where performance requirements are tightening and substitution is limited. Its materials science depth gives it credibility in semiconductor and defense applications where qualification timelines are long and switching costs are high. DuPont’s ongoing portfolio reshaping toward higher-margin specialty segments reflects the same logic driving the Honeywell-Solstice spin-off — focused platforms capture premium pricing more effectively than diversified structures.
Covestro anchors its competitive position in polycarbonates and polyurethanes used across automotive, construction, and electronics. The company’s push toward circular feedstocks and chemical recycling is not purely an ESG play — it is a commercial strategy to meet procurement requirements from automotive OEMs and electronics brands who are building recycled content targets into supplier contracts. Meeting those targets ahead of competitors locks in preferred supplier status for multi-year supply agreements.
Dow Chemicals holds one of the broadest specialty chemical portfolios in the market, spanning packaging materials, industrial coatings, and electronic materials. Its scale gives it raw material cost advantages, but its real competitive moat lies in formulation expertise built over decades of application development with global manufacturers. U.S. basic chemical manufacturing added USD 130.593 Billion in value in 2022, per the Federal Reserve Board — a sector where Dow’s infrastructure and customer relationships translate into durable revenue even as end markets shift.
Key Companies
- Arkema
- DuPont
- Covestro
- Dow Chemicals
- Evonik Industries
- Siemens
- Saint-Gobain
- LANXESS
- BASFLUOYANG
- DAYANG
- Honeywell
- Lonza
Recent Development
- In October 2025, Arkema highlighted strategic collaborations with ARAYMOND, Vorwerk Engineering, Resinex, and HP Additive Manufacturing Solutions to advance sustainable high-performance polymer innovations at K 2025. Arkema acquired Dow’s flexible packaging laminating adhesives business for an enterprise value of $150 million to strengthen its specialty materials portfolio.
- In August 2025, DuPont agreed to sell its Aramids business (Kevlar and Nomex) to Arclin for ~$1.8 billion, focusing its portfolio on higher-growth specialty materials. DuPont announced acquisition of Donatelle Plastics Incorporated to expand its advanced medical device and high-performance polymer manufacturing capabilities.
Market Scope
| Report Features | Description |
|---|---|
| Market Value (2025) | USD 90.65 Billion |
| Forecast Revenue (2035) | USD 204.96 Billion |
| CAGR (2026-2035) | 8.5% |
| Base Year for Estimation | 2025 |
| Historic Period | 2020-2024 |
| Forecast Period | 2026-2035 |
| Report Coverage | Revenue Forecast, Market Dynamics, Competitive Landscape, Recent Developments |
| Segments Covered | By Product Type (Films, Coatings, Other), By Material Type (Composites, Ceramics, Metals, Polymers), By Application Type (Construction, Automotive, Electronics, Healthcare, Food and Beverage, Others) |
| Regional Analysis | North America (US and Canada), Europe (Germany, France, The UK, Spain, Italy, and Rest of Europe), Asia Pacific (China, Japan, South Korea, India, Australia, and Rest of APAC), Latin America (Brazil, Mexico, and Rest of Latin America), Middle East & Africa (GCC, South Africa, and Rest of MEA) |
| Competitive Landscape | Arkema, DuPont, Covestro, Dow Chemicals, Evonik Industries, Siemens, Saint-Gobain, LANXESS, BASFLUOYANG, DAYANG, Honeywell, Lonza |
| Customization Scope | Customization for segments, region/country-level will be provided. Moreover, additional customization can be done based on the requirements. |
| Purchase Options | We have three licenses to opt for: Single User License, Multi-User License (Up to 5 Users), Corporate Use License (Unlimited User and Printable PDF) |
