What is the Grid Energy Storage Market Size?
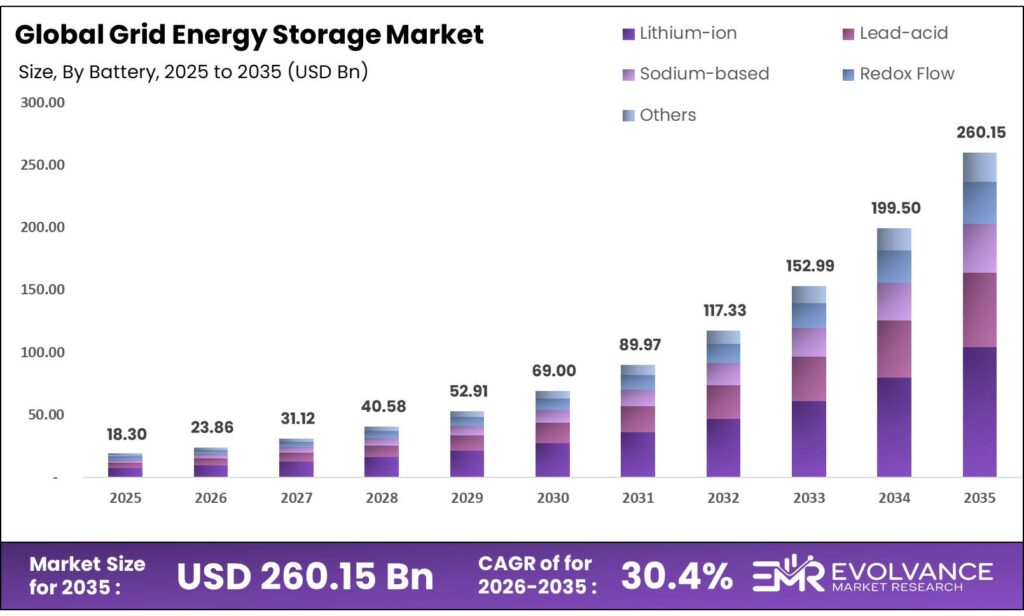
The Global Grid Energy Storage Market size will be worth around USD 260.15 Billion by 2035 from USD 18.30 Billion in 2025, growing at a CAGR of 30.4% during the forecast period 2026 to 2035. Utility buyers are moving fast to replace ageing grid assets with battery-backed systems, driven by clean energy mandates and rising peak-demand events. Enterprise and government buyers are locking in long-term storage contracts ahead of renewable capacity deadlines. However, volatile raw material prices and interconnection backlogs remain the key supply-side threats to project timelines.
Market Highlights
- The Global Grid Energy Storage Market valued at USD 18.30 Billion in 2025, reaching USD 260.15 Billion by 2035, at a CAGR of 30.4% from 2026 to 2035.
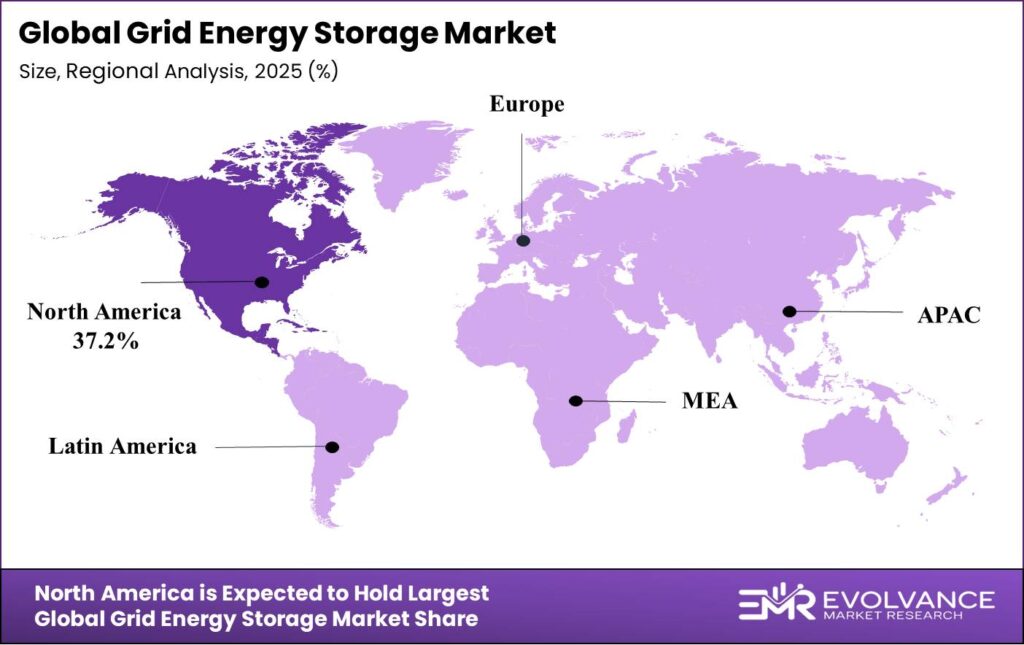
- North America leads all regions with 37.2% market share, valued at USD 6.8 Billion
- Front-of-the-Meter (FIM) segment dominates with 58.6% market share in 2025
- Lithium-ion chemistry holds 64.2% of the battery chemistry segment in 2025
Market Overview
Grid energy storage covers systems that store electricity on the power grid for later use. These systems sit either in front of the utility meter — serving large transmission and distribution networks — or behind it, at homes, businesses, and industrial sites. The core value is time-shifting power: storing cheap or clean energy when supply is high and releasing it when demand peaks.
The market spans multiple battery types — lithium-ion, lead-acid, sodium-based, redox flow, and others — deployed across utility-scale plants, renewable energy facilities, commercial sites, and residential settings. Storage operators earn revenue through energy arbitrage, capacity payments, and grid services such as frequency regulation and voltage support. These revenue streams make storage projects bankable for project finance structures.
According to BloombergNEF, approximately 170 GWh of stationary battery storage was installed globally in 2024. This shows that the market crossed a scale threshold where project economics now support mainstream utility procurement rather than pilot programs. Developers and investors who built supply chains and project pipelines before 2024 now hold structural cost advantages over late entrants.
Global utility-scale energy storage cell shipments reached 283 GWh in 2024. This signals that cell manufacturing capacity is now outpacing project deployment rates — a shift that compresses margins for commodity cell makers but benefits system integrators who can offer full turnkey solutions at competitive prices.
Government policy is now the single strongest accelerant in this market. The U.S. Inflation Reduction Act created direct manufacturing and investment tax credits that de-risked utility-scale battery projects at scale. India launched a 4 GWh Viability Gap Funding scheme with a ₹3,760 Crore budget in 2024. The EU approved €3 Billion in state aid for large-scale storage under its 2024 Temporary Crisis and Transition Framework.
Grid Type Insights
Front-of-the-Meter (FIM) dominates with 58.6% due to utility-scale procurement scale and revenue certainty.
In 2025, Front-of-the-Meter (FIM) held a dominant market position in the By Grid Type segment of Grid Energy Storage Market, with a 58.6% share. FIM systems connect directly to the transmission or distribution grid, making them eligible for wholesale energy market revenues, capacity payments, and ancillary services contracts. This multi-stream revenue model gives project developers bankable cash flows that attract institutional capital. The U.S. added 10.3 GW / 37.14 GWh of new utility-scale battery storage in 2024, confirming that FIM is where the bulk of capital is flowing.
Utility-Scale Storage forms the backbone of the FIM category. These are standalone battery plants — often 100 MW or larger — that bid directly into energy markets. California ISO reported grid batteries supplied over 6,600 MW during the September 2024 evening peak, preventing emergency alerts. That single event made the commercial case for utility-scale storage clearer than any forecast could. Utilities that lacked storage capacity during that event now face pressure from regulators and ratepayers to procure it.
Behind-the-Meter (BTM) includes all storage installed on the customer side of the utility meter. While BTM holds a smaller share than FIM, it is growing fast as commercial electricity rates rise and virtual power plant programs create new revenue channels for aggregated behind-the-meter assets.
Residential Storage Systems allow homeowners to store solar power and manage time-of-use electricity tariffs. The U.S. residential energy storage market added approximately 1.25 GW in 2024, reflecting strong consumer adoption in markets with high retail electricity prices and solar incentives.
Commercial and Industrial (C&I) Storage serves factories, office parks, data centers, and retail facilities that want to cut peak demand charges and improve energy reliability. C&I buyers often have higher credit quality than residential customers, making them attractive anchor clients for storage developers building aggregated BTM portfolios.
Ownership Insights
Third-party Owned dominates with 61.5% due to capital efficiency and developer financing models.
In 2025, Third-party Owned held a dominant market position in the By Ownership segment of Grid Energy Storage Market, with a 61.5% share. Under this model, a developer or financier owns the storage asset and sells capacity or energy services to a utility or end user under a long-term contract. This structure allows utilities and commercial buyers to access storage benefits without putting capital on their balance sheets — a decisive advantage in capital-constrained environments.
Utility Owned storage is procured and operated directly by the regulated utility. Utilities in states or regions with favorable rate-base treatment for storage assets prefer this model because they can earn a regulated return on the capital deployed. Regulatory approval processes for rate-base inclusion are the main factor determining whether utility-owned or third-party models win in each jurisdiction.
Battery Chemistry Insights
Lithium-ion dominates with 64.2% due to proven performance, supply chain scale, and falling costs.
In 2025, Lithium-ion held a dominant market position in the By Battery Chemistry segment of Grid Energy Storage Market, with a 64.2% share. Lithium-ion cells benefit from the largest global manufacturing base — CATL alone maintained 646 GWh of annual production capacity as of 2024 — which drives down costs through volume. Project developers default to lithium-ion because the supply chain, installation practices, and performance data are all well understood by lenders and insurers.
Lead-acid batteries remain in use for backup power and short-duration applications where upfront cost matters more than energy density. Lead-acid faces displacement pressure from falling lithium-ion prices but retains a cost edge in specific low-cycle, low-depth-of-discharge use cases common in telecom and UPS applications.
Sodium-based batteries have emerged as a credible alternative to lithium-ion for grid storage, particularly as lithium carbonate prices stayed volatile in 2024. Sodium-ion cells use abundant raw materials and avoid the cobalt and nickel exposure that complicates lithium supply chains. CATL commercially launched sodium-ion cells, and pilot deployments accelerated in 2024 following these announcements.
Redox Flow batteries use liquid electrolytes stored in external tanks, making them well-suited for long-duration storage — four hours or more — where lithium-ion systems face cost disadvantages at scale. Flow battery pilot deployments accelerated in 2024 as utility procurement shifted toward longer-duration systems, and early commercial projects in the U.S. and Europe are now building a reference case for broader adoption.
Others in the battery chemistry segment include compressed air, thermal storage, and gravity-based systems. These technologies target niche use cases such as multi-day or seasonal storage where electrochemical batteries are not yet cost-competitive. Their commercial scale remains limited but growing as long-duration storage mandates expand.
Application Insights
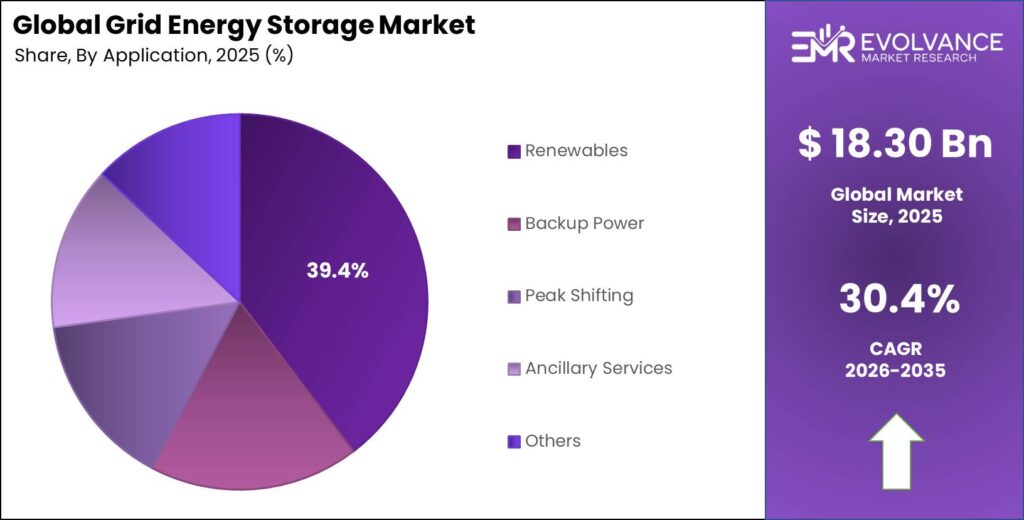
Renewables dominates with 39.4% due to grid integration mandates and renewable procurement volumes.
In 2025, Renewables held a dominant market position in the By Application segment of Grid Energy Storage Market, with a 39.4% share. As solar and wind generation scales up, grid operators face increasing curtailment and frequency instability events. Storage paired with renewables resolves these integration challenges and is now required by many grid codes as a condition for new renewable project connections. China added over 21 GW of new electrochemical energy storage in 2024 under National Energy Administration deployment targets — the clearest signal that renewable integration storage is now policy-driven infrastructure, not optional equipment.
Backup Power covers storage systems that maintain electricity supply during grid outages. Commercial buyers — hospitals, data centers, manufacturers — are upgrading from diesel backup generators to battery systems that offer faster response, lower emissions, and lower operating costs over a ten-year project life.
Peak Shifting allows grid operators and commercial users to store low-cost off-peak electricity and discharge it during high-cost peak hours. As time-of-use tariffs spread to more markets, the arbitrage value of peak shifting rises — directly increasing the revenue case for new storage projects without requiring any change in grid infrastructure.
Ancillary Services include frequency regulation, spinning reserves, and voltage support — services grid operators pay for to keep the power system stable second-by-second. Batteries respond to frequency deviations in milliseconds, far faster than gas turbines or hydro plants, making them the preferred technology for ancillary service contracts where response speed determines payment rates.
Market Segments Covered in the Report
By Grid Type
- Front-of-the-Meter (FIM)
- Utility-Scale Storage
- Large Renewable Plant Storage
- Transmission and Distribution Support
- Behind-the-Meter (BTM)
- Residential Storage Systems
- Commercial and Industrial (C&I) Storage
- Virtual Power Plants (VPP)
By Ownership
- Third-party Owned
- Utility Owned
By Battery Chemistry
- Lithium-ion
- Lead-acid
- Sodium-based
- Redox Flow
- Others
By Application
- Renewables
- Backup Power
- Peak Shifting
- Ancillary Services
- Others
Grid Energy Storage Market Regional Insights
North America Dominates the Grid Energy Storage Market with a Market Share of 37.2%, Valued at USD 6.8 Billion
North America holds 37.2% of the global grid energy storage market, valued at USD 6.8 Billion in 2025. The U.S. Inflation Reduction Act created investment and manufacturing tax credits that made large-scale battery projects financially viable without merchant risk. U.S. grid-scale battery installations reached 12.3 GW in 2024, up from 8.7 GW in 2023 — a 41% single-year jump that confirms IRA incentives are translating into real procurement at scale.
Europe Grid Energy Storage Market Trends
Europe’s total installed energy storage capacity reached 89 GW in 2024, with 19.1 GWh of new capacity added in the year. The EU’s €3 Billion state aid approval for large-scale storage under the 2024 Temporary Crisis and Transition Framework gives project developers the policy certainty needed to reach financial close. The UK alone has 24 GW of battery storage in its planning pipeline as of Q1 2025 — signaling that Europe’s procurement wave is still building.
Asia Pacific Grid Energy Storage Market Trends
Asia Pacific is the world’s largest single-region market for new energy storage additions. China accounted for 62% of global energy storage capacity additions in 2024, adding 42.37 GW / 101.13 GWh of new capacity in a single year. China’s cumulative new energy storage reached 73.76 GW / 168 GWh by end-2024 and surpassed 101 GW by mid-2025. This scale gives Chinese manufacturers a home-market volume base that supports aggressive global export pricing.
Latin America Grid Energy Storage Market Trends
Latin America is an early-stage but high-potential region for grid storage. Countries like Brazil and Chile are adding large renewable capacity — solar and wind — that will require storage for grid stabilization as penetration rises past 30% of the generation mix. Regulatory frameworks for storage compensation are still developing in most Latin American markets, making project bankability the primary near-term constraint for developers.
Middle East & Africa Grid Energy Storage Market Trends
The Middle East and Africa region is building storage primarily to support renewable energy diversification away from fossil fuels. Gulf Cooperation Council countries are setting clean energy targets that require utility-scale storage to manage solar generation variability. South Africa’s chronic grid reliability problems create strong demand for both utility-scale and behind-the-meter backup storage applications.
Key Regions and Countries
North America
- US
- Canada
Europe
- Germany
- France
- The UK
- Spain
- Italy
- Rest of Europe
Asia Pacific
- China
- Japan
- South Korea
- India
- Australia
- Rest of APAC
Latin America
- Brazil
- Mexico
- Rest of Latin America
Middle East & Africa
- GCC
- South Africa
- Rest of MEA
Regulatory Landscape
The U.S. Inflation Reduction Act, signed in 2022 and updated through Treasury guidance in 2023 and 2024, created a 30% Investment Tax Credit for standalone battery storage projects and manufacturing production credits for domestically made cells and modules. These credits directly improved project returns and brought institutional capital into the U.S. BESS market at a pace regulators had not anticipated.
The European Union’s Temporary Crisis and Transition Framework, approved in 2024, authorized up to €3 Billion in state aid for large-scale energy storage projects across member states. This framework allows EU governments to subsidize storage without triggering standard state-aid rules — a targeted policy response to the clean energy transition that accelerates project timelines for developers with shovel-ready projects.
India’s Ministry of New and Renewable Energy launched its BESS Viability Gap Funding scheme in 2024, allocating ₹3,760 Crore to support 4 GWh of battery storage projects. This scheme de-risks the first wave of utility-scale storage in India, where merchant revenue streams are not yet developed enough to support project finance on commercial terms alone.
China’s National Energy Administration set mandatory storage requirements for new large-scale renewable projects under its 2024 deployment targets, requiring co-located battery storage as a grid connection condition. This regulation converted storage from an optional addition to a structural requirement for new renewable capacity — the most direct regulatory driver of volume in the global market.
Grid Energy Storage Market Dynamics
Emerging Trends
Shift to Longer-Duration Storage Systems Reshapes Procurement Specs and Technology Mix
Utility procurement specs in the U.S. and Europe shifted toward four-to-eight-hour storage systems in 2024. This is a direct response to grid events like the California September 2024 evening peak — where demand extended beyond the discharge window of two-hour battery systems. Longer-duration specs favor flow batteries and advanced lithium-ion architectures over standard two-hour systems, creating a product differentiation opportunity for manufacturers who invested early in longer-duration designs.
CATL launched its 6.25 MWh EnerC Plus containerized grid storage system in 2024 with a standard 20-foot footprint. Standardized container formats reduce installation costs and shorten project timelines by allowing modular deployment rather than custom engineering on each site. This trend toward commodity-like hardware standards will compress margins for mid-tier integrators who compete on system design rather than scale.
Flow battery and sodium-ion pilot deployments accelerated in 2024 following commercial launch announcements from major manufacturers. Non-China global energy storage cell shipments reached 137.3 GWh in 2024 — showing that procurement diversification beyond Chinese-made lithium-ion cells is already under way. Buyers in the U.S. and Europe are actively building alternative supply chains ahead of potential trade policy shifts.
Drivers
Mandatory Clean Energy Targets Force Utility-Scale Battery Procurement Across Major Markets
Clean energy mandates are converting storage from a discretionary investment to a required grid asset. Governments in the U.S., EU, UK, China, and India have set binding renewable energy targets that cannot be met without storage to manage variable solar and wind output. This shifts the buyer question from “should we procure storage?” to “how much and when?”
U.S. grid-scale battery installations reached 12.3 GW in 2024, up from 8.7 GW in 2023, driven by IRA incentives that cut effective project costs by up to 40%. The UK government confirmed 24 GW of battery storage in planning pipeline as of Q1 2025 to support its 2035 Clean Power Target. These are not aspirational numbers — they represent projects already in regulatory pipelines that will reach financial close in the next two to three years.
Australia’s National Electricity Market saw 5 GW+ of new battery projects reach financial close in 2024 alone. This confirms that policy-backed procurement programs are producing real capital commitment, not just planning activity. Vendors with proven utility-scale project track records hold a clear advantage in tender processes where delivery risk is as important as price.
Restraints
Lithium Carbonate Price Volatility Disrupts Long-Term Project Financial Modeling
Lithium carbonate prices remained volatile through 2024 despite a correction from 2022 peak levels. Battery energy storage system developers typically lock in EPC contracts six to eighteen months before project completion, but cell procurement timelines often extend further. Price swings during this window directly erode project margins that were already modeled on tight assumptions.
Long-term power purchase agreements and storage service contracts are priced at the time of signing — not at the time of delivery. When lithium costs move sharply between contract execution and cell procurement, developers absorb the difference. This exposure is forcing project developers to seek fixed-price cell supply contracts, which shifts pricing risk upstream to manufacturers who may not have the balance sheet to absorb it.
The U.S. interconnection queue backlog exceeded 2,600 GW of generation and storage capacity as of 2024. Projects waiting in this queue face multi-year delays before they can connect to the grid and start earning revenue. Combined with raw material price risk, the interconnection backlog creates a compounding effect: projects face cost uncertainty while also facing revenue delays, reducing the net present value of new storage investments.
Growth Factors
Government Subsidy Programs and Manufacturing Expansion Unlock New Revenue Segments
Targeted government subsidy programs are unlocking storage markets that could not attract private capital on commercial terms alone. India’s 4 GWh BESS Viability Gap Funding scheme, backed by ₹3,760 Crore, is the clearest example: it bridges the gap between what developers need to earn and what the Indian market currently supports in merchant revenue terms.
Tesla deployed 31.4 GWh of energy storage in 2024, up 125% year-on-year, supported by $756 Million in IRA manufacturing tax credits. Tesla’s Lathrop and Shanghai Megafactories now provide approximately 80 GWh per year of total Megapack production capacity. When a single manufacturer scales this fast, it signals that the market is large enough to absorb aggressive capacity additions — a signal that attracts additional capital into competing manufacturing programs.
The EU’s €3 Billion state aid approval under the 2024 Temporary Crisis and Transition Framework is directing capital into large-scale projects in member states that previously lacked the policy tools to attract private storage investment. Developers active in Europe now have a regulatory floor under project economics that makes multi-gigawatt pipeline development financially rational for the first time.
Key Companies Insights
ABB Group brings a broad electrical infrastructure portfolio to the grid storage market, spanning power conversion systems, grid automation, and digital energy management platforms. ABB’s strength lies in its ability to integrate battery storage into wider grid modernization programs — a bundled approach that suits utilities upgrading multiple systems simultaneously and reduces the number of vendor relationships they need to manage.
Fluence Energy reported full-year revenue of approximately $2.7 Billion for fiscal year 2024, up from $2.2 Billion in FY2023, with a backlog of $4.5 Billion. By fiscal year 2025, backlog grew to approximately $5.3 Billion and annual recurring revenue reached $148 Million — a figure that shows Fluence is successfully converting one-time hardware sales into long-term software and services revenue, which carries higher margins and more predictable cash flows.
BYD Co. Ltd. operates across the full battery value chain — from lithium-iron-phosphate cell manufacturing to complete grid storage system integration. BYD’s vertical integration gives it a structural cost advantage over assembler-type competitors who buy cells from third parties. As grid storage procurement volumes rise, BYD’s ability to quote system prices based on internal cell costs rather than market cell prices becomes an increasingly powerful competitive weapon in price-sensitive tenders.
LG Chem Ltd. reported full-year 2024 revenue of KRW 25.6 Trillion with operating profit of KRW 575.4 Billion. LG Chem’s energy storage business benefits from its established position in EV battery supply, which shares cell chemistry, manufacturing processes, and quality systems with grid storage applications. This cross-segment scale allows LG Chem to spread R&D and capital costs across larger volumes than grid-only competitors.
Key Players
- ABB Group
- Ambri Incorporated
- BYD Co. Ltd.
- Fluence Energy
- FZSONICK SA
- VRB Energy
- Mitsubishi Electric Corp.
- NGK Insulators Ltd.
- Panasonic Corp.
- Redflow Limited
- 24M Technologies, Inc.
- General Electric
- GS Yuasa Corp.
- Hitachi Ltd.
- KORE Power, Inc.
- LG Chem Ltd.
- Samsung SDI Co. Ltd.
- Lockheed Martin Corporation
- Sumitomo Electric Industries, Ltd.
Recent Development
- 2024 – Samsung SDI secured a contract worth over KRW 2 Trillion to supply LFP batteries for ESS in North America, with deliveries starting 2027. This contract signals a strategic shift toward iron-phosphate chemistry for large-scale North American grid storage projects.
- 2024 – CATL launched the 6.25 MWh EnerC Plus containerized grid storage system with a standard 20-foot footprint, targeting utility-scale projects that require modular, fast-deploy solutions across the U.S. and European markets.
- 2024 – CATL reported full-year revenue of CNY 362 Billion and net profit of CNY 50.75 Billion. Energy storage battery systems generated CNY 57.29 Billion with 93 GWh of shipments, confirming CATL’s position as the world’s largest grid storage cell supplier.
- 2024 – Sungrow reported global energy storage system shipments of 28 GWh, holding 14% global integrator market share and 21% European market share — ranking it second globally behind Tesla in annual BESS integrator shipments.
- Q1 2025 – CATL reported revenue of CNY 84.7 Billion with net profit of CNY 14 Billion, showing continued volume growth and margin resilience despite lower average selling prices across its product portfolio.
- H1 2025 – Sungrow reported energy storage revenue of CNY 17.803 Billion for the first half of 2025, more than doubling its H1 2024 energy storage revenue of CNY 7.816 Billion — reflecting sharp acceleration in global grid storage demand.
- FY2025 – Fluence Energy reported fiscal year 2025 revenue of $2.3 Billion, adjusted EBITDA of $19.5 Million, gross profit margin of 13.1%, and Q4 order intake exceeding $1.4 Billion, with total liquidity of approximately $1.3 Billion.
Market Scope
| Report Features | Description |
|---|---|
| Market Value (2025) | USD 18.30 Billion |
| Forecast Revenue (2035) | USD 260.15 Billion |
| CAGR (2026-2035) | 30.4% |
| Base Year for Estimation | 2025 |
| Historic Period | 2020-2024 |
| Forecast Period | 2026-2035 |
| Report Coverage | Revenue Forecast, Market Dynamics, Competitive Landscape, Recent Developments |
| Segments Covered | By Grid Type (Front-of-the-Meter, Behind-the-Meter), By Ownership (Third-party Owned, Utility Owned), By Battery Chemistry (Lithium-ion, Lead-acid, Sodium-based, Redox Flow, Others), By Application (Renewables, Backup Power, Peak Shifting, Ancillary Services, Others) |
| Regional Analysis | North America (US and Canada), Europe (Germany, France, The UK, Spain, Italy, and Rest of Europe), Asia Pacific (China, Japan, South Korea, India, Australia, and Rest of APAC), Latin America (Brazil, Mexico, and Rest of Latin America), Middle East & Africa (GCC, South Africa, and Rest of MEA) |
| Competitive Landscape | ABB Group, Ambri Incorporated, BYD Co. Ltd., Fluence Energy, FZSONICK SA, VRB Energy, Mitsubishi Electric Corp., NGK Insulators Ltd., Panasonic Corp., Redflow Limited, 24M Technologies Inc., General Electric, GS Yuasa Corp., Hitachi Ltd., KORE Power Inc., LG Chem Ltd., Samsung SDI Co. Ltd., Lockheed Martin Corporation, Sumitomo Electric Industries Ltd. |
| Customization Scope | Customization for segments, region/country-level will be provided. Moreover, additional customization can be done based on the requirements. |
| Purchase Options | We have three licenses to opt for: Single User License, Multi-User License (Up to 5 Users), Corporate Use License (Unlimited User and Printable PDF) |
