What is the Green Chemistry Solutions Market Size?
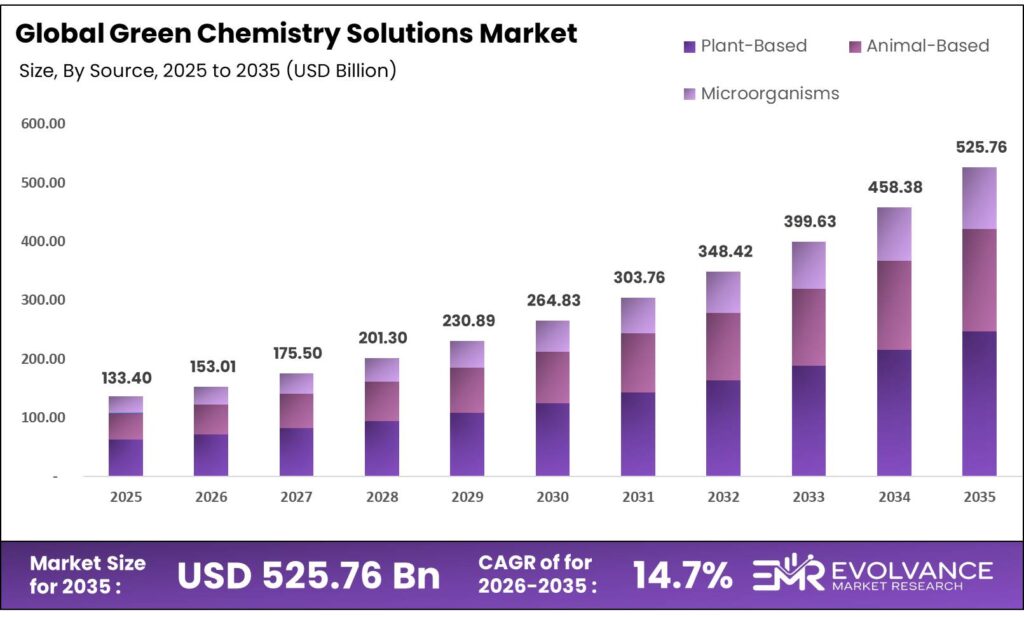
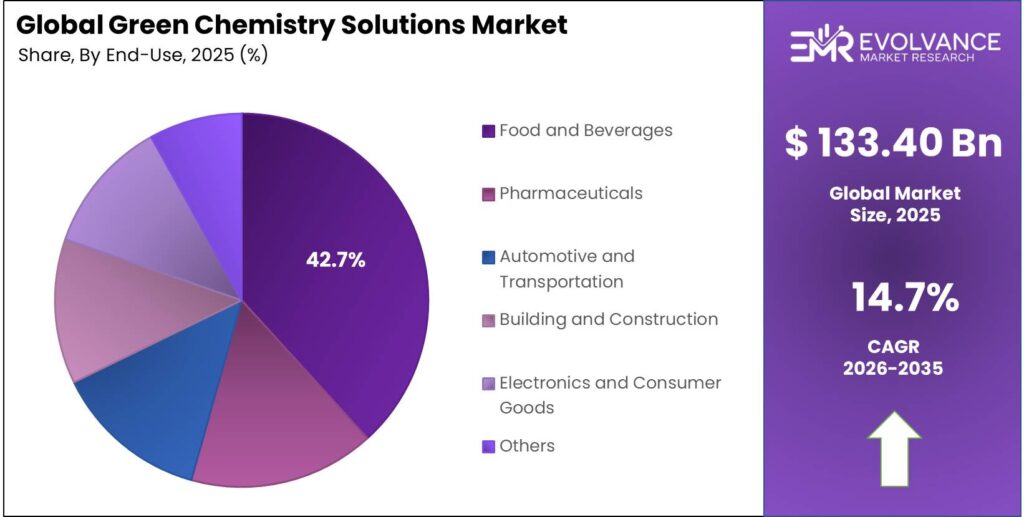
The Global Green Chemistry Solutions Market size will be worth around USD 525.76 Billion by 2035 from USD 133.40 Billion in 2025, growing at a CAGR of 14.70% during the forecast period 2026 to 2035. Strict environmental mandates and corporate net-zero targets are pushing chemical producers to replace fossil-based inputs with bio-derived alternatives at scale. Buyers are shifting procurement toward suppliers who can prove lifecycle benefits, not just product performance. Meanwhile, feedstock supply constraints and process scale-up costs remain active friction points for producers seeking to expand bio-based capacity.
Market Highlights
- The Green Chemistry Solutions Market is valued at USD 133.40 Billion in 2025 and will reach USD 525.76 Billion by 2035, at a CAGR of 14.70%
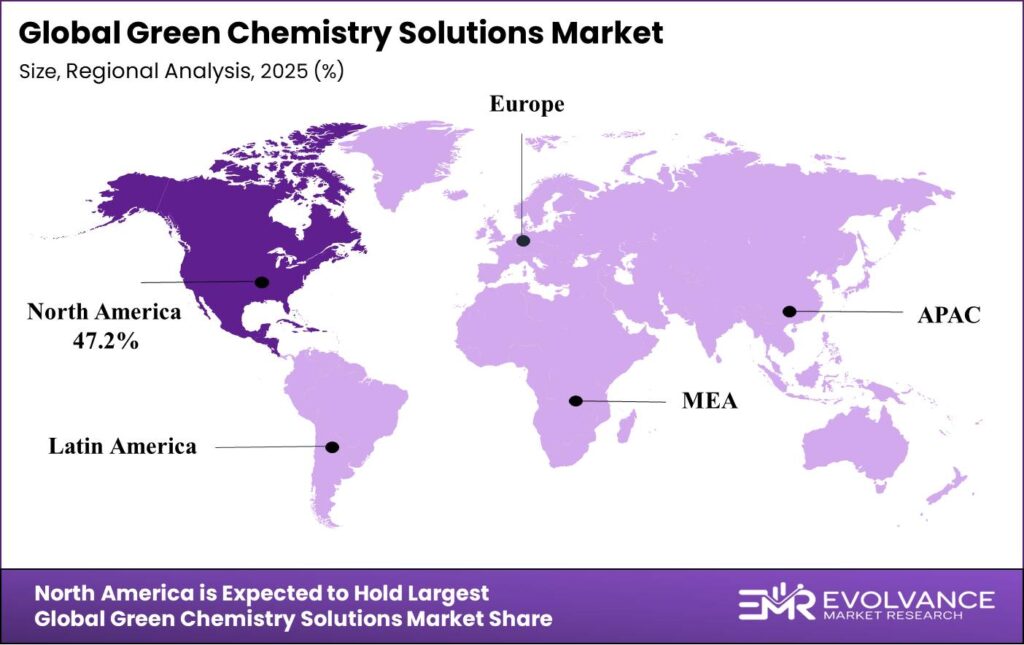
- North America leads all regions with a 47.2% market share, valued at USD 62.9 Billion
- By Product Type, Biopolymers dominate with a 62.4% share
- By Source, Plant-Based holds a dominant 54.2% share
- By Application, Chemical leads with a 41.5% share
- By End-Use, Food and Beverages holds a 42.7% share
Market Overview
Green chemistry solutions cover the design of chemical products and processes that cut or eliminate hazardous substances. The field spans bio-based polymers, renewable platform chemicals, biocatalysts, and sustainable process technologies. These solutions replace conventional petrochemical inputs with safer, lower-impact alternatives across manufacturing, packaging, pharma, and consumer goods.
The market spans a broad set of industries — from food packaging and textiles to auto parts and drug production. What binds them is a common problem: legacy chemical processes generate waste, emit carbon, and carry regulatory risk. Green chemistry solves all three, which is why demand now comes from procurement teams, not just sustainability officers. The shift from voluntary to mandatory in corporate chemical strategy has changed the sales cycle entirely.
According to OECD, global chemical industry production reached $5,681 billion in 2017, with OECD countries contributing 42% of total global output. This concentration of production in regulated economies means green chemistry compliance is not optional for major producers — it directly governs market access.
As reported by OECD, global chemical production will reach nearly $22,000 billion by 2060. That scale makes sustainable process adoption a structural economic necessity, not a preference. Meanwhile, approximately 1,000 new chemicals enter the global market every year, per OECD-ilibrary, compounding the workload for regulators and creating steady demand for green chemistry testing and design services.
Government action is a primary force reshaping this market. The US released its Federal Sustainable Chemistry Strategic Plan in December 2024, setting out a roadmap from lab discovery to commercial adoption. The EU’s Chemicals Strategy for Sustainability continues to raise the bar on hazard reduction and safe-by-design requirements. These mandates do not just create compliance demand — they move green chemistry from niche innovation to standard operating procedure.
Product Type Insights
Biopolymers dominate with 62.4% due to broad application fit and end-of-life benefits.
In 2025, Biopolymers held a dominant market position in the By Product Type segment of the Green Chemistry Solutions Market, with a 62.4% share. Their lead stems from structural versatility — biopolymers replace conventional plastics in packaging, textiles, and medical devices with comparable performance and lower carbon footprint. BASF SE worked with over 70,000 Tier-1 suppliers globally in 2024, reflecting the scale of bio-based input sourcing now embedded in major chemical producers’ supply chains.
Bio-alcohols serve as both fuel blending agents and chemical feedstocks, giving them dual-market demand that pure specialty chemicals lack. Their production pathway — typically from corn, sugarcane, or cellulosic biomass — is well-established, reducing technology risk for buyers. This makes bio-alcohols the most commercially mature sub-segment after biopolymers, with active procurement across fuel, pharma, and cosmetics supply chains.
Bio-ketones are finding traction in solvent applications where regulatory pressure is forcing reformulation away from petroleum-derived options. Demand is strongest in coatings and adhesives, where bio-ketone substitution meets both performance specs and compliance requirements simultaneously. Their cost premium over conventional ketones remains a limiting factor at scale.
Bio-organic Acids anchor multiple downstream markets including food preservation, polymer synthesis, and textile processing. Their steady-state demand in established industrial applications makes them a lower-risk entry point for producers shifting feedstock sourcing toward bio-based inputs without reformulating end products.
Source Insights
Plant-Based dominates with 54.2% due to feedstock availability and processing maturity.
In 2025, Plant-Based held a dominant market position in the By Source segment of the Green Chemistry Solutions Market, with a 54.2% share. Corn, sugarcane, soy, and lignocellulosic crops provide scalable, geographically distributed feedstocks that enable commercial-scale green chemical production. Their dominance reflects both supply chain depth and decades of bioprocessing investment.
Animal-Based sources — including fats, oils, and protein hydrolysates — remain important in specialty chemical and personal care applications. Their use is constrained by ethical sourcing requirements and supply variability, but in niche markets like collagen-derived ingredients and tallow-based surfactants, animal-based inputs still hold technical advantages over plant alternatives.
Microorganisms represent the fastest-moving source category in this market. Fermentation-based production using bacteria, yeast, and algae enables synthesis of chemicals with no viable plant-based route. As synthetic biology tools mature and fermentation costs fall, microbial sources will close the cost gap with plant-based inputs, shifting their role from specialist to mainstream.
Application Insights
Chemical dominates with 41.5% due to scale of substitution opportunity and regulatory pressure.
In 2025, Chemical held a dominant market position in the By Application segment of the Green Chemistry Solutions Market, with a 41.5% share. The chemical industry itself is both the producer and the primary user of green chemistry solutions. Around 40,000 chemicals are produced at high volumes globally, creating the primary target base for green substitution and safer process redesign mandated under evolving regulatory frameworks.
Paints and Coatings represent one of the clearest commercial cases for green chemistry adoption. Solvent reduction mandates in Europe and North America are forcing reformulation at scale. Water-based and bio-based binders now meet performance requirements that previously required petroleum solvents, making the commercial transition both viable and increasingly obligatory for large coatings producers.
Packaging is experiencing the most visible shift toward bio-based materials, driven by single-use plastic restrictions across the EU, UK, and several US states. Brands with public sustainability commitments are pulling demand through their packaging supply chains faster than regulatory timelines require, accelerating green chemistry adoption in this segment.
Textiles and Apparel present a large but fragmented market for green chemistry inputs. Dyeing and finishing processes are water-intensive and historically toxic — making them a high-priority target for bio-based and enzymatic alternatives. Adoption is uneven, with fast fashion at one end and premium brands driving most early investment in sustainable textile chemistry.
Personal Care and Cosmetics buyers show the highest willingness to pay a premium for green chemistry-derived ingredients. Consumer-facing clean beauty labeling creates a direct revenue benefit for brands reformulating with bio-based actives and surfactants, making this the segment where green chemistry commands the strongest margin uplift.
End-Use Insights
Food and Beverages dominates with 42.7% due to regulatory clarity and consumer-driven reformulation pressure.
In 2025, Food and Beverages held a dominant market position in the By End-Use segment of the Green Chemistry Solutions Market, with a 42.7% share. Food safety regulations create mandatory demand for non-toxic, bio-compatible chemical inputs across processing, preservation, and packaging. More than 70% of the world’s top 100 chemical companies have committed to carbon neutrality by 2050, per Reuters, making food-grade green chemistry a near-term commercial priority for their product portfolios.
Pharmaceuticals are a high-value end-use segment where green chemistry delivers measurable process efficiencies alongside compliance benefits. Continuous manufacturing and biocatalysis reduce solvent waste and energy use in active pharmaceutical ingredient production. Merck’s continuous process for KEYTRUDA, awarded in 2024, cut energy and water use significantly — demonstrating that green process redesign in pharma is commercially proven, not theoretical.
Automotive and Transportation buyers are adopting bio-based polymers, lubricants, and coatings as part of broader vehicle lightweighting and lifecycle emissions strategies. Regulatory pressure on end-of-life vehicle recycling in Europe is adding a secondary driver, making bio-degradable and recyclable chemical inputs structurally advantageous for parts manufacturers.
Building and Construction is an emerging priority for green chemistry adoption, driven by green building certification requirements and embodied carbon accounting. Bio-based insulation materials, low-VOC adhesives, and sustainable coating systems are gaining specification traction as building codes increasingly mandate reduced chemical hazard profiles.
Electronics and Consumer Goods manufacturers face unique green chemistry challenges — circuit board manufacturing and device assembly rely on highly specialized chemical processes. Regulatory restrictions on brominated flame retardants and certain solvents are pushing electronics producers to qualify green alternatives, a technically demanding but commercially necessary transition.
Market Segments Covered in the Report
By Product Type
- Biopolymers
- Bio-alcohols
- Bio-ketones
- Bio-organic Acids
- Platform Chemicals
- Others
By Source
- Plant-Based
- Animal-Based
- Microorganisms
By Application
- Chemical
- Paints and Coatings
- Packaging
- Textiles and Apparel
- Personal Care and Cosmetics
By End-Use
- Food and Beverages
- Pharmaceuticals
- Automotive and Transportation
- Building and Construction
- Electronics and Consumer Goods
- Others
Regional Insights
North America Dominates the Green Chemistry Solutions Market with a Market Share of 47.2%, Valued at USD 62.9 Billion
North America holds a 47.2% share, valued at USD 62.9 Billion, driven by a mature regulatory framework and deep private-sector investment in sustainable chemistry. The US Federal Sustainable Chemistry Strategic Plan released in December 2024 reinforces federal R&D funding and commercial adoption pathways. This policy backbone, combined with large domestic chemical producers, gives North America a structural head start that other regions are only beginning to replicate.
Europe Green Chemistry Solutions Market Trends
Europe holds a strong second position in this market, anchored by the EU’s Chemicals Strategy for Sustainability and Green Deal policy architecture. Safe and Sustainable by Design (SSbD) principles are now embedded in EU regulatory frameworks, making green chemistry compliance a prerequisite for market access. This positions Europe as a standard-setter whose rules increasingly shape global product design choices.
Asia Pacific Green Chemistry Solutions Market Trends
Asia Pacific is the fastest-growing region in this market, with China, India, and Japan driving both production scale and domestic policy reform. China’s bio-based chemical industry benefits from large-scale fermentation capacity and state-backed investment. India’s pharmaceutical and textile sectors are under growing pressure to adopt greener processes, creating volume demand for bio-based inputs and enzymatic processing solutions across the value chain.
Latin America Green Chemistry Solutions Market Trends
Latin America, led by Brazil, holds a natural advantage in plant-based feedstock supply — sugarcane ethanol and soy derivatives anchor a growing bio-based chemicals sector. Brazil’s established bioethanol infrastructure reduces the capital barrier for bio-alcohol and platform chemical scale-up. However, inconsistent industrial policy and currency volatility slow foreign investment in higher-value green chemistry production facilities.
Middle East & Africa Green Chemistry Solutions Market Trends
Middle East and Africa remain early-stage in green chemistry adoption, with most activity concentrated in petrochemical diversification plays by GCC producers. Saudi Aramco, SABIC, and regional peers are investing in bio-based and circular chemistry to reduce exposure to fossil fuel demand risk. South Africa shows early momentum in bio-economy policy, though infrastructure gaps limit near-term commercial scale.
Key Regions and Countries
North America
- US
- Canada
Europe
- Germany
- France
- The UK
- Spain
- Italy
- Rest of Europe
Asia Pacific
- China
- Japan
- South Korea
- India
- Australia
- Rest of APAC
Latin America
- Brazil
- Mexico
- Rest of Latin America
Middle East & Africa
- GCC
- South Africa
- Rest of MEA
Regulatory Landscape
The EU Chemicals Strategy for Sustainability, updated through 2024 and 2025 under the European Green Deal, sets binding requirements for hazard reduction and safe-by-design chemical production across all member states. It directly restricts several high-volume petrochemical inputs and creates commercial mandates for green chemistry alternatives. Producers exporting to the EU must align product portfolios with these standards to maintain access.
The US Federal Sustainable Chemistry Strategic Plan, released in December 2024, outlines federal goals for green chemistry across discovery, development, and commercial adoption. It coordinates funding across EPA, DOE, and NSF, signaling a multi-agency commitment that reduces policy uncertainty for firms investing in domestic green chemistry R&D and scale-up. This plan materially lowers commercialization risk for US-based producers.
The OECD Mutual Acceptance of Data framework operates across 45 participating countries, harmonizing chemical safety testing standards and cutting duplicate testing costs by €309 million annually. For green chemistry producers, this framework lowers the compliance cost of entering multiple regulated markets simultaneously — a key enabler for smaller innovators scaling globally.
Additionally, the UN Environment Programme’s Green and Sustainable Chemistry framework defines 10 key objectives guiding global chemical sustainability, including hazard reduction and circularity adoption. Countries aligning national chemical policy with UNEP objectives create regulatory convergence that simplifies market entry for compliant green chemistry producers operating across regions.
Green Chemistry Solutions Market Dynamics
Drivers
Mandatory Environmental Regulations Push Chemical Producers to Redesign Product Portfolios
The chemical industry contributes approximately 5–6% of total global greenhouse gas emissions. That figure has moved the sector from voluntary climate commitments to regulatory targets in key markets. Regulators in the EU and US are now treating chemical production as a measurable emissions source, not a background sector, forcing producers to redesign processes and sourcing at scale.
The EU’s Chemicals Strategy for Sustainability updates and the US Federal Sustainable Chemistry Strategic Plan released in December 2024 together create a regulatory floor that chemical producers cannot ignore. Compliance is no longer a risk management exercise — it is now a market access condition. Producers who delay green process investment face exclusion from the EU and growing portions of the US procurement market.
Moreover, BASF SE’s sustainable-future solutions reached 48.5% of total revenue in FY2025, up from 46.3% in FY2024, per BASF reporting. This shows that even the world’s largest chemical producer is now generating near-majority revenue from green-aligned products. Smaller producers reading this signal understand that regulatory compliance and commercial performance are converging — green chemistry is no longer a cost center.
Restraints
High Production Costs and Scale-Up Delays Slow Bio-Based Process Transition
Bio-based and sustainable chemical processes carry higher production costs than their conventional alternatives — at least in early commercial phases. Fermentation-based production, enzymatic processes, and renewable feedstock sourcing all require capital investment in infrastructure that conventional petrochemical facilities do not. For mid-size producers, this cost gap is a real barrier, not a perception problem.
Scaling green chemistry investments is further complicated by a current industry downcycle where companies are prioritizing cost savings over long-term capital deployment. When management is under pressure to protect margins, green process upgrades that pay off over five to seven years get deferred. This creates a timing mismatch between regulatory pressure and corporate investment cycles that could delay market expansion.
Circular chemical strategies could reduce total global chemical demand by up to 31% by 2050, per Reuters. While this supports sustainability goals, it also signals lower absolute volume demand for chemical producers who depend on volume growth to justify green investment. Producers must factor potential demand reduction into their business case for sustainable process investment, complicating ROI calculations.
Growth Factors
Federal Strategic Plans and Biocatalysis Advances Open New Revenue Streams
The US Federal Sustainable Chemistry Strategic Plan creates a funded pathway from green chemistry discovery to commercial adoption. Federal coordination across EPA, DOE, and NSF reduces the gap between academic innovation and industrial application — a gap that has historically slowed commercialization. Producers positioned close to US federal research networks gain early access to innovations before they reach open markets.
OECD’s Mutual Acceptance of Data system saves €309 million annually by eliminating duplicate chemical safety testing across 45 countries, per OECD. For green chemistry producers targeting multi-country commercial launches, this framework cuts compliance overhead significantly. It also signals that regulatory harmonization is actively progressing — reducing the market fragmentation that has historically penalized globally-minded green chemistry innovators.
Dow and Beyond Benign expanded their collaboration in 2024 to advance green chemistry curricula and industrial training programs. This partnership accelerates the next generation of chemists trained in sustainable design — building the human capital base that commercial green chemistry scale-up requires. Chemical production has grown 50-fold since 1950, per Statspanda, and the workforce supporting that growth now needs retraining toward green chemistry principles to sustain the next growth phase sustainably.
Emerging Trends
Safe and Sustainable by Design Principles Reshape Chemical Product Development Across Regulated Markets
The EU’s push for Safe and Sustainable by Design (SSbD) principles is changing how chemical products are conceived, not just manufactured. Producers are now required to consider hazard and end-of-life outcomes at the design stage — before a product enters pilot production. This moves green chemistry from a retrofit activity to a core engineering discipline, rewarding firms that build SSbD into early-stage R&D processes.
P2 Science’s PIOz platform commercialization demonstrates that bio-based process innovation for specialty ingredients is moving from lab scale to commercial production. More than 350,000 chemicals are registered for commercial use globally, with around 40,000 produced at high volumes, per Statspanda. This creates a vast substitution target market for green chemistry platforms that can replace hazardous inputs with bio-based alternatives at competitive cost points.
Continuous flow chemistry and biocatalytic processes are reducing waste and energy use per unit of chemical output compared to batch manufacturing. These technologies do not just support sustainability goals — they improve process economics in high-volume production. Producers adopting these methods gain a cost and compliance advantage simultaneously, which explains the accelerating uptake across pharma, specialty chemicals, and industrial intermediates.
Key Companies Insights
BASF SE is the world’s largest chemical producer, and its green chemistry strategy is built at genuine scale. In FY2025, sustainable-future solutions reached 48.5% of total BASF revenue — a number that signals portfolio transformation, not marketing positioning. BASF’s network of over 70,000 Tier-1 suppliers globally in 2024 gives it unmatched sourcing depth for bio-based inputs, enabling faster qualification of renewable feedstocks than most peers can match.
DuPont brings a materials science advantage to green chemistry, with bio-based polymers and specialty coatings embedded across multiple industrial end markets. Its strength lies in application engineering — helping customers integrate green chemistry inputs without reformulation risk. This service-led model creates switching costs that protect DuPont’s position even as bio-based supply becomes more commoditized over the forecast period.
Braskem is the leading producer of bio-based polyethylene globally, operating at commercial scale with sugarcane ethanol feedstock in Brazil. Its I’m green polyethylene product line is sold into packaging, consumer goods, and automotive markets — demonstrating that bio-based polymers can meet industrial specs at price points acceptable to large-volume buyers. Braskem’s feedstock proximity to Brazil’s agri-industrial base gives it a structural cost advantage in bio-polymer supply.
Archer Daniels Midland (ADM) connects agricultural feedstock supply to green chemistry production at industrial scale. Its grain processing, oilseed crushing, and fermentation capabilities give it an integrated position across the bio-based value chain that pure-play chemical producers cannot easily replicate. ADM’s ability to control feedstock cost and quality from field to fermenter makes it a preferred supply partner for producers scaling bio-based chemical output.
Key Companies
- BASF SE
- DuPont
- Braskem
- Archer Daniels Midland
- DSM
- Arkema
- Evonik Industries AG
- Toray Industries, Inc.
- Cargill, Incorporated
- PTT Global Chemical
- Corbion N.V.
- BioAmber, Inc.
- Novozymes A/S
- Amyris, Inc.
- SABIC
- POET, LLC
- Valero Energy Corporation
- Green Plains Inc
- Mitsubishi Chemical Group Corporation
- Others
Recent Development
- In December 2024, The US Federal government released the Federal Sustainable Chemistry Strategic Plan, coordinating R&D goals across EPA, DOE, and NSF to accelerate green chemistry from discovery to commercial adoption, reducing policy uncertainty for domestic producers.
- In 2024, Merck’s continuous manufacturing process for KEYTRUDA was awarded recognition for significantly cutting energy and water use in active pharmaceutical ingredient production. This confirmed biocatalytic and continuous flow methods as commercially viable at large pharma scale.
- In 2024, Dow and Beyond Benign expanded their collaboration to advance green chemistry curricula and industrial training programs across academic and corporate partners, building the workforce infrastructure required for broad sustainable chemistry adoption.
- In 2024, BASF SE reported that sustainable-future solutions contributed 48.5% of FY2025 total revenue, up from 46.3% in FY2024. This revenue shift confirms that green chemistry product lines are now core to the company’s commercial performance, not supplementary.
Market Scope
| Report Features | Description |
|---|---|
| Market Value (2025) | USD 133.40 Billion |
| Forecast Revenue (2035) | USD 525.76 Billion |
| CAGR (2026-2035) | 14.70% |
| Base Year for Estimation | 2025 |
| Historic Period | 2020-2024 |
| Forecast Period | 2026-2035 |
| Report Coverage | Revenue Forecast, Market Dynamics, Competitive Landscape, Recent Developments |
| Segments Covered | By Product Type (Biopolymers, Bio-alcohols, Bio-ketones, Bio-organic Acids, Platform Chemicals, Others), By Source (Plant-Based, Animal-Based, Microorganisms), By Application (Chemical, Paints and Coatings, Packaging, Textiles and Apparel, Personal Care and Cosmetics), By End-Use (Food and Beverages, Pharmaceuticals, Automotive and Transportation, Building and Construction, Electronics and Consumer Goods, Others) |
| Regional Analysis | North America (US and Canada), Europe (Germany, France, The UK, Spain, Italy, and Rest of Europe), Asia Pacific (China, Japan, South Korea, India, Australia, and Rest of APAC), Latin America (Brazil, Mexico, and Rest of Latin America), Middle East & Africa (GCC, South Africa, and Rest of MEA) |
| Competitive Landscape | BASF SE, DuPont, Braskem, Archer Daniels Midland, DSM, Arkema, Evonik Industries AG, Toray Industries Inc., Cargill Incorporated, PTT Global Chemical, Corbion N.V., BioAmber Inc., Novozymes A/S, Amyris Inc., SABIC, POET LLC, Valero Energy Corporation, Green Plains Inc, Mitsubishi Chemical Group Corporation, Others |
| Customization Scope | Customization for segments, region/country-level will be provided. Moreover, additional customization can be done based on the requirements. |
| Purchase Options | We have three licenses to opt for: Single User License, Multi-User License (Up to 5 Users), Corporate Use License (Unlimited User and Printable PDF) |
Sources
- OECD – Saving Costs in Chemicals Management
- OECD – Chemical Safety
- OECD iLibrary – Testing of Chemicals
- European Environment Agency – Production of Chemicals
- Reuters – Chemicals Industry Struggles to Kick Its Fossil Fuel Habit (2025)
- OECD – A Chemicals Perspective on Designing with Sustainable Plastics
- World Bank – Chemicals Value Added in Manufacturing, OECD
- Statspanda – Production of Man-Made Chemicals (Live Counter)
- BASF – Combined Management Report FY2024
- BASF – Annual Report FY2025
