What is the Electric Vehicle Market Size?
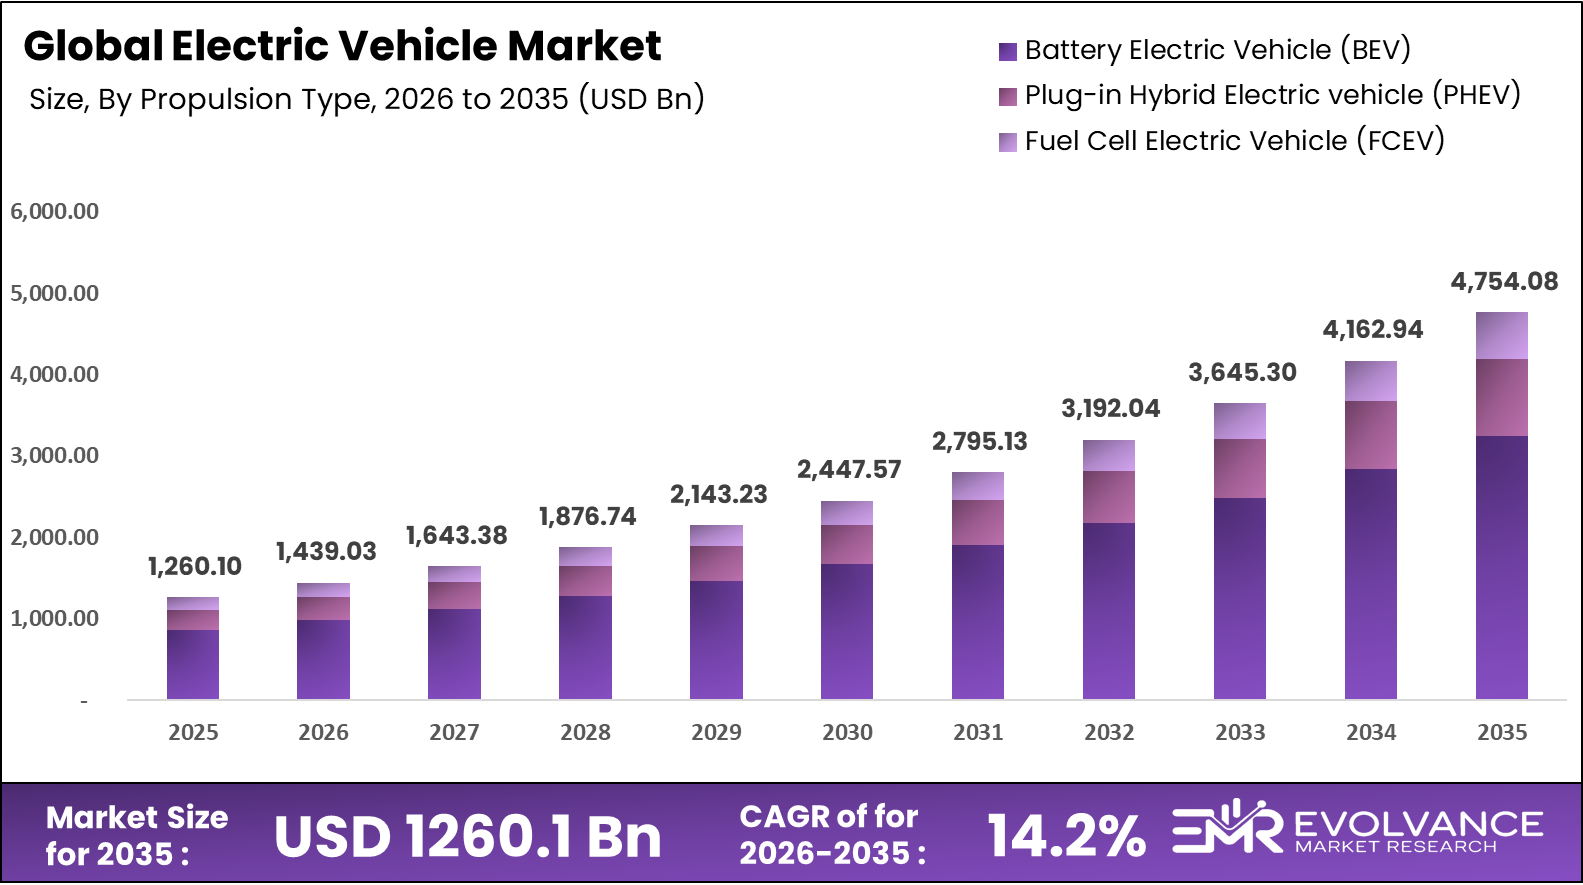
Global Electric Vehicle Market size is expected to be worth around USD 4754.08 Billion by 2035 from USD 1260.1 Billion in 2025, growing at a CAGR of 14.2% during the forecast period 2026 to 2035. Falling battery costs and expanded charging networks drive strong adoption across passenger cars and commercial fleets. Government zero-emission mandates and consumer demand for sustainable mobility further accelerate market expansion worldwide.
Market Highlights
- The Global Electric Vehicle Market to reach USD 4754.08 Billion by 2035 from USD 1260.1 Billion in 2025, growing at 14.2% CAGR
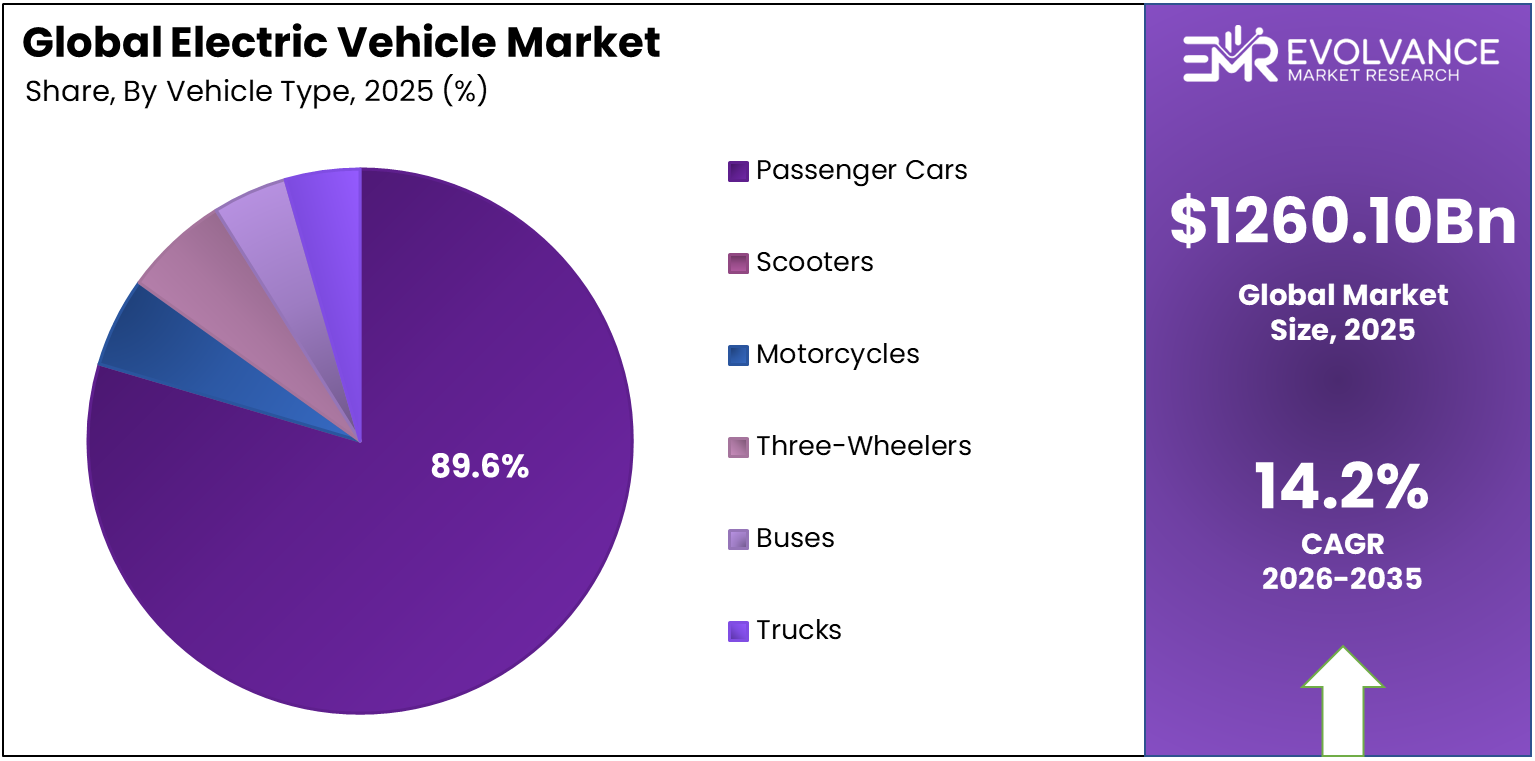
- Passenger Cars segment dominates vehicle type category with 89.6% market share in 2025
- Battery Electric Vehicles lead propulsion segment capturing 68.2% share driven by falling battery costs and infrastructure expansion
- Asia Pacific dominates regional market with 49.2% share, valued at USD 617.4 Billion in 2025
- Front-wheel Drive configuration accounts for 53.4% of market due to cost efficiency and packaging advantages
- Speed range of 100MPH to 125MPH captures 69.2% market share meeting highway capability requirements globally
- Low Priced vehicle class dominates with 49.6% share enabling mass market adoption and affordability targets
- Personal use segment leads end-use category with 90.1% share driven by consumer adoption patterns
Market Overview
Electric vehicles represent a major shift in global transport, powered by batteries or fuel cells instead of gas engines. These vehicles produce zero direct emissions and offer lower running costs compared to traditional cars. The market includes passenger cars, buses, trucks, motorcycles, scooters, and three-wheelers across personal and commercial segments.
Strong government support drives rapid EV adoption through tax breaks, purchase subsidies, and strict emission rules. Many countries now mandate automakers to sell a certain percentage of zero-emission vehicles each year. Infrastructure investment in charging stations removes a key barrier to consumer acceptance and enables long-distance travel confidence.
Battery technology improvements make EVs more affordable and practical for daily use across diverse applications. Lower lithium-ion costs and higher energy density extend driving range while reducing vehicle prices. Automakers invest heavily in dedicated EV platforms and in-house battery production to control supply chains and costs.
Consumer awareness about climate change and air quality pushes demand for clean transport options worldwide. Fleet operators recognize total cost savings from electric buses and delivery trucks despite higher upfront prices. Smart grid integration and vehicle-to-grid technology create new revenue streams for EV owners who sell stored energy.
According to EVInfo.net, global EV sales reached about 20.7 million units in 2025, up roughly 20% year-on-year. This growth reflects strong momentum in China, Europe, and emerging markets despite slower adoption in North America. China alone sold 12.9 million EVs in 2025, maintaining its position as the world’s largest market.
According to EVs and Beyond, Europe delivered 4.3 million EVs in 2025, showing 33% growth year-over-year. North America sold 1.8 million units but declined 4% due to policy uncertainty and slower infrastructure buildout. Rest of World markets surged 48% to 1.7 million units as emerging economies accelerate EV adoption.
According to Our World in Data, over 1-in-5 or 22% of new cars sold globally were electric in 2024. This penetration rate demonstrates mainstream acceptance and signals the tipping point toward mass market adoption. However, charging access remains a critical concern for potential buyers evaluating their first EV purchase.
According to HERE Technologies, 53% of drivers across the US and Europe cite lack of charging access as a top concern. This infrastructure gap slows adoption despite falling vehicle prices and improving range capabilities. According to WiFi Talents, 78% of EV owners report higher satisfaction than traditional car owners, with many linking satisfaction to charging convenience.
Vehicle Type Analysis
Passenger Cars dominate with 89.6% due to strong consumer demand and diverse model availability.
In 2025, Passenger Cars held a dominant market position in the By Vehicle Type segment of Electric Vehicle Market, with a 89.6% share. This dominance stems from automaker focus on consumer segments where margins are highest and brand loyalty strongest. Hundreds of EV models now compete across sedan, SUV, and hatchback categories at multiple price points. Urban commuters and families drive adoption through daily use patterns that match current charging infrastructure capabilities.
Scooters gain traction in dense Asian cities where low speeds and short trips suit compact battery packs. Two-wheeler EVs offer affordable entry points for first-time buyers and last-mile delivery services. Government subsidies in India and Southeast Asia accelerate market growth and local manufacturing investments. Swappable battery networks address charging concerns and enable commercial use by delivery riders and gig workers.
Motorcycles attract performance enthusiasts and premium buyers seeking electric power and instant torque delivery. High-end models from established brands compete with startups offering connected features and over-the-air updates. Range limitations restrict long-distance touring but urban and suburban riders find adequate performance. Battery costs remain high relative to vehicle price, limiting mass market penetration currently.
Three-Wheelers serve commercial passenger transport and cargo delivery in emerging markets across Asia and Africa. Low operating costs and simple mechanics make electric rickshaws economically attractive for small business owners. Battery swapping stations enable continuous operation without long charging downtime for commercial drivers. Government phase-outs of polluting two-stroke engines accelerate fleet conversion to electric powertrains.
Buses electrify rapidly in China and European cities pursuing zero-emission public transport goals and air quality targets. Fleet procurement programs favor EVs through total cost of ownership analysis over vehicle lifetimes. Depot charging overnight matches operational patterns while reducing noise in residential areas during early routes. Range anxiety proves less critical with fixed routes and predictable daily mileage requirements.
Trucks enter commercial markets through light-duty delivery vans and medium-duty distribution vehicles in urban settings. E-commerce growth and last-mile logistics drive demand for quiet, zero-emission delivery solutions in city centers. Heavy-duty long-haul applications remain challenged by battery weight, range limits, and charging infrastructure gaps. However, regional distribution and return-to-base operations show strong economics with lower fuel and maintenance costs.
Propulsion Type Analysis
Battery Electric Vehicles dominate with 68.2% due to falling costs and expanding charging networks.
In 2025, Battery Electric Vehicle (BEV) held a dominant market position in the By Propulsion Type segment of Electric Vehicle Market, with a 68.2% share. Pure battery power delivers the simplest design with fewer moving parts and lowest maintenance requirements. Charging infrastructure expansion makes BEVs practical for daily commuting and regional travel in developed markets. Battery costs below USD 100 per kilowatt-hour enable price parity with gas cars within years.
Plug-in Hybrid Electric Vehicles (PHEV) bridge the gap for buyers concerned about range and charging access limitations. Dual powertrains offer electric-only commuting with gas backup for long trips and areas without chargers. However, complexity adds cost and weight while regulatory pressure favors pure electric solutions over transitional technology. Market share declines as BEV ranges exceed 300 miles and charging anxiety fades among consumers.
Fuel Cell Electric Vehicles (FCEV) remain niche due to limited hydrogen infrastructure and high production costs for fuel systems. Long refueling times under five minutes and extended range appeal to commercial fleets and heavy-duty applications. Japan and Korea lead FCEV development but global adoption stays minimal without hydrogen distribution networks. Technology suits buses and trucks better than passenger cars where batteries prove more practical and economical.
Drive Type Analysis
Front-wheel Drive dominates with 53.4% due to cost efficiency and proven packaging advantages.
In 2025, Front-wheel Drive (FWD) held a dominant market position in the By Drive Type segment of Electric Vehicle Market, with a 53.4% share. FWD configurations cost less to engineer and build while maximizing interior space in compact vehicles. Single motor designs reduce weight and complexity compared to dual-motor all-wheel-drive systems and variants. Most mass-market EVs adopt FWD to hit affordable price targets under USD 30,000 globally.
Rear-wheel Drive (RWD) appeals to performance buyers and premium brands emphasizing driving dynamics and handling balance. RWD packaging allows larger batteries in floor space without front motor interference and packaging constraints. Luxury automakers position RWD EVs as sporty alternatives to traditional gas sports sedans and coupes. Market share remains limited to higher-priced segments where buyers pay premiums for performance characteristics.
All-wheel Drive (AWD) grows in SUVs and crossovers where buyers expect traction and capability in varied conditions. Dual motors deliver instant torque vectoring and superior acceleration compared to single-motor front or rear arrangements. However, added cost and weight reduce efficiency and range versus two-wheel-drive equivalents and configurations. Cold climate markets show higher AWD adoption rates driven by winter traction concerns and safety perceptions.
Vehicle Speed Analysis
100MPH to 125MPH dominates with 69.2% due to highway capability and safety standards.
In 2025, 100MPH to 125MPH held a dominant market position in the By Vehicle Speed segment of Electric Vehicle Market, with a 69.2% share. This range meets highway speed limits globally while balancing performance with energy efficiency and range. Most passenger EVs target this performance tier to match conventional car expectations and consumer comfort. Regulatory crash testing and insurance requirements favor vehicles capable of modern highway speeds safely.
Less Than 100 MPH vehicles serve urban markets and developing regions where speeds rarely exceed city limits. Low-speed EVs cost significantly less due to smaller batteries and simpler power electronics requirements. Neighborhood electric vehicles and city cars fit this category along with many three-wheelers and scooters. Limited range and speed restrict use to short local trips within residential and commercial districts.
Above 125 MPH performance EVs cater to luxury and sports car buyers seeking maximum acceleration and top speed. High-powered motors and battery packs enable supercar-level performance with instant torque from standstill. Premium pricing limits market size but generates brand halo effects and technology development benefits. Track-focused models demonstrate EV capabilities while mass-market buyers choose lower speed tiers for daily needs.
Vehicle Class Analysis
Low Priced vehicles dominate with 49.6% due to mass market focus and affordability targets.
In 2025, Low Priced held a dominant market position in the By Vehicle Class segment of Electric Vehicle Market, with a 49.6% share. Automakers prioritize affordable EVs to reach mainstream buyers and achieve volume production scale economies. Models under USD 30,000 drive mass adoption in price-sensitive markets across Asia, Latin America, and Europe. Government incentives push effective prices lower and match gas car ownership costs for budget-conscious families.
Mid-Price vehicles balance features, range, and cost for middle-class buyers upgrading from economy cars. This segment offers 250 to 350 mile ranges with advanced driver assistance and connected services. Competition intensifies as legacy automakers and new entrants fight for market share and brand positioning. Price points from USD 30,000 to USD 50,000 attract volume buyers seeking value and quality.
High Price luxury EVs deliver premium materials, performance, and technology at USD 75,000 and above price points. Early adopters and affluent buyers drive this segment despite limited volumes compared to mass market. Brands use high-end models to showcase capabilities and fund development of cheaper future variants. Margins remain highest in luxury segments while competition from established premium brands increases steadily each year.
End Use Analysis
Personal use dominates with 90.1% due to consumer adoption and daily commuting patterns.
In 2025, Personal held a dominant market position in the By End Use segment of Electric Vehicle Market, with a 90.1% share. Individual buyers drive market growth through replacement of gas cars with electric alternatives for commuting. Home charging convenience and lower fuel costs appeal to families and multi-car households. Tax credits and purchase incentives make EVs financially attractive for personal ownership versus leasing or commercial fleets.
Commercial fleet adoption accelerates in delivery, ride-hailing, and public transport sectors pursuing cost savings and sustainability. Companies recognize total ownership savings despite higher upfront vehicle prices compared to gas equivalents. Depot charging and predictable routes suit electric buses and delivery vans with overnight charging windows. Corporate sustainability goals and customer pressure drive fleet conversion timelines faster than individual consumer adoption rates.
Market Segments Covered in the Report
By Vehicle Type
- Passenger Cars
- Scooters
- Motorcycles
- Three-Wheelers
- Buses
- Trucks
By Propulsion Type
- Battery Electric Vehicle (BEV)
- Plug-in Hybrid Electric vehicle (PHEV)
- Fuel Cell Electric Vehicle (FCEV)
By Drive Type
- Front-wheel Drive (FWD)
- Rear-wheel Drive (RWD)
- All-wheel Drive (AWD)
By Vehicle Speed
- Less Than 100 MPH
- 100MPH to 125MPH
- Above 125 MPH
By Vehicle Class
- Low Priced
- Mid-Price
- High Price
By End Use
- Personal
- Commercial
Electric Vehicle Market Regional Insights
Asia Pacific Dominates the Electric Vehicle Market with a Market Share of 49.2%, Valued at USD 617.4 Billion
Asia Pacific leads global EV adoption with 49.2% market share, valued at USD 617.4 Billion, driven by China’s dominant position. China sold 12.9 million EVs in 2025, accounting for over 60% of global volumes through strong policy support. Japan, South Korea, India, and Australia contribute growth through local production and rising consumer acceptance. Extensive charging networks and battery production capacity give the region structural advantages over other markets worldwide.
North America Electric Vehicle Market Trends
North America sold 1.8 million EVs in 2025, showing a 4% decline year-over-year due to policy uncertainty. The US market faces challenges from reduced federal incentives and uneven state-level support programs. However, major automakers invest billions in EV production facilities and battery plants across the region. Canada shows stronger growth through provincial incentives while Mexico emerges as a key production hub for exports.
Europe Electric Vehicle Market Trends
Europe delivered 4.3 million EVs in 2025, growing 33% year-over-year through strict emission rules. Germany, France, and the UK lead adoption while Norway achieves near-total EV sales penetration. Charging infrastructure expands rapidly along highways and in urban areas to support growing fleets. EU regulations mandate automakers to meet carbon targets or face heavy fines and penalties.
Latin America Electric Vehicle Market Trends
Latin America shows early-stage adoption led by Brazil and Mexico through local production and import growth. Government incentives remain limited compared to developed markets but urban air quality concerns drive policy. Chinese automakers expand presence through competitive pricing and local assembly partnerships with regional manufacturers. Charging infrastructure lags behind demand but private investment accelerates in major metropolitan areas and corridors.
Middle East & Africa Electric Vehicle Market Trends
Middle East and Africa represent emerging markets with low current penetration but high growth potential. GCC countries invest in EVs as part of broader economic diversification away from oil dependency. South Africa leads the continent through local assembly and import channels serving affluent buyers. Infrastructure development remains the primary barrier to mass adoption across both regions and subregions.
Key Regions and Countries
North America
- US
- Canada
Europe
- Germany
- France
- The UK
- Spain
- Italy
- Rest of Europe
Asia Pacific
- China
- Japan
- South Korea
- India
- Australia
- Rest of APAC
Latin America
- Brazil
- Mexico
- Rest of Latin America
Middle East & Africa
- GCC
- South Africa
- Rest of MEA
Regulatory Landscape
Global EV regulations tighten between 2024 and 2026 as governments pursue carbon reduction targets and air quality goals. The European Union enforces strict CO2 limits requiring automakers to increase EV sales or pay penalties. California maintains its Advanced Clean Cars II rule mandating 100% zero-emission vehicle sales by 2035. China extends subsidy programs while raising technical standards for range, efficiency, and safety across all vehicle categories.
Safety regulations evolve to address EV-specific risks including battery fires, thermal runaway, and high-voltage electrical systems. Testing standards now cover battery crash protection, water intrusion resistance, and emergency response procedures for first responders. Charging infrastructure faces new building codes requiring outlets in parking structures and multi-family residential developments. Grid integration rules establish standards for bidirectional charging and vehicle-to-grid energy flows across utility networks.
Electric Vehicle Market Dynamics
Drivers
Government Zero-Emission Mandates and Rapid Battery Cost Declines Drive Market Growth
Government policies worldwide mandate automakers to sell specific percentages of zero-emission vehicles or face penalties. These rules create guaranteed demand and force manufacturers to invest in EV platforms and production. Tax credits and purchase subsidies lower effective vehicle prices for consumers and improve affordability. Emission zones in cities ban gas vehicles and accelerate fleet conversion to electric powertrains.
Lithium-ion battery costs fell below USD 100 per kilowatt-hour in 2024, enabling price parity with gas cars. Higher energy density extends driving range beyond 300 miles for most new models and reduces range anxiety. Economies of scale from gigafactories and improved chemistries drive ongoing cost reductions each year. Battery recycling programs recover materials and reduce dependence on mining for raw material supplies.
Charging infrastructure expands through private investment and government funding across highways and urban areas globally. Fast chargers reduce charge times to under 30 minutes for 80% capacity on latest vehicle models. Home charging convenience gives EV owners fuel cost savings of 50% to 70% versus gas cars. Network interoperability improves through standardized plugs and payment systems across competing charging providers and operators.
Restraints
Limited Charging Infrastructure and High Upfront Costs Limit Market Adoption
Rural and emerging regions lack adequate charging networks to support daily EV use and long trips. Apartment dwellers cannot install home chargers and rely on scarce public stations for vehicle charging. Across the US and Europe, 53% of drivers cite lack of charging access as their top concern. This infrastructure gap slows adoption despite falling vehicle prices and improving range capabilities in new models.
EVs cost USD 10,000 to USD 15,000 more than equivalent gas cars before incentives at current market prices. Battery packs represent 30% to 40% of total vehicle cost and limit manufacturer pricing flexibility. Budget-conscious buyers cannot afford higher upfront payments despite lower operating and fuel cost savings. Resale values remain uncertain as battery degradation and technology obsolescence concerns affect used market pricing dynamics.
Lithium, cobalt, and nickel supply chains face constraints from limited mining capacity and geopolitical concentration. China controls 80% of battery production and most raw material processing globally and capacity. Supply disruptions or export restrictions could limit global EV production and slow market growth. Ethical concerns about mining conditions and environmental impact create regulatory and reputational risks for automakers.
Growth Factors
Fleet Electrification and Smart Grid Integration Accelerate Market Expansion
Commercial fleets convert to EVs to reduce fuel costs and meet corporate sustainability targets. Delivery companies recognize total ownership savings despite higher upfront vehicle prices compared to gas equivalents. Public transport agencies replace diesel buses with electric models to improve urban air quality. Ride-hailing services adopt EVs to lower operating costs and appeal to environmentally conscious customers.
Vehicle-to-grid technology allows EVs to store renewable energy and sell power back to utilities. Smart charging systems optimize battery charging during low-demand periods with cheap electricity rates available. Grid operators value distributed battery storage for peak shaving and frequency regulation services and stability. EV owners generate new revenue streams while supporting renewable energy integration into power grids.
Emerging markets in Asia, Africa, and Latin America represent huge growth potential for affordable EVs. Local production and assembly reduce import costs while creating jobs and building domestic supply chains. Government incentives target two-wheelers and three-wheelers where electrification economics prove most compelling currently. Rising middle-class incomes and environmental awareness drive first-time car buyers toward electric vehicles and options.
Emerging Trends
Software-Defined Vehicles and In-House Battery Production Reshape Market Landscape
Automakers invest in software capabilities to deliver over-the-air updates and new features throughout vehicle lifespans. Digital cockpits and autonomous driving functions differentiate brands beyond traditional hardware and performance specifications. Subscription services for heated seats, performance upgrades, and advanced driver assistance create recurring revenue streams. User experience and interface design become as important as mechanical engineering in product development priorities.
Major manufacturers build their own battery production facilities to control costs and secure supply chains. Vertical integration reduces dependence on external suppliers and captures margin across value chain components. In-house battery development enables custom designs optimized for specific vehicle platforms and use cases. Technology partnerships with battery chemists and equipment makers accelerate innovation cycles and performance improvements continuously.
Electric SUVs and pickup trucks enter mass markets as battery costs fall and range increases. American and European buyers demand larger vehicles that previously lacked viable electric alternatives and options. Automakers launch electric versions of bestselling truck models to protect market share and brand positions. Performance capabilities match or exceed gas equivalents while offering lower operating costs and instant torque.
Electric Vehicle Market Key Companies Insights
Tesla maintains market leadership through vertical integration, software capabilities, and charging network advantages across global markets. The company operates proprietary Supercharger stations providing reliable fast charging exclusively for Tesla owners worldwide. Direct sales and over-the-air updates create strong customer loyalty and high satisfaction ratings. Production capacity expands through gigafactories in Texas, Germany, and China to meet growing demand globally.
BYD dominates the Chinese market through vertical integration spanning batteries, motors, and complete vehicle production. The company supplies batteries to competitors while producing affordable EVs across passenger and commercial segments. In January 2025, BYD announced plans to expand European production with a new factory. Global expansion targets emerging markets where price-competitive models appeal to first-time buyers seeking affordability.
Volkswagen Group invests over USD 100 billion in EV development and battery production through 2030. Multiple brands including Audi, Porsche, and VW use shared MEB platform to achieve economies. European sales leadership comes from strong dealer networks and brand recognition across key markets. Software challenges delayed some launches but the company accelerates digital transformation to compete with tech-focused rivals.
General Motors commits to all-electric future with plans to phase out gas vehicles by 2035. Ultium battery platform underpins vehicles from Chevrolet, GMC, and Cadillac across price segments globally. North American production capacity expands through new battery plants and assembly facilities in multiple states. Joint ventures with LG Energy Solution secure battery supply while reducing dependence on external suppliers.
Key Companies
- Tesla
- BYD
- Volkswagen Group
- General Motors
- Ford Motor Company
- Stellantis
- Hyundai Motor Group
- BMW Group
- Mercedes-Benz Group
- Nissan Motor Corporation
- Toyota Motor Corporation
- Rivian
- Lucid Motors
- NIO
- XPeng
- Li Auto
Recent Development
- January 2026 – Life Electric Vehicles Holdings Inc. acquired Rad Power Bikes’ assets for USD 13.2 million after outbidding four companies during Chapter 11 bankruptcy auction proceedings. The acquisition expands Life Electric’s e-bike portfolio and manufacturing capacity in the growing micro-mobility segment.
- July 2025 – Geely Automobile Holdings Limited entered a merger agreement to take EV unit Zeekr private at USD 6.83 billion valuation. The transaction consolidates ownership and enables tighter integration with Geely’s broader automotive operations and technology platforms.
- September 2025 – Zeekr Group shareholders approved the merger agreement with Geely, authorizing full acquisition and ownership consolidation. Zeekr becomes a wholly-owned Geely subsidiary, streamlining decision-making and accelerating product development cycles significantly.
- December 2025 – Foxtron Vehicle Technologies acquired 100% ownership of Luxgen Motor Co., including EV brand and intellectual property assets. The Foxconn-Yulon joint venture expands manufacturing reach and market presence across Taiwan’s automotive sector.
- December 2024 – WeaveGrid raised USD 28 million in strategic funding led by Toyota’s Woven Capital to scale EV-grid integration software. The platform optimizes charging schedules to reduce grid stress and lower electricity costs for consumers.
- October 2024 – Paren secured USD 3 million in seed funding and completed acquisition of EVAdoption to enhance mobility data capabilities. The combined platform provides comprehensive market intelligence and analytics for automotive industry stakeholders globally.
- January 2025 – Los Angeles-based Harbinger secured USD 100 million in Series B funding to accelerate medium-duty EV production. The startup targets commercial fleet customers seeking electric alternatives to traditional diesel delivery trucks.
Market Scope
| Report Features | Description |
|---|---|
| Market Value (2025) | USD 1260.1 Billion |
| Forecast Revenue (2035) | USD 4754.08 Billion |
| CAGR (2026-2035) | 14.2% |
| Base Year for Estimation | 2025 |
| Historic Period | 2020-2024 |
| Forecast Period | 2026-2035 |
| Report Coverage | Revenue Forecast, Market Dynamics, Competitive Landscape, Recent Developments |
| Segments Covered | By Vehicle Type (Passenger Cars, Scooters, Motorcycles, Three-Wheelers, Buses, Trucks), By Propulsion Type (Battery Electric Vehicle, Plug-in Hybrid Electric vehicle, Fuel Cell Electric Vehicle), By Drive Type (Front-wheel Drive, Rear-wheel Drive, All-wheel Drive), By Vehicle Speed (Less Than 100 MPH, 100MPH to 125MPH, Above 125 MPH), By Vehicle Class (Low Priced, Mid-Price, High Price), By End Use (Personal, Commercial) |
| Regional Analysis | North America (US and Canada), Europe (Germany, France, The UK, Spain, Italy, and Rest of Europe), Asia Pacific (China, Japan, South Korea, India, Australia, and Rest of APAC), Latin America (Brazil, Mexico, and Rest of Latin America), Middle East & Africa (GCC, South Africa, and Rest of MEA) |
| Competitive Landscape | Tesla, BYD, Volkswagen Group, General Motors, Ford Motor Company, Stellantis, Hyundai Motor Group, BMW Group, Mercedes-Benz Group, Nissan Motor Corporation, Toyota Motor Corporation, Rivian, Lucid Motors, NIO, XPeng, Li Auto |
| Customization Scope | Customization for segments, region/country-level will be provided. Moreover, additional customization can be done based on the requirements. |
| Purchase Options | We have three licenses to opt for: Single User License, Multi-User License (Up to 5 Users), Corporate Use License (Unlimited User and Printable PDF) |