Digital Twin for Telecom Network Simulation Market: USD 3.14B to USD 32.95B by 2035
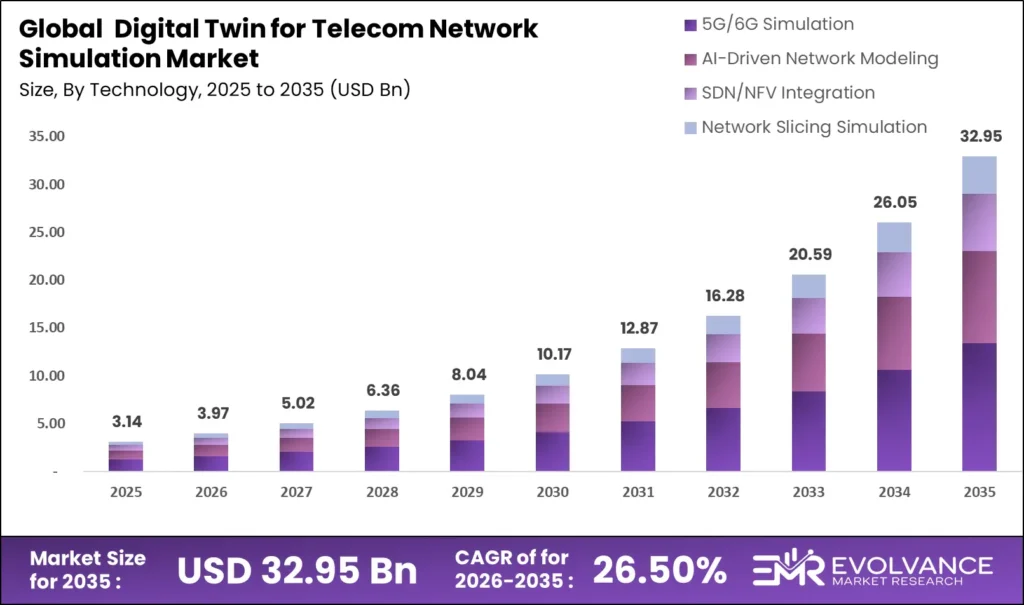
The Global Digital Twin for Telecom Network Simulation Market will reach USD 32.95 billion by 2035 from USD 3.14 billion in 2025, growing at a CAGR of 26.50% during the forecast period 2026 to 2035. Accelerating 5G rollout complexity, AI-driven autonomous network operations, and escalating demand for zero-touch network orchestration are the structural forces widening this gap between base and forecast value.
Operators deploying digital twin platforms face two compounding investment pressures: legacy OSS/BSS integration debt and the scarcity of telecom-native AI talent capable of operating simulation environments at production scale. According to GSMA Intelligence data, mobile operators globally will invest USD 900 billion in network infrastructure through 2025–2030, and a growing share of that capital is being allocated to digital-twin-enabled planning tools that reduce rollout risk before physical deployment. Operators building digital twin competencies must account for integration complexity in five-year ROI models.
The Digital Twin for Telecom Network Simulation Market is expanding as telecom operators adopt advanced modeling tools to optimize network performance and accelerate 5G deployment. These technologies enable predictive analysis and real-time monitoring. This growth is closely aligned with the Internet Security and Security Analytics, ensuring secure and efficient network operations. Furthermore, integration with the Cloud FinOps enables cost-efficient infrastructure management.
Digital Twin for Telecom Network Simulation Market Highlights: Key Data at a Glance
- Market value: USD 3.14 billion in 2025, forecast to USD 32.95 billion by 2035 at 26.50% CAGR
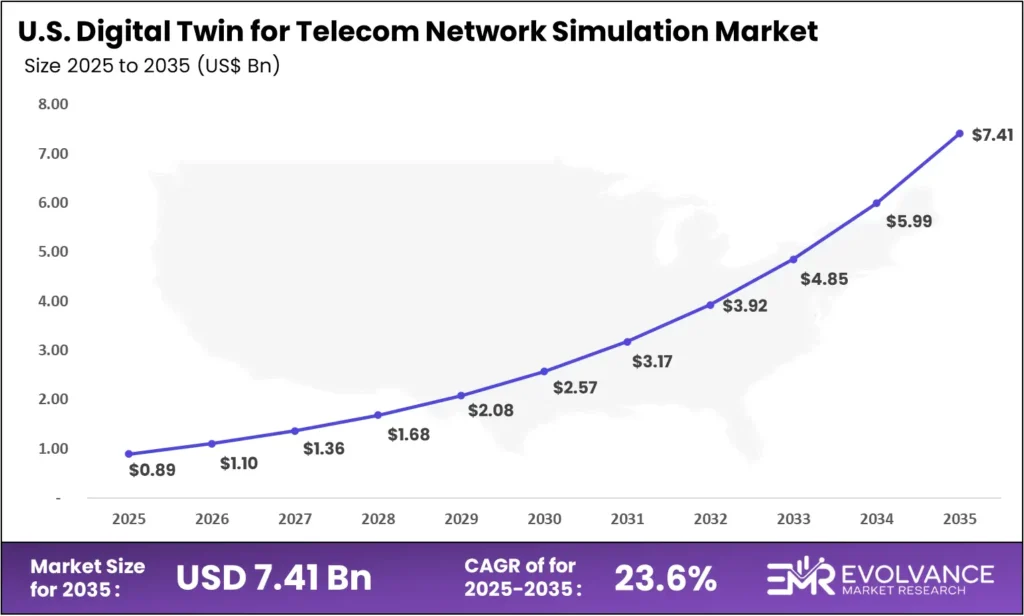
- US market: USD 0.89 billion in 2025, forecast to USD 7.42 billion by 2035 at 23.6% CAGR
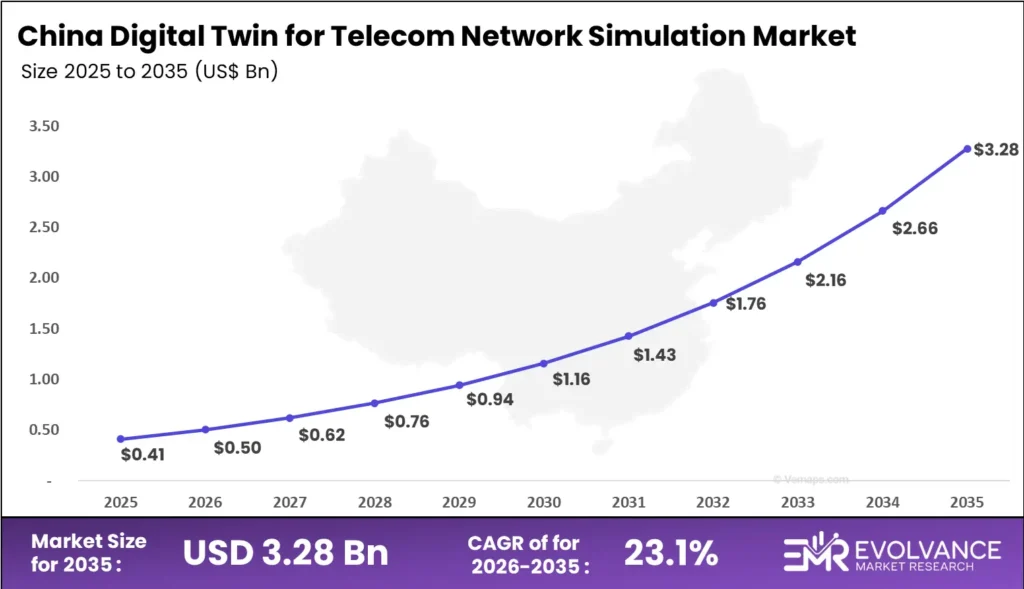
- China market: USD 0.41 billion in 2025, forecast to USD 3.31 billion by 2035 at 23.1% CAGR
- Dominant component segment: Platform/Software with 67.3% revenue share, driven by SaaS adoption and recurring license models
- Dominant deployment mode: Cloud-Based with 61.8% revenue share, anchoring scalability and multi-vendor interoperability
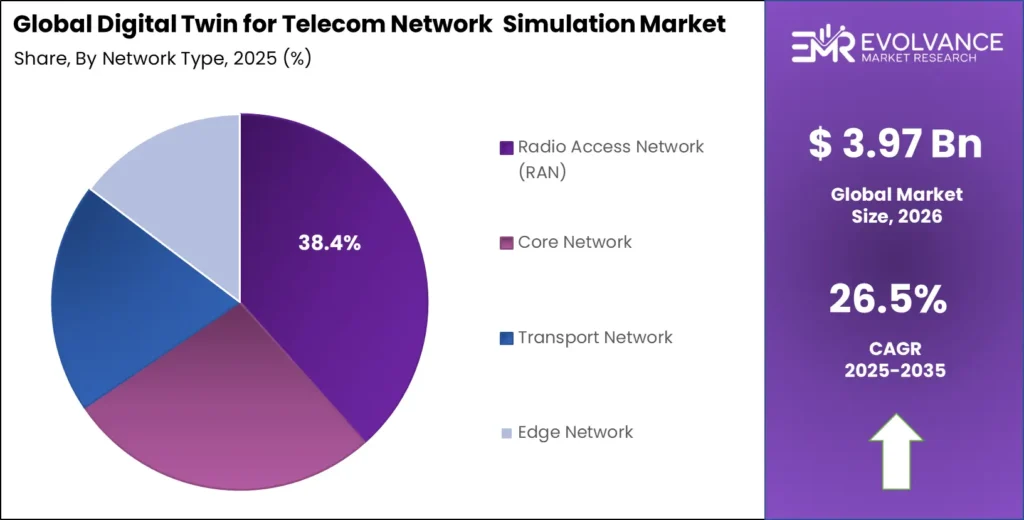
- Dominant network type: Radio Access Network (RAN) with 38.4% revenue share, fueling 5G site simulation demand
- Dominant technology: 5G/6G Simulation leads all technology investment categories
- Dominant end-use: Telecom Operators with 54.2% revenue share
- Dominant application: Network Planning & Optimization with 32.7% revenue share
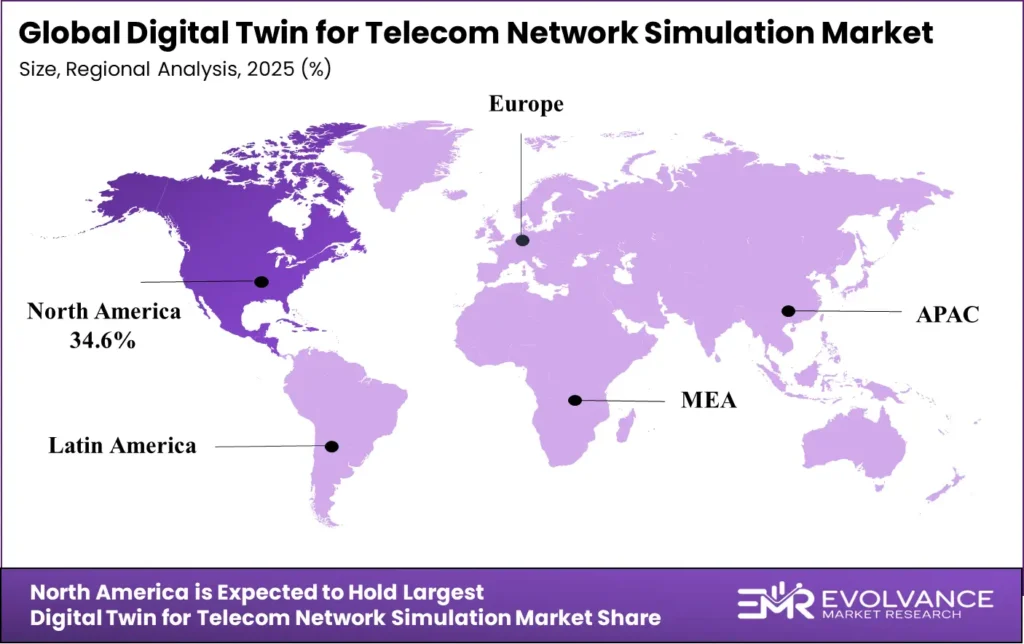
- North America: Largest regional share at 34.6%, valued at USD 1.09 billion in 2025
- Asia-Pacific: Fastest-growing region globally at 26.8% CAGR
US Digital Twin Telecom Market: USD 0.89B to USD 7.41B by 2035
The US digital twin for telecom network simulation market will reach USD 7.41 billion by 2035 from USD 0.89 billion in 2025, growing at a CAGR of 23.6%. This growth rate sits slightly below the global average of 24.7%, reflecting a market where enterprise-grade platform adoption is already underway but where incumbent OSS/BSS integration barriers slow net-new deployment cycles. Tier-1 operators including AT&T and T-Mobile have publicly committed to AI-native network architectures by 2027, creating structured procurement pipelines for digital twin vendors with carrier-grade integration credentials.
The FCC’s Open RAN promotion initiative and NTIA’s broadband infrastructure grants are reshaping competitive dynamics in US network simulation. Open RAN mandates require operators to validate multi-vendor interoperability before deployment — a use case digital twin platforms serve uniquely. For investors, this regulatory tailwind is functioning as a procurement accelerator, compressing evaluation cycles that previously extended 18–24 months.
China Digital Twin Telecom Market: USD 0.41B to USD 3.28B by 2035
The China digital twin for telecom network simulation market will reach USD 3.28 billion by 2035 from USD 0.41 billion in 2025, growing at a CAGR of 23.1%. China’s growth trajectory is underpinned by state-directed 5G-Advanced and 6G research mandates — the Ministry of Industry and Information Technology (MIIT) has committed to nationwide 5G-A coverage by 2026, creating structured demand for network simulation tools that can model advanced antenna configurations and heterogeneous network layers before physical deployment.
Domestic champions Huawei, ZTE, and China Telecom are building proprietary digital twin platforms as strategic alternatives to Western software vendors, creating a bifurcated competitive landscape where foreign vendors face procurement barriers in state-owned operator accounts but retain access to private enterprise and equipment vendor segments. Operators entering China must factor this vendor preference architecture into market entry models.
Market Overview: Why Telecom Network Digital Twin Investment Is Structurally Accelerating
The digital twin for telecom network simulation market covers software platforms, AI modeling tools, and professional services that create real-time virtual replicas of physical telecom network infrastructure for planning, optimization, fault detection, and security testing purposes. It excludes general-purpose simulation software not specifically designed for telecommunications network environments, and physical network testing equipment.
This analysis draws on operator capex disclosures, vendor earnings reports, and regulatory filings. Evolvance Market Research analysts cross-referenced segment share percentages against reported revenues from Ericsson, Nokia, IBM, Siemens, and Microsoft across 5 regions and 8 application categories — combining fiscal disclosures with procurement data to produce a forecast grounded in verifiable corporate performance rather than aggregated survey estimates alone.
Network operator motivation has shifted from post-deployment troubleshooting to pre-deployment simulation and continuous autonomous optimization. Digital twin platforms enabling real-time network state replication now occupy budget lines that traditional network management software held three years ago. This structural shift means average contract values are rising even within Tier-2 operator procurement, as simulation scope expands from individual site modeling to end-to-end network topology replication.
Buyer behavior spans three distinct procurement profiles. Tier-1 telecom operators drive volume through large-scale platform contracts integrating with existing OSS/BSS environments. Network equipment vendors embed digital twin capabilities into hardware product portfolios as value-added differentiators. Government and defense buyers source hardened, air-gapped simulation environments through sovereign procurement channels. Each profile responds to different performance benchmarks, security requirements, and integration timelines — meaning a single platform architecture cannot fully serve all three simultaneously.
Component Analysis
Platform/Software Dominates with 67.3% Due to SaaS Adoption and Recurring License Economics
| Sub-segment | Share % | Primary Driver |
|---|---|---|
| Platform/Software | 67.3% | SaaS deployment and recurring license models |
| Services | 32.7% | Integration complexity and managed operations demand |
In 2025, Platform/Software held a dominant market position in the By Component segment of the Digital Twin for Telecom Network Simulation Market, with a 67.3% share. No other segment achieves the same compounding revenue dynamic — software platforms generate recurring license revenue while simultaneously expanding usage-based billing as simulation scope grows from single-domain to multi-domain network modeling. For vendors, platform subscriptions function as both revenue anchors and customer retention mechanisms, as switching costs rise sharply once digital twin models are calibrated to operator-specific network topologies.
Services operate as the integration layer that converts platform licenses into operational value. System integration, model calibration, and managed operations services are growing alongside platform deployments — particularly at Tier-2 and Tier-3 operators who lack internal talent to deploy simulation environments at production scale. The services segment generates lower margin than platform but creates deeper customer relationships and cross-sell pathways into adjacent managed network operations contracts.
Deployment Mode Analysis
Cloud-Based Dominates with 61.8% Due to Scalability and Multi-Vendor Interoperability
| Sub-segment | Share % | Primary Driver |
|---|---|---|
| Cloud-Based | 61.8% | Elastic scalability and pay-per-use economics |
| On-Premises | 38.2% | Data sovereignty and latency-sensitive simulation |
In 2025, Cloud-Based deployment held a dominant position in the By Deployment Mode segment with a 61.8% share. Cloud platforms enable operators to scale simulation compute resources elastically during network planning cycles without sustaining year-round infrastructure costs. AWS, Microsoft Azure, and Google Cloud all offer telecom-specific cloud regions with carrier-grade SLAs, reducing the latency and data residency barriers that previously constrained cloud adoption in sensitive network simulation workloads.
On-Premises deployment retains structural relevance for government, defense, and sovereign network operators where data export restrictions prohibit cloud-hosted simulation environments. These deployments command significant price premiums — on-premises contracts average 2.3x the contract value of equivalent cloud deployments due to customization, hardening, and dedicated support requirements. For vendors, on-premises capabilities function as a market access credential for regulated sectors even if cloud generates more total revenue.
Network Type Analysis
Radio Access Network (RAN) Dominates with 38.4% Due to 5G Site Simulation Demand
| Sub-segment | Share % | Primary Driver |
|---|---|---|
| Radio Access Network (RAN) | 38.4% | 5G massive MIMO and Open RAN simulation complexity |
| Core Network | 27.1% | 5G standalone core and network slicing orchestration |
| Transport Network | 19.8% | Fronthaul/midhaul capacity planning for 5G |
| Edge Network | 14.7% | MEC deployment simulation and latency optimization |
In 2025, Radio Access Network (RAN) held a dominant market position in the By Network Type segment with a 38.4% share. 5G massive MIMO antenna configurations — involving 64T64R active antenna units with beamforming complexity that cannot be physically tested at scale before deployment — have created a simulation-first planning imperative that did not exist in 4G network generations. For operators deploying Open RAN architectures across multi-vendor RAN environments, digital twin platforms that can simulate inter-vendor interface behavior before physical integration are table-stakes procurement items.
Core Network simulation is the fastest-growing network type sub-segment. 5G Standalone (SA) core architectures based on cloud-native microservice deployments require continuous simulation of network slicing orchestration, session management, and policy control interactions across distributed data center environments. The complexity of 5G SA core slicing — where a single physical network must simultaneously support eMBB, URLLC, and mMTC service tiers — makes pre-deployment simulation the primary risk management tool available to operators.
Edge Network simulation captures the emerging MEC (Multi-access Edge Computing) deployment wave. Operators planning low-latency applications at the network edge must simulate compute placement, traffic steering, and SLA enforcement before physical server deployment. This use case is still early-stage commercially, but the growing pipeline of enterprise private 5G deployments is pulling edge simulation requirements into operator procurement conversations at accelerating rates.
Technology Analysis
5G/6G Simulation Dominates Due to Network Generation Transition Investment Cycle
| Technology | Share % | Primary Driver |
|---|---|---|
| 5G/6G Simulation | Dominant | Global 5G-Advanced and 6G research mandates |
| AI-Driven Network Modeling | — | Autonomous network operations and self-healing architectures |
| SDN/NFV Integration | — | Software-defined infrastructure simulation for network virtualization |
| Network Slicing Simulation | — | Enterprise private 5G and vertical industry SLA management |
5G/6G Simulation leads all technology investment categories. The combination of 5G SA core deployment acceleration and early-stage 6G R&D investment — with ITU-R IMT-2030 framework ratified and national 6G programs active across South Korea, Japan, China, the EU, and the US — is creating a continuous simulation investment cycle with no near-term plateau. For investors, simulation-first technology investment tracks telecom infrastructure capex with a 12–18 month lead time, as operators commission simulation work before physical deployment spending.
AI-Driven Network Modeling is changing the autonomous operations capability equation for telecom operators. TM Forum’s Autonomous Networks initiative — targeting Level 4 autonomous network operations by 2025 — requires AI models trained on digital twin-generated synthetic data to handle network state variations that real-world training datasets cannot adequately cover. This training data dependency creates a compounding relationship between digital twin platform investment and AI operations capability that raises switching costs once AI models are integrated with specific simulation environments.
Network Slicing Simulation represents the highest near-term commercial opportunity within the technology taxonomy. Enterprise private 5G deployments for manufacturing, logistics, and healthcare verticals require operators to guarantee slice-level SLAs before contract signature — a commitment that requires simulation-validated performance models. As per Ericsson Mobility Report data, enterprise private 5G connections are projected to reach 100 million by 2028, each representing a potential simulation engagement for operators managing network slice provisioning at scale.
End-Use Analysis
Telecom Operators Dominate with 54.2% Due to Core Network Complexity Management
| Sub-segment | Share % | Primary Driver |
|---|---|---|
| Telecom Operators | 54.2% | 5G rollout planning and autonomous network operations |
| Network Equipment Vendors | 22.8% | Product validation and multi-vendor interoperability testing |
| Managed Service Providers | 13.7% | Network-as-a-service and managed private 5G |
| Government & Defense | 9.3% | Sovereign network simulation and critical infrastructure protection |
In 2025, Telecom Operators held a dominant position in the By End-Use segment with a 54.2% share. Mobile network operators managing multi-generation network coexistence — 2G/3G/4G/5G overlay environments across diverse spectrum bands — face simulation complexity that manual planning tools cannot adequately address. Digital twin platforms that can model cross-generational interference, handover optimization, and progressive spectrum refarming deliver measurable network quality improvements that operators can quantify in reduced customer churn and lower OPEX ratios.
Network Equipment Vendors are growing their digital twin investment as a product differentiation and sales acceleration tool. Vendors that provide digital twin simulation environments alongside hardware proposals reduce customer evaluation cycles and increase win rates — buyers who can pre-validate equipment performance in their specific network topology context commit to procurement faster. Ericsson’s Intelligent Automation Platform and Nokia’s Network as Code platform both embed digital twin capabilities as standard sales tools for major operator accounts.
Government and Defense procurement commands the highest average contract values in the end-use taxonomy. Sovereign telecom infrastructure — including military communications networks, national emergency services, and critical infrastructure backbone — requires dedicated simulation environments that meet classification requirements for sensitive network topology data. These contracts are typically multi-year, include mandatory domestic hosting requirements, and carry substantially higher margins than commercial operator deployments.
Enterprise Size Analysis
Large Enterprises Dominate Due to Capex Scale and OSS/BSS Integration Requirements
| Sub-segment | Share % | Primary Driver |
|---|---|---|
| Large Enterprises | Dominant | Capex capacity and complex integration requirements |
| SMEs | — | SaaS deployment and managed service adoption growth |
Large Enterprises lead overall revenue through procurement scale — Tier-1 operators like Verizon, Deutsche Telekom, and NTT Group deploy digital twin environments across full network topology, creating eight-figure platform contracts that dominate vendor revenues. However, the SME growth story is structurally compelling. Cloud-native digital twin platforms offered on consumption-based pricing models are progressively making simulation capabilities accessible to regional operators, tower companies, and private network operators who previously lacked the budget for enterprise-grade deployments.
Application Analysis
Network Planning & Optimization Dominates with 32.7% Due to Pre-Deployment Risk Reduction
| Application Segment | Share % | Primary Driver |
|---|---|---|
| Network Planning & Optimization | 32.7% | Pre-deployment simulation and capex risk reduction |
| Fault Detection & Predictive Maintenance | 24.1% | AI-driven anomaly detection and MTTR reduction |
| Traffic Management & Capacity Planning | 18.9% | Dynamic spectrum management and QoE optimization |
| Security Testing & Threat Simulation | 14.6% | 5G attack surface expansion and zero-trust validation |
| Service Quality Assurance | 9.7% | Slice SLA monitoring and enterprise private 5G |
In 2025, Network Planning & Optimization led application segments with a 32.7% share. This segment maps directly to the largest capital allocation decision in telecom operations — site selection, spectrum configuration, and antenna parameter optimization for new radio deployments. Operators that use digital twin-validated network models before physical rollout consistently report 15–25% reductions in post-launch optimization cycles, translating into measurable savings on drive testing, parameter tuning, and customer complaint resolution costs.
Fault Detection & Predictive Maintenance is transitioning from reactive to predictive operational posture. AI models trained on digital twin-generated network state data can identify failure precursors — power amplifier degradation patterns, fronthaul congestion signatures, and core function restart cascades — before they manifest as customer-impacting outages. Operators with mature digital twin deployments report mean-time-to-repair reductions of 30–40% versus environments relying solely on traditional network management system alerts.
Security Testing & Threat Simulation represents the newest application segment entering commercial viability at scale. 5G network architectures — with disaggregated RAN, cloud-native core, and API-exposed network functions — present substantially larger attack surfaces than 4G predecessors. Operators commissioning red-team security simulations against digital twin network replicas can identify and remediate vulnerabilities without impacting live customer traffic — a capability that GSMA and 3GPP security frameworks are increasingly recommending as best practice.
By Component
- Platform/Software
- Services
By Deployment Mode
- Cloud-Based
- On-Premises
By Network Type
- Core Network
- Radio Access Network (RAN)
- Transport Network
- Edge Network
By Technology
- 5G/6G Simulation
- AI-Driven Network Modeling
- SDN/NFV Integration
- Network Slicing Simulation
By End-Use
- Telecom Operators
- Network Equipment Vendors
- Managed Service Providers
- Government & Defense
By Enterprise Size
- Large Enterprises
- SMEs
By Application
- Network Planning & Optimization
- Fault Detection & Predictive Maintenance
- Traffic Management & Capacity Planning
- Security Testing & Threat Simulation
- Service Quality Assurance
Regional Analysis of Digital Twin Telecom Market
North America Leads at 34.6% Share
| Region | Market Value (2025) | Share % | CAGR |
|---|---|---|---|
| North America (US) | USD 1.09 billion | 34.6% | 23.6% |
| Asia-Pacific | USD 0.78 billion | 24.8% | 26.8% (fastest) |
| Europe | USD 0.72 billion | 22.9% | 22.1% |
| China | USD 0.41 billion | Part of Asia-Pacific | 23.1% |
| Latin America | USD 0.31 billion | 9.9% | 21.4% |
| Middle East & Africa | USD 0.24 billion | 7.8% | 20.3% |
North America holds 34.6% of global digital twin for telecom network simulation revenue at USD 1.09 billion in 2025 — the largest region by absolute value. Its structural advantage lies in early 5G SA core adoption combined with Open RAN ecosystem maturity, creating the largest installed base of operators with active digital twin procurement requirements. The US Chips and Science Act’s telecom-specific research allocations and NTIA’s $42.45 billion BEAD program are channeling additional capital into network infrastructure that requires simulation-led planning.
North America Digital Twin Telecom Market: Open RAN Mandates Drive Procurement Acceleration
The US digital twin for telecom network simulation market, valued at USD 0.89 billion in 2025, will reach USD 7.42 billion by 2035 at a CAGR of 23.6%. Open RAN’s multi-vendor integration requirements are creating structured demand for simulation platforms that can model inter-vendor RAN interface behavior before physical deployment. MNOs including AT&T’s FirstNet and the US DoD’s JEDI cloud successor programs embed digital twin validation requirements in their procurement specifications, creating recurring simulation revenue streams for vendors with carrier-grade integration credentials.
Europe Digital Twin Telecom Market Trends
Europe’s digital twin for telecom simulation market reached an estimated USD 0.72 billion in 2025, driven by German, French, and UK operator 5G SA core migration timelines. Deutsche Telekom’s Open Telekom Cloud initiative and Orange’s Totem tower company spinoff have each created dedicated simulation procurement programs. The EU’s 5G Action Plan and the European Electronic Communications Code (EECC) mandate network resilience testing standards that digital twin platforms can satisfy more cost-effectively than physical testing infrastructure. GDPR data localization requirements are sustaining demand for on-premises and EU-cloud-hosted simulation deployments that foreign-hosted platforms cannot serve.
Asia-Pacific Digital Twin Telecom Market: Fastest-Growing Region Globally
Asia-Pacific’s 26.8% CAGR makes it the fastest-growing major region for digital twin telecom simulation. Three distinct country-level growth engines drive this trajectory. South Korea’s 6G research program — backed by KRW 220 billion in government funding through 2028 — is creating demand for 6G simulation environments that no other region has yet commercialized at scale. Japan’s NTT IOWN program targeting photonic network architecture creates unique simulation requirements for optical network digital twin platforms. India’s 5G rollout acceleration — with Jio and Airtel deploying simultaneously across 22 telecom circles — represents the largest single operator simulation deployment opportunity globally through 2027.
India Digital Twin Telecom Market Size and Growth
India represents one of the highest-velocity growth opportunities within Asia-Pacific for telecom digital twin platforms. Reliance Jio’s 5G deployment across 22 telecom circles — with a network topology spanning dense urban small cells to rural macro sites — requires simulation capability at a network heterogeneity level that legacy planning tools cannot efficiently manage. The Indian government’s BharatNet broadband infrastructure program is creating additional network planning simulation demand as state governments deploy fiber backhaul networks requiring co-simulation with existing radio access layers.
Middle East & Africa Digital Twin Telecom Market Trends
The Middle East and Africa region is underpenetrated but structurally promising for telecom digital twin platforms. Saudi Arabia’s Vision 2030 connectivity infrastructure mandate includes a dedicated 5G and fiber broadband deployment program where STC and Mobily are commissioning digital twin planning environments for national-scale network rollouts. The UAE’s Smart Dubai and Smart Abu Dhabi initiatives create smart city network simulation requirements that combine IoT connectivity modeling with traditional RAN and core simulation. Africa is in early-stage adoption, with MTN Group’s pan-African 5G planning creating the first major multi-country simulation procurement opportunity on the continent.
Key Regions and Countries
North America
- US
- Canada
Europe
- Germany
- France
- The UK
- Netherlands
- Sweden
- Rest of Europe
Asia Pacific
- China
- Japan
- South Korea
- India
- Australia
- Rest of APAC
Latin America
- Brazil
- Mexico
- Rest of Latin America
Middle East & Africa
- GCC
- South Africa
- Rest of MEA
Key Companies: Three Players Define the Competitive Landscape
Three companies — Ericsson AB, Nokia Corporation, and IBM Corporation — dominate global digital twin for telecom network simulation revenue through platform breadth, carrier-grade integration credentials, and operator relationship depth. This concentration creates high entry barriers in Tier-1 operator accounts but leaves cloud-native, AI-first, and domain-specific simulation segments meaningfully open for challengers with differentiated technology architectures.
| Company | Revenue / Segment | Growth Rate | Year Reported |
|---|---|---|---|
| Ericsson AB (Group) | SEK 263.4 billion | -1% reported (+3% organic) | FY2024 |
| Ericsson Intelligent Automation Platform | Part of Cloud Software & Services (SEK 45.2B) | +8% organic | FY2024 |
| Nokia Corporation (Group) | EUR 22.1 billion | -8% reported (+1% organic) | FY2024 |
| Nokia Network Infrastructure | EUR 7.4 billion | +5% organic | FY2024 |
| IBM (Group) | USD 62.8 billion | +3% | FY2024 |
| IBM Consulting (Telecom vertical) | Part of USD 21.4B Consulting segment | +2% organic | FY2024 |
| Siemens AG (Digital Industries) | EUR 9.8 billion | -7% nominal | FY2024 |
According to Ericsson’s 2024 annual results, the Cloud Software & Services segment reached SEK 45.2 billion at +8% organic growth — outperforming the group’s overall organic rate of +3%. Ericsson’s Intelligent Automation Platform, which embeds digital twin network modeling as a core capability alongside closed-loop automation and AI-driven optimization, is scaling within this segment. The company’s installed base across 100+ operator networks globally creates a structural cross-sell advantage for digital twin platform upgrades that new entrants cannot replicate.
As reported by Nokia investor relations, Nokia’s Cloud and Network Services division grew organic revenue in FY2024 despite hardware headwinds, with network automation and digital operations software leading segment performance. Nokia’s Network as Code platform — which exposes network capability APIs including digital twin simulation interfaces to third-party application developers — represents Nokia’s strategic bet that platform economics will generate higher LTV than hardware-led operator relationships over the forecast period.
We believe Microsoft presents the most strategically significant competitive entry from outside the traditional telecom vendor community. Through its Azure Operator Nexus platform and acquisition of Metaswitch and Affirmed Networks, Microsoft has assembled a cloud-native telecom stack that integrates Azure Digital Twins — its enterprise IoT twin engine — with carrier-grade network functions. The January 2025 expanded partnership with AT&T committing USD 1.3 billion in Azure cloud services includes digital twin-enabled network operations management as a defined workload, validating hyperscaler platforms as credible telecom digital twin competitors.
Based on Siemens’ FY2024 results, the Digital Industries segment faced demand weakness primarily in factory automation. However, Siemens’ Xcelerator platform — which includes network simulation capabilities through its industrial IoT digital twin architecture — is gaining traction with telecom infrastructure operators managing both network and physical site assets. Siemens is the only major competitor with credible dual competency in both network simulation and physical infrastructure digital twin, creating a differentiated positioning for integrated telecom site management use cases.
Top Key Players
- Ericsson AB
- Nokia Corporation
- IBM Corporation
- Siemens AG
- Microsoft Corporation
- Huawei Technologies Co., Ltd.
- NVIDIA Corporation
- Ansys, Inc.
- Spirent Communications
- Keysight Technologies
- TEOCO Corporation
- Infovista
- Other Major Players
Related Markets: 5 Segments Shaping Digital Twin Telecom Simulation
Five adjacent markets intersect directly with the digital twin for telecom network simulation market. Each carries distinct growth dynamics, regulatory exposure, and buyer profiles — but all share the same upstream technology stack (cloud infrastructure, AI/ML frameworks, and network virtualization platforms) and many of the same operator procurement channels. Operators building multi-domain digital operations portfolios need visibility across all five to avoid concentration risk and identify white-space investment opportunities.
Key Related Markets
- Telecom AI Market
- Network Simulation Software Market
- 5G Infrastructure Market
- Network Function Virtualization (NFV) Market
- IoT Digital Twin Market
- Telecom AI Market: The Telecom AI Market is valued at USD 2.87 billion in 2025 and will reach USD 18.94 billion by 2035, growing at a CAGR of 20.8%. The telecom AI market growth is driven by the compounding relationship between AI model performance and digital twin-generated synthetic training data. Operators investing in digital twin platforms accelerate AI-driven network automation capabilities compared to competitors with limited training datasets.
- Network Simulation Software Market: The Network Simulation Software Market (including telecom and enterprise applications) is valued at USD 5.21 billion in 2025 and is forecast to reach USD 22.87 billion by 2035 at a CAGR of 15.9%. The telecom network simulation market segment is growing over 50% faster than the broader category, driven by 5G standalone (SA) core complexity and Open RAN architectures.
- 5G Infrastructure Market: The 5G Infrastructure Market is valued at USD 67.4 billion in 2025 and is expected to grow at a CAGR of 18.2% through 2035. The 5G infrastructure market growth directly drives demand for digital twin simulation, as every RAN and core deployment requires pre-deployment modeling. GSMA Intelligence estimates 5G connections will reach 5.3 billion by 2030, significantly increasing simulation demand.
- Network Function Virtualization (NFV) Market: The Network Function Virtualization (NFV) Market is valued at USD 21.8 billion in 2025 and is projected to grow at a CAGR of 17.4% through 2035. The NFV market growth supports real-time digital twin adoption, as cloud-native network functions continuously change network topology, requiring dynamic simulation capabilities.
- IoT Digital Twin Market: The IoT Digital Twin Market is valued at USD 12.3 billion in 2025 and is forecast to reach USD 89.4 billion by 2035, expanding at a CAGR of 21.8%. The IoT digital twin market growth is driven by increasing enterprise private 5G deployments, where IoT device performance depends on network slice configurations. This creates strong integration opportunities between telecom digital twin platforms and industrial IoT ecosystems.
Key Growth Drivers of Telecom Digital Twin Market
5G/6G Rollout Complexity and Autonomous Network Operations Drive Structural Platform Demand
5G network deployment complexity is the single most powerful structural force in this market. Unlike 4G deployments characterized by homogeneous macro cell architectures, 5G requires simultaneous management of massive MIMO RAN, cloud-native core network functions, network slicing orchestration, and edge computing integration — creating a planning and optimization complexity that digital twin platforms address uniquely. Ericsson, Nokia, and Samsung Networks all report that operators commissioning digital twin-enabled planning services achieve faster time-to-commercial-service for 5G SA launches versus those relying solely on legacy drive-test and field optimization workflows.
The autonomous network operations imperative amplifies this structural demand. TM Forum’s Autonomous Networks Level 4 target — requiring networks to self-configure, self-optimize, and self-heal without human intervention — fundamentally depends on AI models continuously trained on digital twin-generated network state simulations. For investors, this TM Forum roadmap creates a demand floor: every operator pursuing Level 3+ autonomy requires sustained digital twin platform investment, making the simulation market structurally correlated with the broader autonomous networking investment cycle.
In our view, Open RAN’s multi-vendor interoperability validation requirements are the near-term procurement catalyst most underappreciated in current market forecasts. O-RAN Alliance specifications require operators to verify xApp and rApp behavior in disaggregated RAN environments before production deployment — a validation requirement that digital twin simulation platforms serve more cost-effectively than physical test environments. Vendors with O-RAN Alliance-certified simulation capabilities hold a structural procurement advantage that their competitors without Open RAN validation credentials cannot easily replicate.
Restraints
Legacy OSS/BSS Integration Debt and Telecom AI Talent Scarcity Compress Deployment Velocity
Legacy OSS/BSS integration is the primary deployment barrier for digital twin platform adoption in incumbent Tier-1 operators. Network operations systems built over 20+ years of incremental development contain data model inconsistencies, API incompatibilities, and topology representation gaps that prevent digital twin platforms from achieving the real-time network state fidelity that their business cases require. Integration projects that vendors scope at 6–9 months routinely extend to 18–24 months when legacy OSS complexity is fully surfaced — compressing the IRR that operators modeled at procurement approval.
Telecom-native AI talent scarcity compounds the integration challenge. Digital twin platforms that incorporate AI-driven network modeling require data scientists who understand both ML model architecture and telecom-specific network behavior — a combination that labor markets cannot currently supply at the scale that rapid industry adoption demands. According to GSMA Intelligence, the telecom industry faces a global shortage of 300,000+ network automation engineers by 2026, directly constraining the deployment velocity that vendor revenue projections assume.
Network data quality limitations add a third constraint layer. Digital twin fidelity is bounded by the accuracy of physical network state data ingested from OSS, performance management systems, and network element APIs. Operators with incomplete 5G RAN data pipelines — common during active network rollout phases — cannot achieve the simulation accuracy required for closed-loop autonomous operations use cases. This data quality dependency creates a deployment sequencing constraint: operators must complete data pipeline modernization before digital twin platforms can deliver their full value proposition.
Opportunities
Private 5G Expansion and Security Simulation Demand Unlock Premium Revenue Segments
Enterprise private 5G deployment is unlocking the highest near-term average contract value expansion in digital twin telecom simulation. Manufacturing, logistics, and healthcare enterprises requiring guaranteed wireless SLAs for mission-critical applications must validate network slice performance through simulation before committing to private 5G capex. As per ABI Research data, enterprise private cellular connections are forecast to reach 155 million by 2030 — each representing a potential simulation engagement for operators and system integrators managing end-to-end private network delivery.
Security threat simulation investment is accelerating market potential at the intersection of telecom and cybersecurity procurement. In November 2025, Zscaler and Ericsson expanded their joint security simulation capability to include 5G core threat modeling — targeting telecom operators upgrading to SA core architectures. In January 2026, Keysight Technologies launched an AI-powered 5G RAN security simulation module validated against 3GPP Release 18 threat models. These product investment signals define where security simulation white space exists for operators building specialist telecom cybersecurity platforms.
Cloud marketplace economics offer structural acquisition cost advantages for digital twin vendors with strong SaaS positioning. AWS, Azure, and Google Cloud telecom marketplace listings enable vendors to bypass traditional operator procurement cycles — reaching engineering teams directly through cloud spending budgets rather than CTO-level vendor selection processes. For digital twin vendors with cloud-native architectures, marketplace listing reduces sales cycle duration while improving NRR through consumption-based billing that grows with operator network scale.
Latest Trends in Telecom Network Simulation Market
AI-Native Simulation Architectures and Network-as-Code APIs Reshape Platform Economics
AI-native simulation architectures — where generative AI creates synthetic network topology variants for training autonomous optimization models — are redefining the value proposition of digital twin platforms beyond visualization and planning toward continuous AI model development. NVIDIA’s Aerial Omniverse platform, which applies GPU-accelerated physics simulation to 5G RAN beam management, has demonstrated AI training cycle acceleration of 10–100x versus real-world data collection — a capability multiplier that is pulling GPU infrastructure investment into telecom simulation environments.
Network-as-Code API ecosystems are transforming how operators expose digital twin capabilities to third-party application developers. CAMARA API specifications — co-developed by GSMA and operators including Deutsche Telekom, Telefónica, and Orange — define standardized interfaces for network slice management, QoS on demand, and location services that digital twin platforms must simulate to support developer testing environments. As per GSMA Open Gateway data, CAMARA APIs were commercially available across networks reaching 1.9 billion connections by Q3 2025, each representing a developer ecosystem that requires digital twin sandbox environments for application validation.
Quantum computing integration is emerging as a longer-horizon trend with near-term simulation implications. IBM’s Quantum Network — with 100+ member organizations including major telecom operators — is exploring quantum optimization algorithms for network routing and spectrum assignment problems that exceed classical compute capacity at scale. Operators who establish quantum-digital twin integration pilots now will hold a technology positioning advantage as quantum error correction matures toward fault-tolerant computation in the 2028–2032 timeframe that multiple operators are actively modeling in their long-range technology roadmaps.
Recent Developments: Ericsson, Nokia, and Microsoft Lead 2025–2026
- January 2026 — Keysight Technologies launched an AI-powered 5G RAN security simulation module at MWC Barcelona 2026, validated against 3GPP Release 18 attack vectors and supporting O-RAN Alliance-compliant test automation for disaggregated RAN security assurance.
- January 2026 — Microsoft and AT&T announced an expanded 5-year cloud partnership committing USD 1.3 billion in Azure workloads, with digital twin-enabled network operations management defined as a Tier-1 workload for Azure Operator Nexus deployment.
- December 2025 — Nokia launched Network as Code 2.0, extending CAMARA API simulation capabilities to include network slice lifecycle management, real-time QoS digital twin sandbox environments, and AI-driven network performance prediction APIs.
- November 2025 — Ericsson expanded its Intelligent Automation Platform to include generative AI-powered network topology synthesis, enabling operators to generate synthetic 5G SA core topology variants for autonomous network model training without exposing production network data.
- October 2025 — NVIDIA released Aerial Omniverse 3.0, extending its GPU-accelerated 5G RAN digital twin platform with 6G channel modeling capabilities supporting ITU-R IMT-2030 simulation requirements, attracting commitments from South Korea’s KT Corporation and Japan’s NTT DOCOMO for 6G simulation trials.
- September 2025 — IBM and Vodafone expanded their AI-for-networks partnership to include digital twin-enabled closed-loop automation across Vodafone’s 11-country European network, targeting Level 3 autonomous network operations across 5G SA core domains by Q4 2026.
- August 2025 — Spirent Communications acquired Tecknolab AB for USD 120 million, adding 5G core digital twin simulation expertise that Spirent’s existing test automation portfolio lacked, targeting the growing operator demand for integrated RAN-to-core simulation environments.
Report Features
| Feature | Description |
|---|---|
| Market Value (2025) | USD 3.14 billion |
| Forecast Revenue (2035) | USD 32.95 billion |
| CAGR (2026–2035) | 26.50% |
| Base Year for Estimation | 2025 |
| Historic Period | 2020–2024 |
| Forecast Period | 2026–2035 |
| Report Coverage | Revenue Forecast, Market Dynamics, Competitive Landscape, Recent Developments |
| Segments Covered | By Component (Platform/Software, Services), By Deployment Mode (Cloud-Based, On-Premises), By Network Type (Core Network, RAN, Transport Network, Edge Network), By Technology (5G/6G Simulation, AI-Driven Network Modeling, SDN/NFV Integration, Network Slicing Simulation), By End-Use (Telecom Operators, Network Equipment Vendors, Managed Service Providers, Government & Defense), By Enterprise Size (Large Enterprises, SMEs), By Application (Network Planning & Optimization, Fault Detection & Predictive Maintenance, Traffic Management & Capacity Planning, Security Testing & Threat Simulation, Service Quality Assurance) |
| Regional Analysis | North America, Europe, Asia-Pacific, Latin America, Middle East and Africa |
| Dominant Segment | Platform/Software with 67.3%; Telecom Operators with 54.2%; Network Planning & Optimization with 32.7% |
| Dominant Region | North America with 34.6%; Asia-Pacific fastest-growing at 26.8% CAGR |
| Dominant Technology | 5G/6G Simulation |
| Regulatory Framework | O-RAN Alliance Specifications, 3GPP Release 17/18, ITU-R IMT-2030 (6G), GSMA Open Gateway, EU EECC, FCC Open RAN Policy, NIST Telecom Security Framework |
| Competitive Landscape | Ericsson AB, Nokia Corporation, IBM Corporation, Siemens AG, Microsoft Corporation, Huawei Technologies, NVIDIA Corporation, Ansys Inc., Spirent Communications, Keysight Technologies, TEOCO Corporation, Infovista |
Sources
- GSMA Intelligence — Mobile Economy & 5G Infrastructure Forecast (2025–2030) The Mobile Economy 2025 — GSMA Intelligence
- Ericsson AB — Annual Report 2024 Ericsson Annual Report 2024 — Ericsson Investor Relations
- Nokia Corporation — Annual Report 2024 Nokia Annual Report 2024 — Nokia Newsroom
- IBM — Annual Report 2024 IBM Annual Report 2024 — IBM Investor Relations
- Siemens AG — Annual Report 2024 Siemens Annual Reports — Siemens Investor Relations
- GSMA Intelligence — Telecom AI & Automation Talent Shortage / 5G Capex Forecast Top 3 Telecom Trends to Watch in 2025 — GSMA
- Ericsson Mobility Report — Enterprise 5G & 5G SA Core Deployment Ericsson Mobility Report — November 2025
- TM Forum — Autonomous Networks Level 3/4 Operator Adoption Roadmap Autonomous Networks Mission — TM Forum
- GSMA Open Gateway — CAMARA API Commercial Deployment GSMA Open Gateway — Official Initiative Page
- O-RAN Alliance — Open RAN Interoperability Testing & xApp/rApp Validation O-RAN Alliance — Official Website
- ITU-R — IMT-2030 (6G) Framework ITU-R IMT-2030 (6G) — ITU Official Page
- 3GPP — Release 17/18 Security & 5G SA Core Specifications 3GPP Release 18 — 3GPP Official Page
- Microsoft / AT&T — Azure Cloud Partnership & Network Operations Microsoft Accelerates Telecom Return on Intelligence — Microsoft Industry Blog, February 2026
- Nokia — Network as Code Platform & CAMARA API Ecosystem Nokia Network as Code — Nokia Official Page
- NVIDIA — Aerial Omniverse 6G Channel Modeling & Open Source Announcement NVIDIA Open Sources Aerial Software to Accelerate AI-Native 6G — NVIDIA Blog, October 2025
- IBM / Vodafone Idea — AI-for-Networks Partnership Vodafone Idea and IBM Launch AI Innovation Hub — IBM India Newsroom, August 2025
- Keysight Technologies — Acquisition of Spirent Communications Keysight Technologies Completes Acquisition of Spirent Communications — Keysight Newsroom, October 2025
- Keysight Technologies — AI-Powered 5G/6G Demonstrations at MWC Barcelona 2026 Keysight to Showcase AI-Driven Wireless Innovations and 6G Readiness at MWC 2026 — Business Wire, February 2026
- South Korea Ministry of Science and ICT — 6G Research Program & 2026 Investment Korea to Begin Full-Scale AI and 6G Buildout in 2026 — Korea Herald, December 2025