What is the Bio Based Esters Market Size?
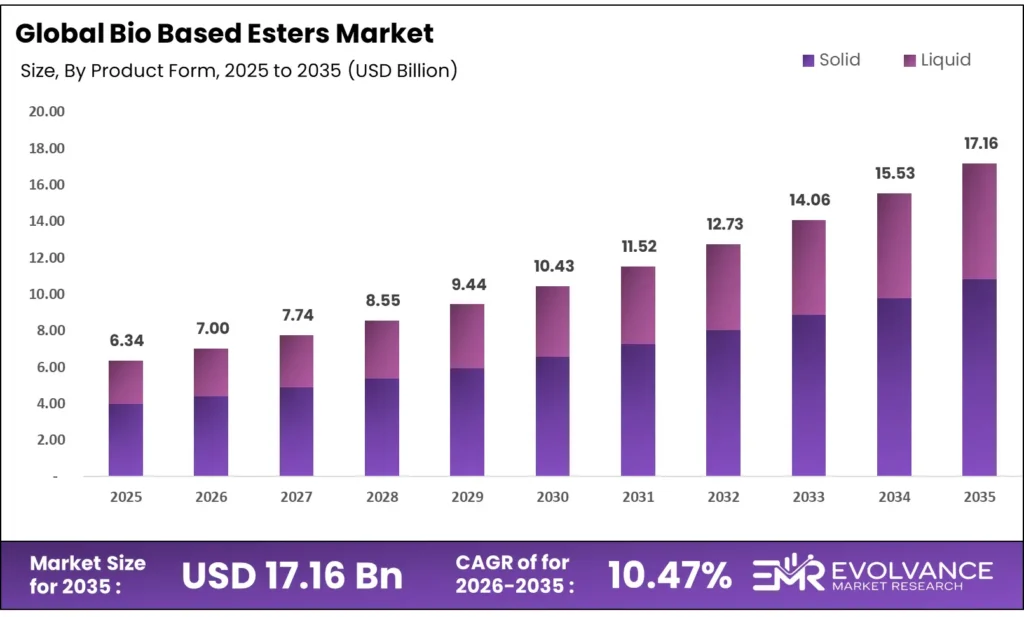
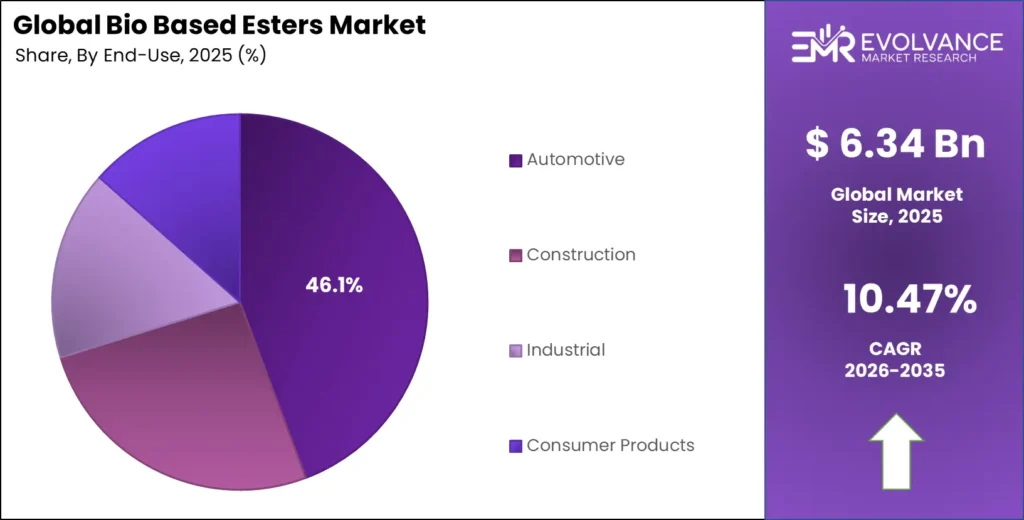
The Global Bio Based Esters Market size will be worth around USD 17.16 Billion by 2035 from USD 6.34 Billion in 2025, growing at a CAGR of 10.47% during the forecast period 2026 to 2035. Automotive and food sectors are pulling demand forward through strict emissions rules and clean-label product shifts. Buyers are moving spend toward vegetable-oil-derived esters as they replace petroleum-based plasticizers and fuel additives. Feedstock supply, however, remains a constraint — global capacity for vegetable-oil-based bio esters is capped at about 400,000 metric tons annually, limiting volume scale-up.
Market Highlights
- The Global Bio Based Esters Market valued at USD 6.34 Billion in 2025, forecast to reach USD 17.16 Billion by 2035 at a CAGR of 10.47%.
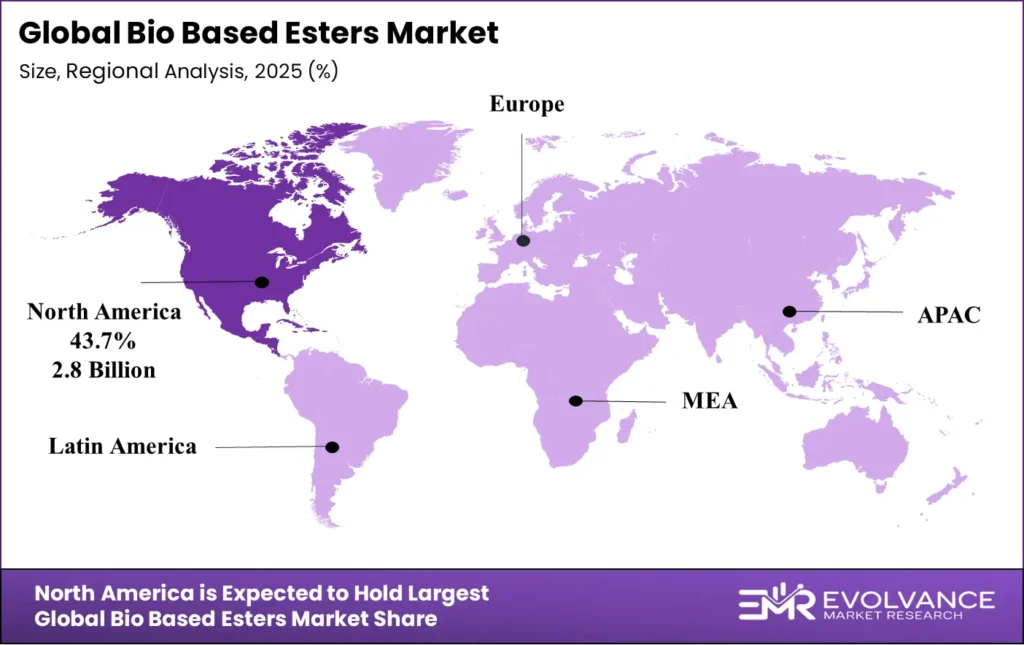
- North America leads with a 43.7% regional share, valued at USD 2.8 Billion.
- Solid form dominates the product segment with a 67.3% share.
- Vegetable Oils lead feedstock with a 45.8% share.
- Gasoline Additives lead applications with a 41.4% share.
- Automotive is the top end-user segment with a 46.1% share.
Market Overview
Bio based esters are chemical compounds formed by reacting fatty acids or other organic acids with alcohols, using renewable raw materials such as vegetable oils, animal fats, and sugarcane as feedstocks. They serve as direct substitutes for petroleum-derived esters in fuels, plasticizers, lubricants, and solvents. Their biodegradability and lower toxicity profile give them a structural advantage as environmental rules tighten globally.
The market spans multiple value chains — from oleochemical producers converting plant-based fats into methyl esters for biodiesel, to specialty chemical firms refining ester derivatives for cosmetics and drug delivery. This breadth means the sector is not a single commodity market but a portfolio of technically distinct products serving different buyer segments with varying performance and regulatory requirements.
Government biofuel mandates and carbon reduction targets are accelerating substitution away from fossil-based chemicals. Indonesia and the EU each produced close to or above 13–14 billion litres of fatty acid methyl ester biodiesel in 2023, demonstrating that policy-driven demand is already translating into industrial-scale bio ester production. New enzymatic production facilities are cutting climate footprints by over 60%, which further strengthens the cost and compliance case for adoption.
According to the U.S. Department of Energy, the United States produced 1.62 billion gallons of biodiesel, while consuming 1.66 billion gallons — slightly exceeding domestic output. This supply gap signals that even in one of the largest producing nations, domestic capacity has not fully caught up with actual demand, creating sustained import dependency and pricing leverage for producers.
Global biofuel demand will reach around 200 billion litres by 2028, roughly 23% higher than the prior five-year period. This growth is not organic — it is mandate-driven across the EU, United States, Indonesia, and Brazil. Investors and producers who build volume capacity now, before mandates fully phase in, will hold the margin advantage when demand arrives at scale.
Product Form Insights
Solid form dominates with 67.3% due to superior handling and shelf stability.
In 2025, Solid held a dominant market position in the By Product Form segment of the Bio Based Esters Market, with a 67.3% share. Solid bio esters are easier to transport, store, and handle at scale — key logistics advantages for industrial buyers in automotive and construction supply chains. Their longer shelf life reduces waste and simplifies procurement cycles, which explains why volume buyers consistently prefer solid forms over liquid variants despite comparable performance.
Liquid bio esters serve applications where direct blending is required without a melting or dissolution step. They are preferred in gasoline additive blending, solvent formulations, and personal care applications where dosing precision and homogeneous mixing matter more than storage convenience. Liquid forms carry higher handling and stability costs, but their market role is protected by applications where solid alternatives cannot replace them.
Feedstock Insights
Vegetable Oils dominate with 45.8% due to established global supply chains and high ester yield.
In 2025, Vegetable Oils held a dominant market position in the By Feedstock segment of the Bio Based Esters Market, with a 45.8% share. Palm oil, soybean oil, and rapeseed oil together account for approximately 73% of global biodiesel ester feedstocks, palm alone at 36%. This concentration reflects decades of palm-processing infrastructure investment in Southeast Asia and soybean processing in the Americas. However, it also means that palm price volatility — which exceeded 30% swings in 2024 — passes directly into production costs for downstream ester manufacturers.
Animal Fats represent a cost-efficient feedstock option for producers near meat processing clusters. They require less preprocessing than vegetable oils in certain transesterification routes, offering margin advantages in regions with dense livestock industries. However, their feedstock quality varies significantly, which limits their use to lower-specification fatty ester grades in industrial applications.
Microalgae as a feedstock remains in early commercial stages but carries strategic importance. Algae-derived oils offer high fatty acid concentrations and can be grown without competing for agricultural land. Commercialized waste-to-oleochemical technology now converts food-processing byproducts — including potato peel waste — into specialty esters at 40% cost savings versus virgin materials, a directional signal that waste and alternative feedstocks will gain traction as cost pressures mount.
Sugarcane-derived esters are primarily relevant in Brazil and Southeast Asia, where sugarcane is a major crop with existing refining infrastructure. Circular economy processes built around sugarcane now achieve 92% yield rates when transforming byproducts into high-value fatty acids, making this feedstock increasingly viable for specialty ester production.
Corn-based esters connect the bio ester market to the corn ethanol supply chain, particularly in the United States. While corn is less feedstock-efficient than vegetable oils for direct ester synthesis, the proximity to large-scale corn processing facilities reduces logistics costs. Corn’s relevance will grow as demand for hybrid petrochemical-oleochemical blends increases.
Application Insights
Gasoline Additives dominate with 41.4% due to biofuel blend mandates driving volume demand.
In 2025, Gasoline Additives held a dominant market position in the By Application segment of the Bio Based Esters Market, with a 41.4% share. Mandatory biofuel blending targets across the EU, United States, Indonesia, and Brazil force fuel distributors to source fatty acid methyl esters at scale. The U.S. consumed 1.66 billion gallons of biodiesel in 2022 alone, per the Department of Energy. This volume is regulatory in nature — it will not shrink unless mandates change — giving gasoline additive applications a structurally secure demand floor.
Biodiesel is the primary destination for fatty acid methyl esters globally, with Indonesia producing nearly 14 billion litres in 2023 and the EU producing approximately 13 billion litres, per World Bioenergy Association data. Brazil and the United States contribute an additional combined 14 billion litres. These volumes confirm biodiesel as the largest single application within the bio ester market, even though it is classified separately from gasoline additives in this segmentation.
Plasticizers made from bio esters are replacing phthalate-based alternatives in flexible PVC and polymer applications as toxicity regulations tighten in the EU and North America. This substitution is structurally driven — it is not discretionary spend but compliance-mandated replacement. The growth rate in bio-based plasticizer demand will track directly with the pace of phthalate phase-outs across regulated markets.
Lubricants represent a high-margin application for bio esters because performance specifications are demanding, which limits competition from low-quality alternatives. The industry is shifting toward re-refined base oils, and customers now request carbon footprint data as a standard product specification for formulated lubricants. This signals that bio ester lubricants will increasingly compete on sustainability credentials alongside technical performance.
Solvents using bio ester chemistry serve printing, coatings, and cleaning applications where volatile organic compound regulations restrict petroleum-based alternatives. Bio ester solvents offer biodegradability advantages that reduce downstream waste treatment costs for industrial users — a concrete cost benefit beyond regulatory compliance.
End User Insights
Automotive dominates with 46.1% due to biofuel mandates and bio lubricant adoption.
In 2025, Automotive held a dominant market position in the By End User segment of the Bio Based Esters Market, with a 46.1% share. Transportation fuel blending requirements are the primary volume driver, but automotive lubricant reformulation is a secondary growth layer. Hybrid petrochemical-oleochemical lubricant blends now achieve 85% of petroleum-based performance metrics while cutting carbon footprint by 60%, making the performance-versus-sustainability trade-off increasingly manageable for fleet and OEM buyers.
Construction end-users consume bio esters primarily through plasticizer applications in sealants, coatings, and flexible materials. As green building standards expand globally, construction procurement teams face growing pressure to document the bio-based content of their chemical inputs. This documentation requirement is creating a direct pull for certified bio ester plasticizers over conventional alternatives.
Industrial buyers span manufacturing, metalworking, and process industries that use bio esters in cleaning agents, cutting fluids, and mold release compounds. This segment benefits when bio ester solvents and lubricants allow plants to meet discharge and air quality regulations without costly end-of-pipe treatment upgrades.
Consumer Products manufacturers — particularly in personal care — have become a significant demand source. The personal care industry’s reformulation activity has lifted oleochemical consumption by 17% year-over-year, and food sector clean-label demand drove 22% growth in glycerol ester demand during Q4 2025. These are not trend signals — they are confirmed procurement shifts already visible in quarterly purchasing data.
Market Segments Covered in the Report
By Product Form
- Solid
- Liquid
By Feedstock
- Vegetable Oils
- Animal Fats
- Microalgae
- Sugarcane
- Corn
By Application
- Gasoline Additives
- Biodiesel
- Plasticizers
- Lubricants
- Solvents
By End User
- Automotive
- Construction
- Industrial
- Consumer Products
Regional Insights
North America Dominates the Bio Based Esters Market with a Market Share of 43.7%, Valued at USD 2.8 Billion
North America holds 43.7% of the global market, worth USD 2.8 Billion in 2025. The U.S. Renewable Fuel Standard mandates biodiesel blending, creating a guaranteed demand floor that no other region replicates at this scale. With domestic biodiesel production at approximately 6 billion litres in 2023 and consumption exceeding production, the region sustains both a large producer base and a persistent import premium that keeps prices and margins elevated for domestic manufacturers.
Europe Bio Based Esters Market Trends
Europe is the second-largest region, anchored by the EU’s Renewable Energy Directive blending mandates and tight REACH chemical regulations that push formulators toward bio-based alternatives. Germany alone produced around 3.6 million tonnes of biodiesel in 2024, making it Europe’s top producer. The EU generated approximately 13 billion litres of biodiesel in 2023, driven by rapeseed oil and used cooking oils — a dual-feedstock model that reduces supply concentration risk compared to other regions.
Asia Pacific Bio Based Esters Market Trends
Asia Pacific is the fastest-developing region for bio ester volume, led by Indonesia’s palm-based biodiesel program — nearly 14 billion litres produced in 2023, the largest global output. India and Southeast Asian markets show double the global average growth rate in bio ester consumption. The region’s low-cost feedstock base and proximity to palm and soybean supply chains give it a structural cost advantage that will attract investment as global demand scales.
Latin America Bio Based Esters Market Trends
Latin America, led by Brazil, contributes nearly 8 billion litres of biodiesel annually, derived primarily from soybean oil. Brazil’s national biodiesel mandate — now targeting B15 blends and higher — ensures volume growth without dependence on export market access. Mexico’s growing industrial base and proximity to U.S. supply chains create a secondary growth corridor for plasticizer and solvent applications beyond the fuel sector.
Middle East & Africa Bio Based Esters Market Trends
The Middle East and Africa region is the smallest contributor today but carries long-term potential. Several GCC countries are investing in renewable energy diversification, which includes biofuel development programs. South Africa has active biodiesel pilots. The region’s bio ester growth will lag global averages near-term, but infrastructure investment in East Africa and policy mandates in select Gulf nations point to accelerating demand in the latter part of the forecast period.
Key Regions and Countries
North America
- US
- Canada
Europe
- Germany
- France
- The UK
- Spain
- Italy
- Rest of Europe
Asia Pacific
- China
- Japan
- South Korea
- India
- Australia
- Rest of APAC
Latin America
- Brazil
- Mexico
- Rest of Latin America
Middle East & Africa
- GCC
- South Africa
- Rest of MEA
Regulatory Landscape
The EU’s revised Renewable Energy Directive (RED III), effective from 2023 and binding through the forecast period, sets a 42.5% renewable energy target by 2030 with specific biofuel sub-mandates. This directly lifts required volumes of fatty acid methyl esters in transport fuel blends. Producers with certified bio ester supply chains gain a compliance-ready advantage with fuel distributors under this framework.
The U.S. Environmental Protection Agency sets annual Renewable Volume Obligations under the Renewable Fuel Standard (RFS). In 2024, the EPA finalized RVO targets extending through 2025, locking in biodiesel and renewable diesel volumes at levels that support sustained ester demand. Producers meeting ASTM D6751 biodiesel quality standards qualify for Renewable Identification Number (RIN) credits, adding a direct financial incentive layer on top of commodity pricing.
Indonesia’s B35 biodiesel mandate, implemented in 2023, requires all diesel fuel to contain 35% palm-based fatty acid methyl ester. This single policy made Indonesia the world’s largest biodiesel producer at nearly 14 billion litres in 2023. The government has publicly signaled a pathway to B40 and beyond, which will further absorb domestic palm methyl ester production and tighten global feedstock supply.
EU REACH compliance imposes an average cost of USD 350,000 per substance for new chemical approvals, with bio-based substances taking 32% longer to clear than petroleum-based equivalents. This regulatory lag penalizes new bio ester entrants and protects incumbents who have already completed registration. Smaller producers without the resources to fund multi-year approval processes face a real market access barrier that consolidated players do not.
Bio Based Esters Market Dynamics
Drivers
Personal Care and Pharmaceutical Reformulation Lifts Specialty Oleochemical Demand Beyond Forecast Assumptions
The personal care industry’s shift to bio-derived ingredients has increased oleochemical consumption by 17% year-over-year — a pace that outstripped most analyst projections entering 2025. This is not cosmetic reformulation for brand positioning. It reflects regulatory pressure in the EU and tightening retailer standards in North America that are forcing formulators to replace synthetic esters with certified bio-based alternatives across product lines.
The food sector’s clean-label movement produced a 22% lift in glycerol ester demand in Q4 2025. Glycerol esters function as emulsifiers in processed foods — a non-discretionary input. As food producers replace synthetic emulsifiers to meet clean-label claims, they absorb bio ester volumes that were not in the demand forecast three years ago. This buyer segment now competes for the same feedstock supply as cosmetics and pharmaceutical buyers.
Pharmaceutical adoption is adding a further structural demand layer. Lipid-based drug delivery systems now incorporate specialty oleochemicals in 28% of new developments, and 68% of newly approved drug formulations in 2024 contained oleochemical-derived excipients for controlled-release systems. Drug formulation volumes are small relative to fuel, but the margin per kilogram is significantly higher — making pharmaceutical demand disproportionately valuable for specialty ester producers.
Restraints
Palm Oil Price Volatility and EU Approval Delays Create Compounding Cost Risks for Bio Ester Producers
Palm oil derivative prices swung by more than 30% in 2024, directly hitting production cost stability for bio ester manufacturers dependent on palm-based feedstocks. Unlike petroleum refining, where crude price risk can be hedged through established futures markets, palm oil hedging remains less accessible for mid-size producers. The result is erratic margin performance that complicates multi-year supply contracts and deters capacity investment.
EU REACH compliance averages USD 350,000 per substance approval, with bio-based substances taking 32% longer to clear than petroleum-based equivalents. This creates a regulatory paradox: the very market that mandates bio-based alternatives also imposes a slower, more expensive approval process for them. Companies cannot recoup this cost in low-margin commodity ester grades — it is only viable for high-margin specialty esters where pricing power exists.
Together, these two constraints — feedstock volatility and regulatory lag — compress the financial case for new bio ester entrants most severely. Established producers with diversified feedstock access and existing REACH registrations absorb these costs more easily, reinforcing the trend toward market consolidation among large, integrated chemical companies. Smaller and newer players face both a cost disadvantage and a time-to-market penalty that established players do not bear.
Growth Factors
Waste Feedstock Technology and Emerging Market Demand Open New Revenue Pathways Beyond Conventional Ester Production
Commercialized waste-to-oleochemical technology now converts food processing byproducts — including potato peel waste — into specialty esters at 40% cost savings versus virgin materials. This is not a pilot program — it is deployed production technology. Producers who integrate waste feedstock sourcing into their supply chains gain a permanent cost floor advantage that virgin-material competitors cannot easily replicate.
Circular economy conversion processes have achieved 92% yield rates when transforming food industry byproducts into high-value fatty acids. At this yield level, waste feedstock streams are economically comparable to purpose-grown crops — without the land use and price volatility risks. This technology directly addresses the single largest structural vulnerability in bio ester production: feedstock cost instability.
India and Southeast Asian markets are consuming bio esters at double the global average growth rate. This is a geographic demand shift that most current capacity — concentrated in Europe and North America — is not positioned to serve efficiently. Producers who establish regional supply capacity in South and Southeast Asia before the demand concentration peaks will capture the margin advantage that comes from proximity to the fastest-growing buyer base.
Emerging Trends
Carbon Footprint Becomes a Procurement Criterion, Rewarding Producers with Verified Low-Emission Bio Ester Processes
Customers are now requesting product carbon footprint data as a standard specification when buying formulated lubricants — not as an optional sustainability add-on but as a basic property alongside viscosity and flash point. This is a buyer behavior shift that effectively creates a two-tier market: producers who can document and verify carbon performance, and those who cannot. The former command pricing power; the latter compete only on commodity price.
Enzymatic esterification processes, now deployed in new production facilities, cut climate footprint by over 60% compared to conventional acid-catalyzed routes. This process advantage is not incremental — it is sufficient to clear the carbon performance thresholds that large industrial buyers are beginning to set. Plants built or retrofitted with enzymatic processes in the next three to five years will have a compliance advantage as carbon specification requirements tighten.
The industry shift toward re-refined base oils for lubricants is gaining momentum as the primary method for reducing CO2 impact in the lubrication sector. Bio esters that blend effectively with re-refined base oils are better positioned in this trend than those requiring virgin base oil compatibility only. Producers developing formulations optimized for re-refined blends are building products aligned with where industrial lubricant procurement is moving — not where it currently sits.
Key Companies Insights
BASF SE generated €7.1 billion in revenue from its Industrial Solutions segment in FY2024, a division covering esters, plasticizers, and bio-based chemical intermediates. BASF’s depth in specialty ester chemistry and its global manufacturing network give it scale advantages that allow pricing flexibility across multiple end-user segments. Its exposure to both bio-based and petroleum-based ester routes also provides hedging capability against feedstock volatility — a structural advantage smaller bio-only producers cannot replicate.
Cargill reported total revenue of USD 177 billion in FY2024, with its Bioindustrial business operating more than 1 million tonnes of annual bio-based chemical production capacity, including ester derivatives for industrial fluids. Cargill’s position as a primary vegetable oil processor means it controls its own feedstock supply — an advantage that insulates its bio ester margins from the palm and soybean price swings that hit downstream-only producers hardest.
DuPont de Nemours, Inc. brings specialty material science capabilities to the bio ester space, particularly through its performance chemicals and biomaterial platforms. DuPont’s research infrastructure supports high-margin application development — pharmaceutical excipients, advanced plasticizers, and functional coatings — where bio ester content commands premium pricing. Its focus on differentiated rather than commodity ester products positions it to benefit disproportionately from pharmaceutical sector adoption growth.
Evonik Industries AG recorded €2.3 billion in revenue from its Specialty Additives division in FY2024, which includes ester-based additives used in lubricants, coatings, and fuel formulations. Evonik’s specialty additives business has the technical depth to serve the carbon footprint documentation requirements now entering lubricant procurement specifications. Its ability to supply verified low-emission bio ester additives at specification grade gives it an advantage as industrial buyers formalize sustainability requirements into their sourcing criteria.
Key Companies
- BASF SE
- Cargill
- DuPont de Nemours, Inc.
- Evonik Industries AG
- Fuchs Petrolub SE
- Solvay SA
- TotalEnergies SE
- NatureWorks LLC
- Mitsubishi Chemical Corporation
- Others
Recent Development
- In 2025 – BASF SE generated €7.1 billion in revenue from its Industrial Solutions segment in FY2024, which includes bio-based ester intermediates and plasticizers serving industrial and consumer markets globally. Food sector clean-label reformulation drove 22% growth in glycerol ester demand during Q4 2025, confirming that consumer product reformulation is now a material demand driver beyond biofuel applications.
- In 2024 – Palm oil derivative prices exceeded 30% volatility in 2024, destabilizing feedstock costs for bio ester producers and prompting larger players to accelerate diversification toward waste and alternative feedstocks. 68% of newly approved drug formulations in 2024 contained oleochemical-derived excipients for controlled-release systems, establishing pharmaceutical as a confirmed high-margin demand channel for specialty bio esters.
- In 2024 – Evonik Industries reported €2.3 billion revenue from its Specialty Additives division in FY2024, covering ester-based lubricant and fuel formulation additives across European and global markets. Germany processed approximately 1.45 million tonnes of rapeseed oil into biodiesel in 2024, representing 53.1% of national biodiesel output and reinforcing rapeseed as the EU’s dominant bio ester feedstock.
Market Scope
| Report Features | Description |
|---|---|
| Market Value (2025) | USD 6.34 Billion |
| Forecast Revenue (2035) | USD 17.16 Billion |
| CAGR (2026-2035) | 10.47% |
| Base Year for Estimation | 2025 |
| Historic Period | 2020-2024 |
| Forecast Period | 2026-2035 |
| Report Coverage | Revenue Forecast, Market Dynamics, Competitive Landscape, Recent Developments |
| Segments Covered | By Product Form (Solid, Liquid), By Feedstock (Vegetable Oils, Animal Fats, Microalgae, Sugarcane, Corn), By Application (Gasoline Additives, Biodiesel, Plasticizers, Lubricants, Solvents), By End User (Automotive, Construction, Industrial, Consumer Products) |
| Regional Analysis | North America (US and Canada), Europe (Germany, France, The UK, Spain, Italy, and Rest of Europe), Asia Pacific (China, Japan, South Korea, India, Australia, and Rest of APAC), Latin America (Brazil, Mexico, and Rest of Latin America), Middle East & Africa (GCC, South Africa, and Rest of MEA) |
| Competitive Landscape | BASF SE, Cargill, DuPont de Nemours Inc., Evonik Industries AG, Fuchs Petrolub SE, Solvay SA, TotalEnergies SE, NatureWorks LLC, Mitsubishi Chemical Corporation, Others |
| Customization Scope | Customization for segments, region/country-level will be provided. Moreover, additional customization can be done based on the requirements. |
| Purchase Options | We have three licenses to opt for: Single User License, Multi-User License (Up to 5 Users), Corporate Use License (Unlimited User and Printable PDF) |
