What is the Battery Gigafactory Market Size?
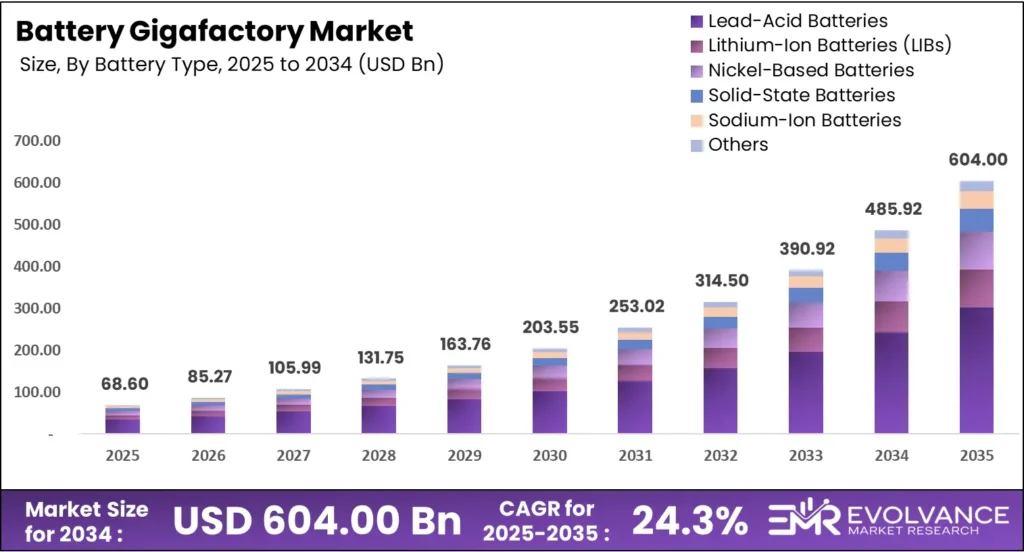
The global battery gigafactory market will reach USD 604.00 billion by 2035 from USD 68.6 billion in 2025, growing at a CAGR of 24.3% during the forecast period 2026 to 2035. According to Autovista Group’s 2025 production data, global EV battery cell output reached 867.8 GWh in 2024 — a 21.2% year-on-year increase that shows how fast gigafactory build-out is translating into physical output. According to IDTechEx analysis via AltEnergyMag, global lithium-ion battery production capacity exceeded 2,500 GWh in 2025, with China controlling over 75% of that base — meaning any supply chain disruption in one country creates a global pricing event.
Market Highlights
- The global battery gigafactory market was valued at USD 68.6 billion in 2025 and is projected to reach USD 604.00 billion by 2035, growing at a CAGR of 24.3%.
- Lead-Acid Batteries dominate the By Battery Type segment with a 42.6% share in 2025.
- Large-Scale Gigafactories (>30 GWh) lead the By Capacity Scale segment with a 41.9% share.
- Wet Processing holds a 52.8% share of the By Production Process segment.
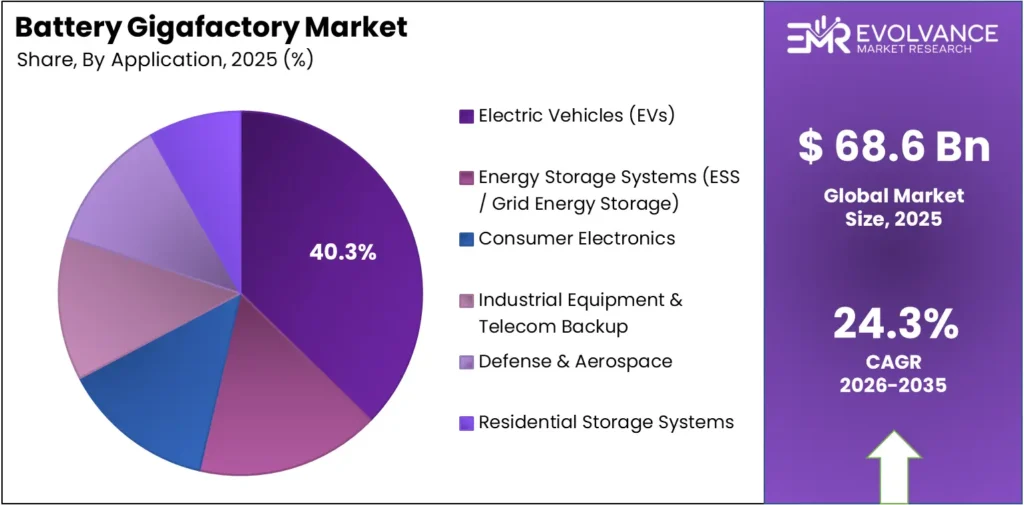
- Electric Vehicles (EVs) account for 40.3% of battery gigafactory demand by application.
- Battery Testing & Quality Control leads the By Area of Application segment with a 32.6% share.
- Cylindrical cells capture 49.3% of the By Cell Format segment.
- Asia-Pacific leads all regions with a 56.8% market share worth USD 38.96 billion in 2025.
- Global EV battery cell output reached 867.8 GWh in 2024, a 21.2% year-on-year increase.
- China controls over 75% of global lithium-ion battery production capacity, with CATL alone holding 37% of global lithium-ion battery sales in 2024.
Market Overview
The battery gigafactory market covers the design, construction, and active operation of large-scale battery manufacturing facilities — typically producing 1 GWh or more annually — serving electric vehicle makers, grid energy storage developers, and consumer electronics manufacturers. The battery gigafactory market sits at the intersection of energy transition investment and advanced manufacturing.
Evolvance Market Research analysts found consistent demand signals across 4 regional markets and 10 segmentation dimensions. Our data draws on IEA demand projections, Benchmark Mineral Intelligence gigafactory pipeline assessments, and cross-referenced published investment announcements — giving buyers a transparent, multi-source basis for market entry and geographic allocation decisions.
Battery gigafactories solve a structural problem: the world’s energy transition cannot scale without localized, high-volume battery cell production close to vehicle assembly and grid systems. Automotive OEMs, battery cell producers, utility developers, and defense procurement agencies all commission or partner in gigafactory projects — each with distinct capacity requirements, chemistry preferences, and timeline pressures.
Market concentration is high. According to IDTechEx via AltEnergyMag and cnevpost.com data, the top 6 battery players held more than 65% of global battery sales in 2025, while CATL alone accounted for 37% of global lithium-ion battery sales in 2024 — a concentration level that directly shapes supplier selection, JV structure decisions, and regional capacity planning for any new gigafactory developer.
Battery Gigafactory Market Segmentation Analysis
Battery chemistry and production process carry the highest strategic weight in this market because they determine capital cost, equipment sourcing, and the addressable application pool before a single cell is produced. Investors who select the wrong chemistry at facility design stage face retooling costs of USD 100 million or more per gigawatt-hour.
Lead-Acid Batteries Lead Battery Type Segment with 42.6%
| Sub-segment | Share % | Primary Driver |
|---|---|---|
| Lead-Acid Batteries | 42.6% | Low cost, industrial and telecom backup demand |
| Lithium-Ion Batteries (LIBs) | Not disclosed | EV and grid storage scale economics |
| Nickel-Based Batteries | Not disclosed | Hybrid vehicle and industrial applications |
| Solid-State Batteries | Not disclosed | Next-gen EV range and safety requirements |
| Sodium-Ion Batteries | Not disclosed | Low-cost stationary storage alternative |
Lead-Acid Batteries dominate with 42.6% due to low cost and broad industrial base.
In 2025, Lead-Acid Batteries held a dominant market position in the By Battery Type segment of the Battery Gigafactory Market, with a 42.6% share. Their dominance reflects decades of established production lines, a mature recycling ecosystem, and persistent demand from telecom backup power, industrial UPS systems, and automotive starter batteries — segments that do not yet justify the capital shift to lithium-ion chemistry.
Lithium-Ion Batteries (LIBs) represent the fastest-scaling chemistry tier in new gigafactory construction, with investments concentrated in LFP and NMC variants for EV and grid storage applications. In November 2025, CATL and Stellantis broke ground on a €4.1 billion LFP gigafactory in Zaragoza, Spain — a 50 GWh facility targeting production start by end of 2026.
Nickel-Based Batteries serve a narrowing but stable demand base in hybrid vehicle applications, grid frequency regulation, and heavy industrial equipment. Their share reflects legacy procurement cycles in markets where lithium-ion conversion has been slower — particularly in industrial power systems and aviation ground support — where nickel’s proven cycle life at temperature extremes justifies continued gigafactory line maintenance over replacement.
Solid-State Batteries remain a pre-commercial segment at gigafactory scale, but the first giga-level production lines are now active. In January 2024, ProLogium Technology inaugurated the world’s first giga-level solid-state lithium ceramic battery factory in Taoyuan, Taiwan — the Taoke plant — with initial capacity of 0.5 GWh scaling to 2 GWh.
Large-Scale Gigafactories Hold 41.9% of Capacity Segment
| Sub-segment | Share % | Primary Driver |
|---|---|---|
| Large-Scale Gigafactories (>30 GWh) | 41.9% | OEM JV commitments and policy-backed capex |
| Medium-Scale Gigafactories (10–30 GWh) | Not disclosed | Regional supply security and Tier 2 supplier growth |
| Small-Scale Gigafactories (<10 GWh) | Not disclosed | Specialty chemistry pilots and emerging market entry |
Large-Scale Gigafactories (>30 GWh) dominate with 41.9% due to OEM JV scale requirements.
In 2025, Large-Scale Gigafactories (>30 GWh) held a dominant market position in the By Capacity Scale segment of the Battery Gigafactory Market, with a 41.9% share. These facilities reflect the economics of OEM joint ventures — where automakers and battery suppliers commit to multi-decade supply agreements that only generate returns above 30 GWh annual throughput, concentrating the largest capital rollouts in a small number of high-output plants.
Medium-Scale Gigafactories (10–30 GWh) serve regional supply security goals and Tier 2 battery supplier growth. Governments in Europe and North America have encouraged this tier through grant programs and loan guarantees, as a 10–30 GWh facility can anchor a national battery supply chain without requiring a full OEM partnership structure.
Small-Scale Gigafactories (<10 GWh) function primarily as chemistry pilot facilities, early-commercial solid-state lines, and market-entry platforms for producers targeting niche applications — including defense battery packs, medical device power systems, and specialty consumer electronics. Their smaller footprint allows faster permitting and lower initial capex, making them the preferred entry format for new chemistries.
Wet Processing Dominates Production with 52.8% Share
| Sub-segment | Share % | Primary Driver |
|---|---|---|
| Wet Processing | 52.8% | Installed base and proven electrode coating scale |
| Dry Processing | Not disclosed | Energy and solvent cost reduction at scale |
| Hybrid Processing | Not disclosed | Transition pathway for existing wet-line operators |
Wet Processing dominates with 52.8% due to proven scale and installed line base.
In 2025, Wet Processing held a dominant market position in the By Production Process segment of the Battery Gigafactory Market, with a 52.8% share. The wet electrode coating process requires solvent recovery systems that add capital and energy cost — but its dominance reflects the locked-in installed base from every major gigafactory built before 2022.
Dry Processing is gaining ground as the cost-reduction frontier for next-generation gigafactory lines. In July 2024, LG Energy Solution signed a 39 GWh LFP cell-to-pack supply agreement with Renault Group’s Ampere — the world’s first application of CTP technology to a pouch format — a deal that required new process commitments and shows how chemistry and process decisions are now made together.
Hybrid Processing serves operators who need to reduce energy and solvent costs without scrapping existing wet-line capital. It blends wet coating for current collector layers with dry processing for active material layers, allowing phased retrofits of existing gigafactory lines — a practical path for Tier 1 suppliers in Europe and North America facing both cost pressure and near-term production volume commitments.
EV Segment Drives 40.3% of Battery Gigafactory Demand
| Sub-segment | Share % | Primary Driver |
|---|---|---|
| Electric Vehicles (EVs) | 40.3% | Global EV sales growth and OEM battery sourcing |
| Energy Storage Systems (ESS) | Not disclosed | Grid-scale renewable integration demand |
| Consumer Electronics | Not disclosed | High-volume cylindrical and pouch cell demand |
| Industrial Equipment & Telecom Backup | Not disclosed | Lead-acid replacement and UPS system upgrades |
| Defense & Aerospace | Not disclosed | High-spec energy density and cycle requirements |
| Residential Storage Systems | Not disclosed | Rooftop solar pairing and home energy management |
Electric Vehicles (EVs) dominate with 40.3% due to OEM volume commitments and policy mandates.
In 2025, Electric Vehicles (EVs) held a dominant market position in the By Application segment of the Battery Gigafactory Market, with a 40.3% share. EV battery procurement drives the largest individual gigafactory capital commitments because OEMs require multi-decade supply security at defined chemistry specs — meaning a single automaker contract can justify a full greenfield gigafactory build without any other offtake volume.
Energy Storage Systems (ESS) represent the fastest-growing application segment as utility developers and grid operators scale renewable energy integration. Grid-scale battery storage projects now routinely exceed 100 MWh per site, creating sustained demand for gigafactory ESS output that is structurally less cyclical than EV demand — making ESS contracts increasingly attractive for gigafactory operators seeking revenue stability alongside automotive offtake.
Automotive Manufacturers Lead the Industry Vertical Segment
Automotive Manufacturers lead the Industry Vertical segment.
| Sub-segment | Dominant | Primary Driver |
|---|---|---|
| Automotive Manufacturers | Yes | Multi-GWh OEM battery sourcing and JV investment |
| Battery OEMs | No | Independent cell production at scale |
| Utility & Energy Storage Companies | No | Grid-scale ESS procurement and co-investment |
| Consumer Electronics OEMs | No | High-volume cylindrical and pouch format sourcing |
| Industrial Power System Providers | No | UPS, telecom backup, and forklift applications |
| Aerospace & Defense | No | High-spec cycle life and energy density requirements |
Battery Testing and Quality Control Holds 32.6% Share
| Sub-segment | Share % | Primary Driver |
|---|---|---|
| Battery Testing & Quality Control | 32.6% | Yield management and safety certification demand |
| Cell Production | Not disclosed | Core gigafactory output — electrode, separator, electrolyte |
| Module Production | Not disclosed | Cell grouping for pack and system integration |
| Pack Production | Not disclosed | Final assembly for EV and ESS applications |
| Recycling & Refurbishment | Not disclosed | End-of-life battery recovery and black mass processing |
Battery Testing & Quality Control dominates with 32.6% due to yield and safety certification scale.
In 2025, Battery Testing & Quality Control held a dominant market position in the By Area of Application segment of the Battery Gigafactory Market, with a 32.6% share. Its dominance reflects the fact that every cell produced must pass electrochemical, thermal, and safety certification before shipment — making testing a non-negotiable cost that scales directly with output volume.
Cell Production covers the core electrode coating, separator layering, and electrolyte filling processes that define the gigafactory’s primary manufacturing function. It accounts for the largest share of gigafactory floor space and energy consumption — and the choice between wet and dry electrode processing at this stage determines both the operating cost structure and the chemistry types the facility can produce.
Standalone Facilities Lead the Ownership Structure Segment
Standalone leads the Ownership Structure segment.
| Sub-segment | Dominant | Primary Driver |
|---|---|---|
| Standalone | Yes | Independent battery OEM production and cost control |
| Joint Venture | No | OEM-battery supplier shared risk and capacity commitment |
| Government-Owned / State-Backed | No | Energy security and domestic supply chain policy |
Cylindrical Cells Capture 49.3% of Cell Format Segment
| Sub-segment | Share % | Primary Driver |
|---|---|---|
| Cylindrical | 49.3% | EV and consumer electronics volume scale |
| Prismatic | Not disclosed | LFP EV and ESS applications with high energy density |
| Pouch | Not disclosed | High energy density EVs and flexible form factor demand |
Cylindrical cells dominate with 49.3% due to EV and consumer electronics volume scale.
In 2025, Cylindrical cells held a dominant market position in the By Cell Format segment of the Battery Gigafactory Market, with a 49.3% share. Cylindrical format dominance is reinforced by Tesla’s long-established gigafactory model — now widely adopted across Tier 1 and Tier 2 suppliers — and by high-volume consumer electronics demand that runs on the same cell lines, improving overall facility utilization.
Vertical Integration Leads the Battery Integration Segment
Vertically Integrated (Cell + Pack + Materials) leads the Integration segment.
| Sub-segment | Dominant | Primary Driver |
|---|---|---|
| Vertically Integrated (Cell + Pack + Materials) | Yes | Margin capture and supply chain control at scale |
| Cell-Only Manufacturing | No | Focused cell production for third-party pack assemblers |
| Pack Assembly | No | Low-capex entry for regional battery system producers |
Market Segments Covered in the Report
By Battery Type
- Lead-Acid Batteries
- Lithium-Ion Batteries (LIBs)
- Nickel-Based Batteries
- Solid-State Batteries
- Sodium-Ion Batteries
By Capacity Scale
- Large-Scale Gigafactories (>30 GWh)
- Medium-Scale Gigafactories (10–30 GWh)
- Small-Scale Gigafactories (<10 GWh)
By Production Process
- Wet Processing
- Dry Processing
- Hybrid Processing
By Application
- Electric Vehicles (EVs)
- Energy Storage Systems (ESS / Grid Energy Storage)
- Consumer Electronics
- Industrial Equipment & Telecom Backup
- Defense & Aerospace
- Residential Storage Systems
By Industry Vertical
- Automotive Manufacturers
- Battery OEMs
- Utility & Energy Storage Companies
- Consumer Electronics OEMs
- Industrial Power System Providers
- Aerospace & Defense
By Area of Application
- Battery Testing & Quality Control
- Cell Production
- Module Production
- Pack Production
- Recycling & Refurbishment
By Ownership Structure
- Standalone
- Joint Venture
- Government-Owned / State-Backed
By Facility Type
- Greenfield
- Brownfield
By Cell Format
- Cylindrical
- Prismatic
- Pouch
By Integration
- Vertically Integrated (Cell + Pack + Materials)
- Cell-Only Manufacturing
- Pack Assembly
Battery Gigafactory Market Regional Insights
Asia-Pacific Holds 56.8% Share at USD 38.96 Billion
| Region | Market Value | Share % | Year |
|---|---|---|---|
| Asia-Pacific | USD 38.96 billion | 56.8% | 2025 |
| North America | Not disclosed | Not disclosed | 2025 |
| Europe | Not disclosed | Not disclosed | 2025 |
| Rest of World | Not disclosed | Not disclosed | 2025 |
Asia-Pacific’s 56.8% share reflects a structural cost and policy advantage that other regions cannot close in the near term. China controls over 75% of global lithium-ion battery production capacity as of 2024, meaning the region’s dominance is locked in by manufacturing depth, raw material processing proximity, and a domestic supplier ecosystem built over more than a decade.
Asia-Pacific leads the battery gigafactory market with a 56.8% share worth USD 38.96 billion in 2025, anchored by China’s gigafactory construction cost of about USD 72 million per GWh — well below the USD 100 million per GWh benchmark in North America. This cost gap makes Asia-Pacific the default sourcing region for any OEM seeking to minimize per-cell production cost before tariff and logistics adjustments.
North America Battery Gigafactory Market Trends
North America has emerged as the fastest-growing gigafactory investment destination outside Asia-Pacific, driven by Inflation Reduction Act (IRA) domestic content incentives and DOE loan programs that have directed billions toward US battery cell production. Ultium Cells (GM–LG Energy Solution) and BlueOval SK (Ford–SK On) anchor the region’s OEM-backed gigafactory pipeline.
Europe Battery Gigafactory Market Trends
Europe’s gigafactory pipeline contracted sharply after Northvolt AB filed for full bankruptcy in March 2025 — the collapse of the continent’s most prominent independent battery cell producer. The European Battery Alliance had projected over 1,193 GWh of planned capacity, but project delays and the Northvolt failure have reduced the active pipeline to just over 1 TWh.
Rest of World Battery Gigafactory Market Trends
Emerging gigafactory investment in Latin America, India, and the Middle East is at an early but accelerating stage, supported by raw material proximity and domestic EV policy incentives. India’s PLI scheme is attracting cell manufacturing investment, and the country’s downstream processing position gives it a growing structural case for gigafactory siting decisions through the forecast period.
Key Regions and Countries
North America
- US
- Canada
Europe
- Germany
- France
- The UK
- Spain
- Italy
- Rest of Europe
Asia Pacific
- China
- Japan
- South Korea
- India
- Australia
- Rest of APAC
Latin America
- Brazil
- Mexico
- Rest of Latin America
Middle East & Africa
- GCC
- South Africa
- Rest of MEA
Regulatory Landscape
The Inflation Reduction Act (IRA), active through the forecast period, requires battery cells and modules to meet escalating domestic content thresholds for the Section 30D EV tax credit. Gigafactory developers in North America must source a rising share of components from US or free-trade-agreement partner countries — directly shaping facility location and JV structure decisions.
The EU Industrial Accelerator Act (IAA), proposed by the European Commission in March 2026, introduces “Made in EU” battery content requirements to reduce reliance on Asian-sourced cells for European EV production. This regulation creates a compliance incentive for European OEMs to accelerate domestic gigafactory partnerships, but also raises the cost baseline for new European facilities.
India’s Production Linked Incentive (PLI) scheme for Advanced Chemistry Cell batteries offers incentives of up to INR 18,100 crore for domestic battery cell production meeting defined capacity and localization thresholds — attracting both domestic and international gigafactory investment into the country.
Drivers
EV Adoption Pushes Battery Gigafactory Demand Past 867 GWh
Global EV sales volumes hit consecutive annual records through 2024, driving OEM production commitments and battery cell procurement mandates across Europe, North America, and Asia-Pacific. Each percentage point of new EV market share requires additional gigawatt-hours of dedicated cell production, making EV sales the single most direct demand driver for new gigafactory investment.
In our view, the IRA’s domestic content structure has permanently altered the geography of gigafactory investment — shifting capital into US greenfield projects. In October 2024, LG Energy Solution secured supply agreements totaling 160 GWh from top global automakers, validating that OEM-driven demand now requires purpose-built gigafactory commitments across multiple regions simultaneously.
Government renewable energy targets across the G20 drive a parallel demand signal from grid-scale ESS procurement — separate from EV demand but served by the same gigafactory capacity. Utility developers in Europe and North America are now signing multi-year ESS offtake agreements that reduce single-customer concentration risk and improve project financing terms for new gigafactory builds.
Restraints
Gigafactory Cost per GWh North America vs China Gap
Building a gigafactory in North America costs about USD 100 million per GWh, versus about USD 72 million per GWh in China — a 39% cost premium that compounds across multi-GWh facilities into billions in additional capital before a single cell is produced. This gap directly constrains the financial returns of IRA-supported projects and slows non-Chinese gigafactory investment decisions.
Northvolt AB‘s collapse illustrates the financial risk in European gigafactory development. The company filed for Chapter 11 in November 2024 with USD 5.84 billion in debt, securing only USD 145 million in cash collateral and USD 100 million in DIP financing from Scania. Any new market entrant without secured long-term offtake must treat this capital mismatch as a direct risk warning.
Raw material price volatility — particularly in lithium carbonate, nickel, and cobalt — creates margin compression risk for gigafactory operators running long-term fixed-price supply contracts. Lower lithium carbonate prices through 2024 forced product price reductions across the Tier 1 supplier base, showing that input cost exposure remains a structural restraint even at the top tier of global gigafactory scale.
Growth Factors
Grid-Scale ESS Contracts Signal New Gigafactory Revenue Stream
Grid-scale energy storage demand creates a new revenue category for gigafactory operators that reduces dependence on automotive cycles. In March 2025, LG Energy Solution signed an agreement with Poland’s PGE to supply 981 MWh of grid-scale ESS batteries between 2026 and 2027 — the first grid-scale ESS output from its Poland facility.
Solid-state battery gigafactory investment is moving from pilot to early commercial scale. In January 2025, ProLogium Technology secured construction permits for its Dunkirk, France gigafactory — mass production of 4th-generation solid-state batteries scheduled from 2028, ramping to 4 GWh by 2029 — bringing solid-state gigafactory output into the active market pipeline before the end of the forecast period.
Joint venture structures between automotive OEMs and battery cell producers are reducing individual project risk and accelerating gigafactory permitting timelines. The JV model — proven by Ultium Cells, BlueOval SK, and the CATL–Stellantis Zaragoza partnership — has become the default structure for large-scale gigafactory development outside Asia-Pacific, where independent developer financing alone cannot reach construction close.
Emerging Trends
Battery Gigafactory Automation and Digitalization Accelerates
Digital twin and AI-driven process control systems are now standard specifications in new gigafactory builds, reducing electrode coating defect rates and improving cell formation yield — the two highest-cost quality failure points in lithium-ion production. Honeywell‘s Battery Manufacturing Excellence Platform (Battery MXP) integrates real-time quality data across all gigafactory production stages, enabling predictive yield adjustment before batch failures occur.
Next-generation fast-charging battery platforms are setting new gigafactory process requirements. In September 2024, ProLogium Technology presented its film-free battery platform at the Solid-State Battery Summit in Chicago — a ceramic separator design enabling 8.5-minute fast charging from 5% to 80% SoC, verified by TÜV Rheinland — requiring distinct gigafactory line configurations from standard lithium-ion production.
Lithium-sulfur and sodium-ion chemistries are emerging as distinct gigafactory investment categories with different equipment, material sourcing, and process requirements from standard lithium-ion lines. Sodium-ion avoids lithium entirely — targeting cost reduction beyond LFP — creating a pipeline of gigafactory builds that will require new supplier ecosystems and cannot reuse existing standard lithium-ion line configurations.
Battery Gigafactory Market Key Companies Insights
Our forecast suggests CATL will extend its installed capacity lead through 2035, anchored by a 37.9% global EV battery market share in 2024. According to cnevpost.com data, CATL revenue reached RMB 362.01 billion in FY2024 — down 9.7% as lower lithium carbonate prices compressed selling prices. Volume dominance held regardless — confirming that gigafactory scale insulates market position from commodity cycles.
BYD Co., Ltd. posted RMB 777.1 billion (about USD 107.1 billion) in FY2024 revenue, up 29% year-on-year, per BYD’s Fortune Global 500 disclosure. Its vertically integrated model — covering cell, pack, and vehicle — captures margin at each stage. BYD held a 17.2% global EV battery market share in 2024, up from 15.9% in 2023, per cnevpost.com.
LG Energy Solution reported KRW 25.6 trillion (about USD 18.64 billion) in 2024 revenue, down 24.1% year-on-year, per its PR Newswire financial release. Slower European EV demand and lower selling prices drove the contraction. The company held third place globally with 96.3 GWh installed volume and a 10.8% share in 2024, per cnevpost.com.
Samsung SDI posted KRW 16.59 trillion (about USD 11.55 billion) in 2024 annual revenue, per its official earnings release. EV battery revenue declined on inventory adjustments while ESS revenue hit a record high in Q4 2024, driven by UPS and data center demand. The ESS offset confirms that gigafactory revenue diversification beyond automotive is no longer optional for Tier 1 operators.
Key Companies
- CATL (Contemporary Amperex Technology Co., Ltd.)
- BYD Co., Ltd.
- LG Energy Solution
- Panasonic
- Samsung SDI
- SK On (SK Innovation)
- Gotion High-Tech
- CALB (China Aviation Lithium Battery)
- EVE Energy
- Tianjin Lishen Battery
- Tesla
- Envision AESC
- Northvolt
- ACC (Automotive Cells Company)
- Verkor
- Solid Power
- Clarios
Recent Development
Key Battery Gigafactory Developments from 2024 to 2025
- August 2025 — Lyten entered a binding agreement to acquire all remaining Northvolt assets in Sweden and Germany — including Northvolt Ett, Northvolt Labs, Northvolt Drei, and all Northvolt IP — with an asset book value of about USD 5 billion, positioning Lyten as the inheritor of Europe’s most advanced independent battery manufacturing base.
- July 2025 — Lyten acquired Northvolt Dwa in Gdańsk, Poland — Europe’s largest BESS manufacturing facility at 25,000 square meters with up to 6 GWh capacity — completed October 2025, extending Lyten’s European lithium-sulfur gigafactory footprint.
- July 2025 — Lyten secured more than USD 200 million in additional equity investment from existing investors, bringing total investment to over USD 625 million, to fund its ongoing gigafactory acquisition and build-out strategy.
- March 2025 — Northvolt AB filed for full bankruptcy in Sweden after failing to secure rescue financing — marking the end of operations for Europe’s most prominent independent battery cell manufacturer and removing about USD 5.84 billion in planned capacity from the European pipeline.
- November 2024 — Lyten acquired Northvolt‘s Cuberg battery manufacturing facility in San Leandro, California — 119,000 square feet — to scale lithium-sulfur battery production in North America.
- October 2024 — Lyten announced plans to invest more than USD 1 billion to build the world’s first lithium-sulfur battery gigafactory near Reno, Nevada, targeting up to 10 GWh annual capacity with Phase 1 scheduled for 2027.
Related Battery Gigafactory Markets
The battery gigafactory market connects to a set of adjacent sub-markets — each defined by a distinct chemistry, geography, value-chain stage, or ownership model — that represent independent investment and research categories. Decisions made in the core gigafactory market directly shape demand, cost structures, and competitive dynamics across every related segment listed below.
Key Related Markets
- Sodium-Ion Battery Gigafactory Market
- Solid-State Battery Gigafactory Market
- Battery Gigafactory EPC Market
- Battery Gigafactory Workforce and Skilled Labor Market
- Battery Recycling Gigafactory Market
- LFP Battery Gigafactory Market
- Europe Battery Gigafactory Market
- Battery Raw Material Supply Chain Market
- China Battery Gigafactory Market
- Battery Gigafactory Pipeline Tracker
Sodium-Ion Battery Gigafactory Market. Sodium-ion chemistry eliminates lithium from the cell entirely, targeting stationary storage applications where energy density requirements are lower than EV use — creating a distinct gigafactory segment with different electrode materials, electrolyte sourcing, and equipment vendors from standard lithium-ion lines.
Solid-State Battery Gigafactory Market. Solid-state gigafactories require fundamentally different manufacturing processes — including ceramic separator handling and solvent-free electrode production — with ProLogium’s Taoyuan plant demonstrating that commercial-scale solid-state cell production is now technically achievable at 0.5–2 GWh initial capacity before full gigafactory ramp.
Battery Gigafactory EPC Market. Engineering, procurement, and construction for gigafactories represents a distinct addressable segment, with North American build costs running about USD 100 million per GWh versus USD 72 million per GWh in China — a cost gap that shapes EPC contractor selection, local content requirements, and project financing structures globally.
Battery Gigafactory Workforce and Skilled Labor Market. Global gigafactory output surpassed 867 GWh in 2024, driving rapid workforce scaling demand for electrode engineers, cell formation technicians, and quality control specialists — a talent bottleneck that constrains ramp speed at new facilities independent of capital availability or equipment delivery timelines.
Battery Recycling Gigafactory Market. Battery recycling and refurbishment represents a named sub-segment within gigafactory area-of-application classification, and is emerging as a standalone investment category as first-generation EV batteries approach end-of-life — creating demand for black mass processing facilities co-located with or adjacent to active cell production sites.
LFP Battery Gigafactory Market. LFP chemistry has become the dominant investment direction for new large-scale gigafactory JVs — as demonstrated by the CATL–Stellantis €4.1 billion Zaragoza facility and LG Energy Solution’s 39 GWh LFP CTP deal with Renault — creating a sub-market defined by distinct cathode sourcing, formation protocols, and cycle-life economics.
Europe Battery Gigafactory Market. Northvolt’s full bankruptcy in March 2025 removed the continent’s leading independent cell producer and exposed structural financing risk in European gigafactory development, reducing the active pipeline from over 1,193 GWh of planned capacity to just over 1 TWh — reshaping European OEM battery sourcing strategy through 2030.
Battery Raw Material Supply Chain Market. China controls over 75% of global lithium-ion battery production capacity as of 2024, anchoring raw material processing and cell chemistry supply chains in a single geography — creating concentration risk that is now a primary driver of gigafactory siting decisions in North America, Europe, and India.
China Battery Gigafactory Market. China’s domestic gigafactory base produced the vast majority of the 867.8 GWh global EV battery cell output recorded in 2024, with CATL alone holding a 37.9% global installed volume share — making China’s domestic overcapacity risk and policy environment the single most influential variable in global battery pricing through 2030.
Battery Gigafactory Pipeline Tracker. Benchmark Mineral Intelligence’s Gigafactory Assessment is the only named proprietary tracker monitoring the global GWh pipeline by project, region, chemistry, and investment stage — providing the foundational data layer that underpins gigafactory capacity forecasts, investment pipeline analysis, and regional supply gap assessments across the forecast period.
Market Scope
| Report Features | Description |
|---|---|
| Market Value (2025) | USD 68.6 Billion |
| Forecast Revenue (2035) | USD 604.00 Billion |
| CAGR (2026–2035) | 24.3% |
| Base Year for Estimation | 2025 |
| Historic Period | 2020–2024 |
| Forecast Period | 2026–2035 |
| Report Coverage | Revenue Forecast, Market Dynamics, Competitive Landscape, Recent Developments |
| Segments Covered | By Battery Type (Lead-Acid Batteries, Lithium-Ion Batteries, Nickel-Based Batteries, Solid-State Batteries, Sodium-Ion Batteries), By Capacity Scale (Large-Scale Gigafactories >30 GWh, Medium-Scale Gigafactories 10–30 GWh, Small-Scale Gigafactories <10 GWh), By Production Process (Wet Processing, Dry Processing, Hybrid Processing), By Application (Electric Vehicles, Energy Storage Systems, Consumer Electronics, Industrial Equipment & Telecom Backup, Defense & Aerospace, Residential Storage Systems), By Industry Vertical (Automotive Manufacturers, Battery OEMs, Utility & Energy Storage Companies, Consumer Electronics OEMs, Industrial Power System Providers, Aerospace & Defense), By Area of Application (Battery Testing & Quality Control, Cell Production, Module Production, Pack Production, Recycling & Refurbishment), By Ownership Structure (Standalone, Joint Venture, Government-Owned / State-Backed), By Facility Type (Greenfield, Brownfield), By Cell Format (Cylindrical, Prismatic, Pouch), By Integration (Vertically Integrated, Cell-Only Manufacturing, Pack Assembly) |
| Regional Analysis | North America (US and Canada), Europe (Germany, France, The UK, Spain, Italy, and Rest of Europe), Asia Pacific (China, Japan, South Korea, India, Australia, and Rest of APAC), Latin America (Brazil, Mexico, and Rest of Latin America), Middle East & Africa (GCC, South Africa, and Rest of MEA) |
| Competitive Landscape | CATL (Contemporary Amperex Technology Co., Ltd.), BYD Co., Ltd., LG Energy Solution, Panasonic, Samsung SDI, SK On (SK Innovation), Gotion High-Tech, CALB (China Aviation Lithium Battery), EVE Energy, Tianjin Lishen Battery, Tesla, Envision AESC, Northvolt, ACC (Automotive Cells Company), Verkor, Solid Power, Clarios |
| Customization Scope | Customization for segments, region/country-level will be provided. Moreover, additional customization can be done based on the requirements. |
| Purchase Options | We have three licenses to opt for: Single User License, Multi-User License (Up to 5 Users), Corporate Use License (Unlimited User and Printable PDF) |