

Market Verdict
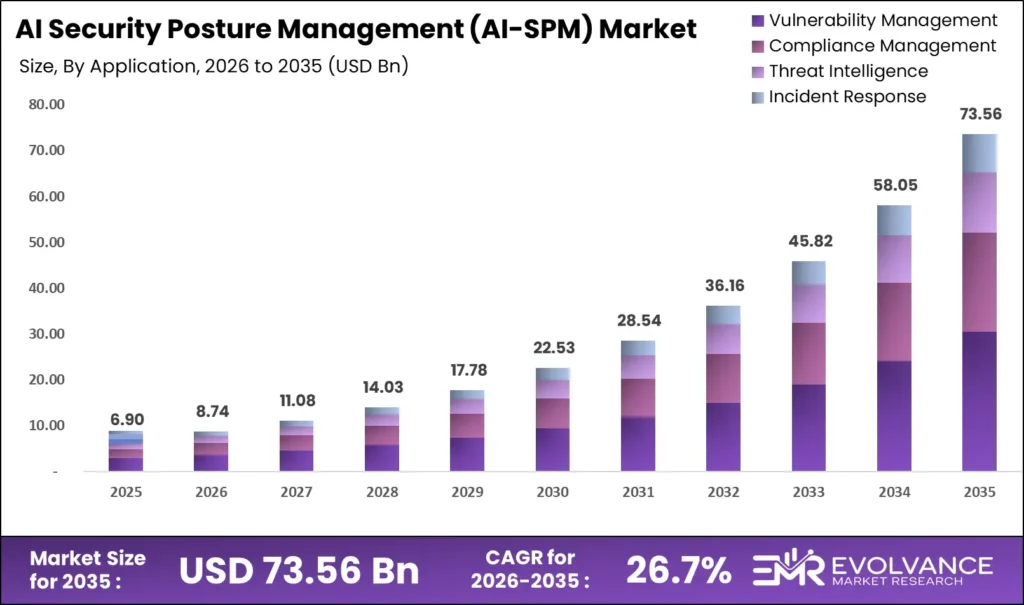
The AI Security Posture Management (AI-SPM) Market is not a derivative of conventional cybersecurity spending; it is a structurally distinct category created by the gap between enterprise AI adoption velocity and security governance maturity. AI Security Posture Management (AI-SPM) Market size is USD 6.9 billion in 2025; the market is projected to reach USD 8.74 billion in 2026 and USD 73.56 billion by 2035, expanding at a 26.7% CAGR, according to EMR. Organizations that treat AI-SPM as an optional overlay rather than a foundational control layer will face compounding breach costs and regulatory exposure that no post-incident remediation budget can absorb.
Key Takeaways
Market Size:
- Market size: USD 6.9 billion as of 2025
- Market size in 2026: USD 8.74 billion
- Market size in forecast year: USD 73.56 billion by 2035
- CAGR: 26.7% over 2025 to 2035
Dominant Segments:
- Component: AI Asset Discovery & Inventory at 37.5% as of 2025
- Deployment Mode: Cloud-Based at 65.2% as of 2025
- Application: Vulnerability Management at 41.5% as of 2025
- Organization Size: Large Enterprises at 52.2% as of 2025
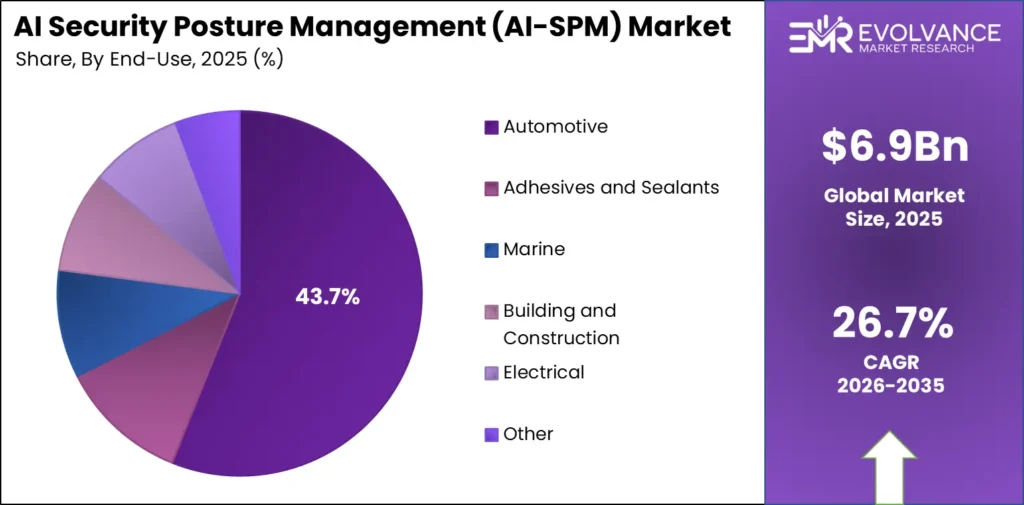
- End-User Industry: BFSI at 36.8% as of 2025
Dominant Region:
- Leading region: North America at 44.9% as of 2025
Source: EMR
Market Overview
AI Security Posture Management Market governs the discovery, assessment, and continuous protection of AI assets across enterprise environments: models, datasets, APIs, agents, and increasingly MCP server infrastructure. BFSI institutions, healthcare networks, telecommunications carriers, and hyperscale cloud operators depend on it to maintain auditability and control over AI systems that operate at machine speed without human review at every decision point.
To produce this analysis, our EMR research team conducted structured primary interviews across vendor, enterprise buyer, and regulatory advisory segments, supplemented by secondary data drawn from regulatory filings, earnings disclosures, and published cybersecurity incident databases. The study covered 2020 to 2035 across North America, Europe, Asia Pacific, and other global regions. Data validation applied triangulation across three independent source types before any figure was accepted into the model.
The purchase trigger for AI-SPM is no longer aspirational; it is incident-driven. Security and risk teams buy when shadow AI assets surface in post-breach forensics, when compliance officers receive EU AI Act enforcement notices, or when a board-level audit reveals uncontrolled model proliferation. Organizations that delay face a compounding exposure: each unmanaged model adds both attack surface and regulatory liability simultaneously.
Training compute for notable AI models has been doubling approximately every five months, per Stanford HAI, while datasets double every eight months, compressing the window between model deployment and model risk. Almost 40% of global employment is exposed to AI, reaching approximately 60% in advanced economies, per the IMF, meaning AI system failures now carry workforce-scale consequences. For investors, the structural case rests on the impossibility of reversing AI adoption, not on whether enterprises choose to prioritize security.
What Is Actually Driving This Market
Shadow AI proliferation has become the single most measurable cost driver in enterprise security budgets. IBM’s 2025 breach study found that 20% of organizations experienced breaches directly connected to shadow AI, adding up to USD 670,000 to the average breach cost per incident. The causal mechanism is asset invisibility: AI tools deployed outside sanctioned procurement processes bypass access controls, creating unmonitored data flows that conventional security tooling cannot detect. For operators, eliminating shadow AI exposure requires discovery capability before any posture management intervention is even possible.
Regulatory mandate is converting AI security from discretionary spend to procurement necessity, with the causal mechanism running through penalty structures that exceed typical security budget lines. The EU AI Act, enforced by the European Commission, permits fines of up to EUR 35 million or 7% of worldwide annual turnover for violations involving prohibited AI practices as of 2025. U.S. state-level AI legislation expanded from 49 laws in 2023 to 131 in 2024, per Stanford HAI. For investors, regulatory acceleration compresses the sales cycle for certified AI-SPM solutions from multi-year evaluations to near-term budget authorizations.
Documented AI security incidents are scaling faster than enterprise response capacity, creating a demand pull that vendor supply cannot yet match. Reported AI-related incidents reached a record 233 in 2024, a 56.4% increase from 2023, per Stanford HAI. Private investment in generative AI reached USD 33.9 billion in 2024, up 18.7% from 2023 and more than 8.5 times the 2022 level, per Stanford HAI, expanding the attack surface proportionally to funding inflows. For investors, the ratio of incident growth to solution maturity defines the near-term pricing power window for established AI-SPM vendors.
The single most important driver insight: breach cost asymmetry makes AI-SPM ROI calculable, not aspirational.
- Shadow AI breaches add up to USD 670,000 per incident above baseline breach cost, per IBM 2025
- Global average data breach cost reached USD 4.88 million in 2024, up 10% from 2023, per IBM
- Corporate investment in AI reached USD 252.3 billion in 2024, per Stanford HAI, expanding insurable AI asset bases
- Infostealer malware exposed more than 300,000 ChatGPT credentials globally during 2025, per IBM, signaling AI credential theft as an emergent attack vector
For investors, vendors with quantifiable breach-cost reduction case studies command premium pricing and shorter procurement cycles than those selling posture alone.
Virtue AI’s USD 30 million seed and Series A raise in April 2025 to expand its AI security and compliance platform signals that early-stage capital is concentrating in vendors that bridge security and compliance in a single workflow, rather than treating them as separate product lines. This points to a market expectation that unified governance platforms will capture disproportionate enterprise wallet share as regulatory pressure intensifies across both dimensions simultaneously.
Where The Real Risk Is
The talent constraint is structural, not cyclical. Severe shortages in cross-functional AI compliance expertise impede broad AI-SPM implementation as organizations struggle to satisfy evolving NIST and EU AI Act requirements simultaneously in 2025. The risk is correlational with adoption pace rather than causally linked to any single vendor gap: no amount of platform capability compensates for an absence of qualified practitioners to configure, interpret, and act on AI posture findings. For investors, this creates ceiling risk on total addressable market penetration even as nominal demand grows.
Governance gaps at the implementation layer threaten to commoditize AI-SPM before enterprise value is fully extracted. ENISA’s 2024 cybersecurity report incorporated 188 incidents from 26 EU member states and two EFTA countries, establishing baseline incident density across regulated markets. Only 6% of organizations maintain advanced guardrails for secure AI deployment, per Palo Alto Networks 2025 data, meaning the overwhelming majority of AI-SPM deployments remain at shallow posture levels rather than deep behavioral governance. For operators, surface-level compliance deployments without runtime behavioral analytics leave the highest-value attack vectors unaddressed.
The risk most investors underestimate: governance immaturity limits expansion revenue even within existing accounts.
- Only 37% of breached organizations had AI approval or oversight processes in place as of 2025, per IBM, indicating governance infrastructure lags posture tooling adoption
- 97% of organizations reporting AI-related breaches lacked proper AI access controls as of 2025, per IBM, exposing the limits of perimeter-only AI-SPM deployments
- Customer PII was compromised in 65% of shadow-AI breaches versus 53% across all breaches as of 2025, per IBM, creating specific liability exposure for data-intensive industries
Watch for rising enterprise churn rates among AI-SPM vendors as the signal that shallow deployments are failing to prevent repeat incidents in the same account base.
Segmentation: Where Value Is Concentrating
Component Insights
AI Asset Discovery & Inventory Pulls Ahead: 37.5% Share in 2025
AI Asset Discovery & Inventory holds a 37.5% component share as of 2025, per EMR analysis, because no downstream posture activity, scanning, monitoring, or remediation, is executable without a complete asset register. Enterprise buyers across BFSI, healthcare, and telecommunications prioritize discovery first; the inability to enumerate shadow AI assets before a breach is the most common root-cause finding in post-incident reviews. For investors, discovery capability is the entry wedge that expands into higher-margin monitoring and remediation revenue over time.
| Sub-segment | Share % | Primary Driver | Outlook |
|---|---|---|---|
| AI Asset Discovery & Inventory | 37.5% | Shadow AI proliferation, regulatory asset enumeration mandates | Lead position likely sustained as MCP server cataloging demand scales |
| AI-Specific Vulnerability Scanning | 23.8% | LLM dependency complexity, container security requirements | Growth driven by expanding LLM supply chain audit requirements |
| Runtime Monitoring & Behavioral Analytics | 20.4% | Prompt injection threat surface, real-time anomaly detection demand | Fastest technical evolution as agentic AI behavioral analysis matures |
| Policy Enforcement & Automated Remediation | 18.3% | Governance automation demand, EU AI Act enforcement timelines | Consolidation pressure as discovery and monitoring vendors integrate remediation |
Deployment Mode Insights
The 65.2% Story: How Cloud-Based Took the Lead in 2025
Cloud-Based deployment commands 65.2% share as of 2025, per EMR research, because enterprise AI workloads are overwhelmingly concentrated on Azure, AWS, and GCP, where centralized security recommendations and attack-path analysis integrate directly into existing cloud governance workflows. Hybrid and on-premises deployments serve regulated industries where data residency requirements prevent full cloud migration. For operators, cloud-native AI-SPM deployment accelerates time-to-value by eliminating infrastructure provisioning overhead that delays on-premises rollouts by months.
Application Insights
Vulnerability Management at 41.5%: What’s Behind the Numbers in 2025
Vulnerability Management captures 41.5% of application spend as of 2025, per EMR analysis, driven by the combination of AI model risk identification, misconfiguration detection, and prompt vulnerability assessment that organizations cannot address with conventional application security tooling. The Internet Security Market and Security Analytics Market both feed requirements into AI-SPM vulnerability workflows, creating cross-category demand that generic SAST or DAST tools cannot satisfy. For investors, vulnerability management is the highest-volume entry point but faces margin compression as platform vendors bundle it into broader posture suites.
Organization Size Insights
Inside Large Enterprises’ 52.2% Share Advantage
Large Enterprises account for 52.2% of AI-SPM spend as of 2025, per EMR, reflecting both greater AI asset density and the higher regulatory scrutiny they attract from bodies like the European Commission and U.S. state legislatures. Medium and small enterprises represent a structurally underpenetrated segment where discovery tooling adoption lags governance requirements. For operators targeting SME expansion, pricing architecture that scales down without feature degradation is the primary commercial barrier to overcome.
End-User Industry Insights
BFSI Tops the Field with 36.8% in 2025
BFSI commands 36.8% of end-user industry spend as of 2025, per EMR, because AI-driven fraud detection systems, identity verification infrastructure, and regulatory compliance management create overlapping AI asset footprints that require continuous posture oversight. The Quantum-Safe Cryptography market is creating adjacent pressure as financial institutions begin planning AI-BOM audits that intersect with PQC Cryptographic Asset Discovery Software requirements. For operators serving BFSI, the ability to integrate AI-SPM with existing financial compliance frameworks is a procurement prerequisite, not a differentiator.
| Sub-segment | Share % | Primary Driver | Outlook |
|---|---|---|---|
| BFSI | 36.8% | Fraud detection AI security, regulatory compliance density | Continued leadership as AI-driven financial crime tools scale |
| IT and Telecommunications | 25.6% | Generative AI application security, network operations AI monitoring | Growth accelerating with generative AI tool proliferation |
| Healthcare | 22.3% | Patient data exposure, AI diagnostics governance requirements | Expansion driven by AI diagnostics regulatory oversight tightening |
| Others | 14.3% | Cross-sector AI adoption spillover | Fragmented; growing as AI penetrates manufacturing and public sector |
Segments Covered In This Report
By Component
- AI Asset Discovery & Inventory
- AI-Specific Vulnerability Scanning
- Runtime Monitoring & Behavioral Analytics
- Policy Enforcement & Automated Remediation
By Deployment Mode
- Cloud-Based
- Hybrid
- On-Premises
By Application
- Vulnerability Management
- Compliance Management
- Threat Intelligence
- Incident Response
By Organization Size
- Large Enterprises
- Medium Enterprises
- Small Enterprises
By End-User Industry
- BFSI
- IT and Telecommunications
- Healthcare
- Others
Value is concentrating at the intersection of cloud-native deployment and large enterprise vulnerability management workflows, where per-seat economics and integration depth create durable switching costs. Embedded Analytics capabilities within AI-SPM platforms are fragmenting the lower end of the market, as lightweight posture dashboards compete with full-stack governance suites for SME budget. For investors, the platform consolidation thesis favors vendors that connect discovery, scanning, and runtime monitoring in a single data model rather than those offering point solutions in any one component segment.
Regional Analysis: Where Geography Creates Advantage
North America holds a 44.9% regional share as of 2025, per EMR, anchored by the concentration of hyperscale cloud infrastructure, the largest enterprise AI adopter base globally, and the most advanced regulatory enforcement environment outside the EU. U.S. state-level AI legislation and NIST AI Risk Management Framework adoption create procurement requirements that make AI-SPM a compliance necessity rather than a discretionary investment. For investors, North America is the highest-margin market but also the most contested, with Microsoft, AWS, Google, Palo Alto Networks, and CrowdStrike competing across overlapping platform architectures.
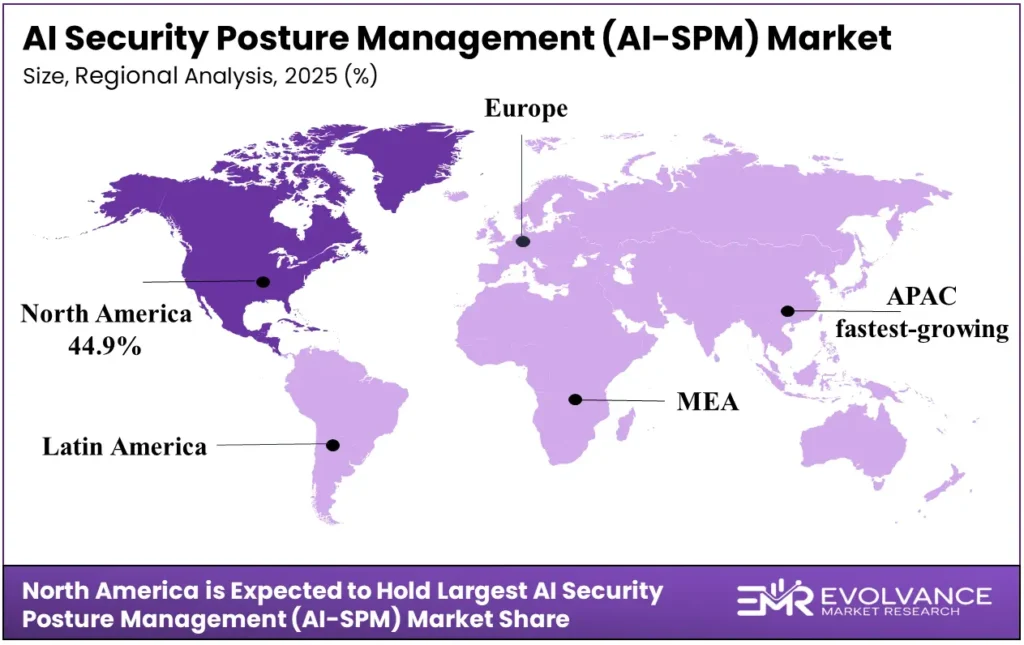
Asia Pacific is the fastest-growing regional market, per EMR analysis, driven by China’s dominance in generative AI patent-family publications, accounting for almost 70% of worldwide output between 2014 and 2023, per WIPO. Rapid enterprise AI adoption across financial services, telecommunications, and manufacturing in China, Japan, South Korea, and India is generating AI asset complexity that exceeds existing security governance frameworks in most markets. For operators entering Asia Pacific, localization of compliance mapping to country-specific AI regulations is a prerequisite for enterprise procurement, not a post-sales customization.
Europe’s AI-SPM demand is structurally driven by EU AI Act enforcement timelines rather than organic AI adoption pace alone. AI adoption among EU enterprises with at least 10 employees reached 13.5% in 2024, up 5.5 percentage points from 8.0% in 2023, per Eurostat, creating a rapidly expanding regulated AI asset base. Cloud service adoption reached 45.2% among EU businesses in 2023, up 4.2 percentage points from 2021, per the European Commission, establishing the cloud deployment infrastructure that AI-SPM solutions require.
ENISA’s 2025 Threat Landscape examined 4,875 cybersecurity incidents from July 2024 through June 2025, providing the incident density baseline that is shaping EU enterprise security procurement priorities. For investors, Microsoft’s USD 400 million infrastructure investment in Switzerland in June 2025 and AWS’s planned EUR 7.8 billion European Sovereign Cloud investment, scheduled to launch by end of 2025, signal hyperscaler commitment to European AI infrastructure that will anchor demand for cloud-native AI-SPM solutions.
| Region | Share % | USD Value | Key Driver | Strategic Signal |
|---|---|---|---|---|
| North America | 44.9% | Estimated USD 3.1B (2025) | NIST AI RMF, state AI legislation expansion | Platform consolidation accelerating among hyperscaler-aligned vendors |
| Asia Pacific | Fastest-growing | Expanding | Generative AI patent volume, rapid enterprise AI deployment | Localized compliance mapping is market entry prerequisite |
| Europe | Significant | Expanding under EU AI Act enforcement | EU AI Act enforcement, cloud infrastructure buildout | Hyperscaler sovereign cloud investment anchors cloud-native AI-SPM demand |
Competitive Landscape: Who Is Pulling Ahead And Why
Microsoft, Google, and AWS hold a structural advantage no mid-market AI-SPM vendor can replicate in the near term: native integration between AI development infrastructure and security posture tooling within a single commercial relationship. Microsoft’s FY2025 Azure revenue exceeded USD 75 billion, growing 34%, and Palo Alto Networks generated USD 9.2 billion in FY2025 revenue with Next-Generation Security ARR growing 32% to USD 5.6 billion, per company disclosures. For investors, hyperscaler-affiliated AI-SPM capabilities compress addressable market for standalone vendors but cannot eliminate the demand for vendor-neutral posture governance.
The most aggressive challengers are agentic-era specialists targeting the runtime monitoring and non-human identity segments that hyperscaler platforms address inadequately. Several well-capitalized entrants have emerged from stealth specifically to address AI agent discovery and runtime control gaps that neither conventional CNAPP vendors nor cloud-native security tools cover. IBM’s USD 62.8 billion in full-year 2024 revenue provides the consulting and integration infrastructure that enterprise buyers require alongside platform tooling. For operators, the choice between hyperscaler-native and independent AI-SPM determines both integration speed and long-term vendor leverage in renewal negotiations.
Market structure is consolidating at the top and fragmenting at the bottom. Capsule Security entered the runtime AI agent control market with financing in 2026, while Tenet Security launched a platform for AI agent simulation and protection with seed funding the same year, reflecting continued entry at the specialist layer.
Promptfoo’s Series A in July 2025 specifically targeted AI security testing and red-teaming, a segment that established vendors have not fully addressed. Exaforce’s USD 75 million Series A in April 2025 for an agentic AI security platform signals that institutional capital is backing full-stack challengers, not just point-solution specialists. For investors, the consolidation window favors acquiring specialist runtime and identity vendors before hyperscalers absorb that capability organically.
| Company | Market Position | Key Advantage | Recent Move |
|---|---|---|---|
| Microsoft | Hyperscaler leader | Azure-native AI security integration, USD 75B+ cloud revenue base | Continued AI security capability expansion within Azure platform |
| Palo Alto Networks | Established security leader | Next-Gen Security ARR at USD 5.6B; AI attack path analysis tooling | Comprehensive AI-SPM integration within SASE and CNAPP portfolio |
| IBM | Enterprise consulting anchor | Integration of AI security within consulting delivery at enterprise scale | AI governance research publishing driving enterprise buyer awareness |
| CrowdStrike | Runtime protection leader | Behavioral analytics depth; AI attack path analysis capability | AI-SPM capability expansion within Falcon platform |
| Orca Security | Cloud-native challenger | Agentless architecture; MCP server and third-party AI tool detection | Autonomous investigation agents and runtime AI threat detection launched |
| Obsidian Security | Non-human identity specialist | AI agent identity security focus; significant Series D capital position | Series D raise to scale AI agent security capabilities |
Key Players In This Report
- Microsoft Corporation
- IBM Corporation
- Palo Alto Networks, Inc.
- Amazon Web Services, Inc.
- Google LLC
- Cisco Systems, Inc.
- CrowdStrike Holdings, Inc.
- Zscaler, Inc.
- SentinelOne, Inc.
- Check Point Software Technologies Ltd.
- Fortinet, Inc.
- Trend Micro Incorporated
- Orca Security Ltd.
- Tenable Holdings, Inc.
- Sysdig, Inc.
- Varonis Systems
- Zenity
- Straiker
- Obsidian Security
- AQtive Guard
Where This Market Goes Next
Agentic AI deployment at enterprise scale is the activation condition for the next demand surge in runtime behavioral analytics and non-human identity governance. As AI agents autonomously execute multi-step workflows across enterprise systems, the behavioral monitoring gap between what posture tools record and what agents actually do in production widens to a level that static vulnerability scanning cannot address. Vendors with continuous model monitoring and agent action containment capabilities, a category where recent specialist entrants are concentrating, are best positioned to capture this segment before hyperscalers integrate equivalent functionality. For operators, deploying agentic runtime controls before agent proliferation exceeds governance capacity is the operative window through 2027.
Mandatory AI Bill of Materials generation is transitioning from a voluntary best practice to an audit requirement across multiple regulatory jurisdictions simultaneously. The 2026 EU AI Act enforcement timeline creates a hard deadline that converts AI-BOM capability from a differentiator to a procurement prerequisite. BlinkOps’ USD 50 million Series B in July 2025, bringing total funding to USD 90 million, and Astrix Security’s USD 45 million Series B in August 2025 targeting human and non-human identity security, both signal capital positioning ahead of this enforcement wave. For operators, AI-BOM tooling integrated with existing software asset management workflows reduces compliance preparation time by eliminating duplicate data collection across security and legal teams.
Integration of AI-SPM within SASE infrastructure opens deployment channels that bypass traditional security procurement processes entirely. The convergence of the Internet Security Market, the Quantum-Safe Cybersecurity Market, and AI posture governance within unified network security platforms gives SASE-positioned vendors a distribution advantage that point-solution AI-SPM providers cannot match at equivalent sales cost. This trend is correlational with enterprise SASE adoption rates rather than causally proven at scale, and the data suggests consolidation will accelerate as enterprises rationalize security vendor counts. For operators, evaluating AI-SPM procurement within existing SASE renewal cycles rather than as a standalone initiative reduces implementation friction and total cost of ownership.
| Condition | Timeline | Upside | Who Benefits |
|---|---|---|---|
| Agentic AI deployment reaches enterprise scale | 2025 to 2027 | Runtime behavioral analytics segment expansion; new identity governance spend | Runtime monitoring specialists; non-human identity vendors |
| EU AI Act enforcement activates AI-BOM mandates | 2026 | Compliance management application share growth; AI-BOM platform adoption | Integrated governance platform vendors; audit-ready AI-SPM providers |
| AI-SPM consolidates within SASE infrastructure | 2026 to 2028 | Distribution channel expansion; reduced standalone AI-SPM procurement | SASE-integrated vendors; hyperscaler-affiliated security platforms |
Key Developments
- August 2026: Obsidian Security raised USD 85 million in Series D financing to expand security for non-human identities and AI agents. This signals institutional conviction that AI agent identity governance is a standalone product category, not a feature bolt-on within existing IAM platforms.
- March 2026: Onyx Security launched an AI control-plane platform with USD 40 million in funding, providing AI-agent discovery, posture management, governance, and runtime protection including support for MCP environments. This signals the emergence of MCP server security as a distinct requirement within enterprise AI-SPM procurement.
- April 2026: Trent AI emerged from stealth with a USD 13 million seed round, with a platform continuously scanning code, infrastructure, dependencies, AI agents, and runtime behavior. This signals demand for unified scan coverage across the full AI development and deployment lifecycle.
- March 2026: Orca Security introduced autonomous investigation agents, real-time detection of AI use, remediation workflows, and code-reachability analysis, with runtime capability identifying interactions with AI models, MCP servers, and third-party AI tools. This signals that cloud-native security vendors are repositioning as full-stack AI-SPM providers, not just cloud posture tools.