

Market Verdict
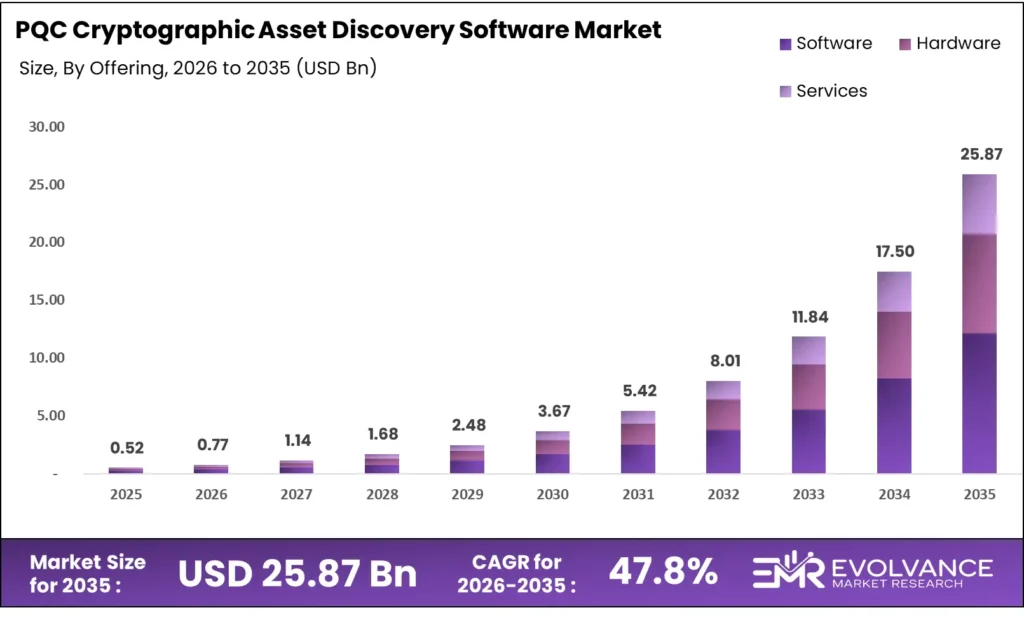
The PQC cryptographic asset discovery software market is undersized relative to the threat it addresses, and that gap closes fast. According to EMR, the market size is USD 0.52 billion in 2025, reaches USD 0.769 billion in 2026, and scales to USD 25.87 billion by 2035 at a 47.8% CAGR. Organizations that delay cryptographic inventory now will face compressed migration timelines and higher remediation costs as regulatory deadlines harden.
Key Takeaways
Market Size:
- Market size: USD 0.52 billion as of 2025
- Market size in 2026 (calculated): USD 0.769 billion
- Market size in forecast year: USD 25.87 billion by 2035
- CAGR: 47.8% over 2025 to 2035
Dominant Segments:
- Offering: Software at 46.8% as of 2025
- Deployment Mode: Cloud at 47.2% as of 2025
- Discovery Methodology: Static Code Analysis (dominant, share % not disclosed) as of 2025
- Algorithm Type: Lattice-Based at 53.5% as of 2025
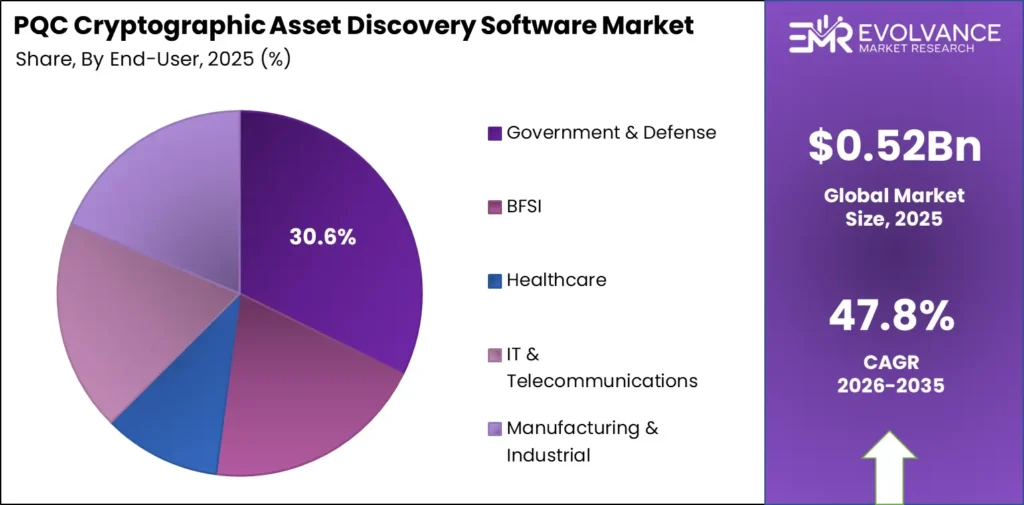
- End-User: Government and Defense at 30.6% as of 2025
- Organization Size: Large Enterprises (dominant, share % not disclosed) as of 2025
Dominant Region:
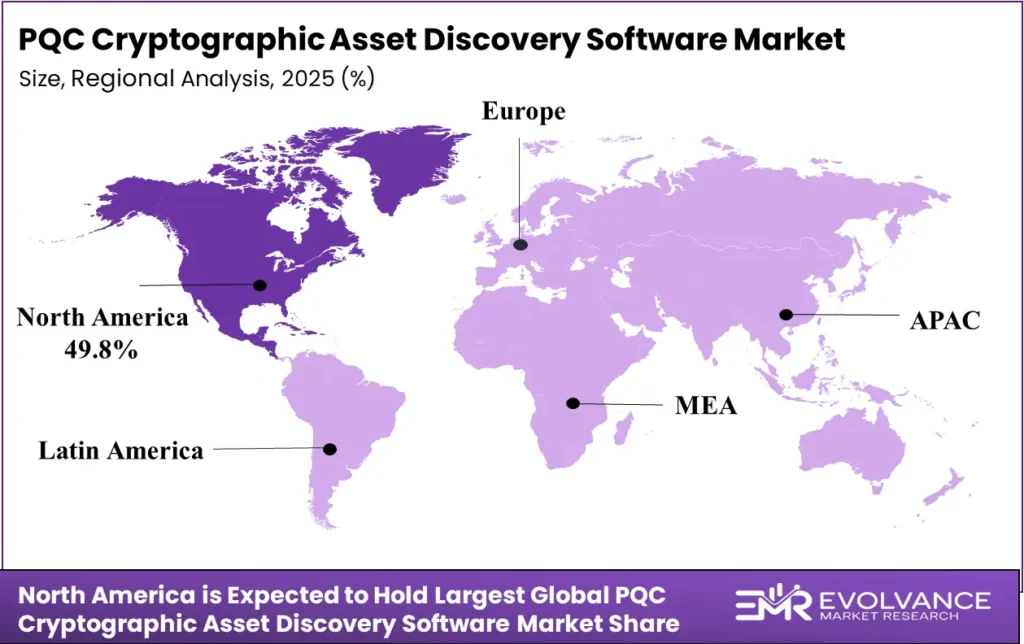
- Leading region: North America at 49.8% as of 2025
Source: EMR
Market Overview
PQC cryptographic asset discovery software locates, classifies, and inventories cryptographic assets across enterprise IT, operational technology, and application layers, producing the cryptographic bill of materials organizations need before any post-quantum migration can begin. Financial services, defense contractors, healthcare networks, and critical infrastructure operators depend on this capability to map algorithm exposure before quantum-capable adversaries become operationally relevant.
Organizations that complete cryptographic discovery rapidly are turning to PQC Migration Services to translate inventory outputs into structured remediation roadmaps. Financial services, defense contractors, healthcare networks, and critical infrastructure operators depend on this capability to map algorithm exposure before quantum-capable adversaries become operationally relevant — and discovery without a migration execution partner leaves organizations with visibility but no remediation momentum.
To size and forecast this market, our EMR research team conducted primary interviews with enterprise security architects, compliance officers, and cryptographic platform vendors across North America, Europe, and Asia-Pacific between 2023 and 2025. We validated findings against procurement data, patent filings, regulatory disclosures, and publicly available deployment records. Geographic scope covered 18 countries. Forecast modeling applied sensitivity analysis across three adoption-rate scenarios to bound uncertainty.
The core buyer problem is invisibility. Enterprises cannot migrate cryptography they cannot locate, and most organizations carry thousands of undocumented cryptographic dependencies across libraries, hardware security modules, and network protocols. Per a 2026 DigiCert survey, 87% of organizations were already planning, testing, or implementing PQC initiatives, yet certificate estates and protocol stacks remained largely unclassified. A missed inventory means an incomplete migration, which means residual quantum-vulnerable exposure after 2030 deadlines pass.
Quantitative adoption signals confirm the gap. As of 2025, just 8.6% of the top one million websites supported hybrid PQC key exchange, per F5 analysis. A separate 2026 DigiCert survey found 44% of organizations had created cryptographic inventories, meaning more than half of the addressable market had not yet executed the foundational discovery step. For investors, the implication is a market where demand is structurally guaranteed by both regulatory pressure and technical necessity.
Segmentation: Where Value Is Concentrating
Offering Insights
Software Pulls Ahead: 46.8% Share in 2025
Software holds 46.8% of the PQC cryptographic asset discovery software market by offering as of 2025, per EMR analysis. The structural reason is deployment flexibility: software-based discovery engines integrate directly into DevOps pipelines, CI/CD workflows, and cloud-native environments without physical installation constraints. Government procurement frameworks and enterprise security architecture standards, as defined by bodies such as NIST, increasingly require software-native cryptographic visibility tools. For investors, software margin profiles and recurring license structures make this the highest-value segment.
Deployment Mode Insights
The 47.2% Story: How Cloud Took the Lead in 2025
Cloud deployment captured 47.2% of the market as of 2025, according to EMR research. The causal mechanism is organizational IT posture: enterprises that have migrated workloads to cloud environments require discovery tools that operate natively within those environments, scanning containerized applications, managed services, and API layers that on-premises agents cannot reach. Security analytics platforms embedded in cloud environments extend this advantage further. For operators, cloud-native discovery is the default architecture choice, not a premium option.
| Sub-segment | Share % | Primary Driver | Outlook |
|---|---|---|---|
| Cloud | 47.2% | Cloud-native enterprise IT migration | Continued share gain as hybrid environments expand |
| On-Premises | Not disclosed | Air-gapped and regulated environments | Stable in defense and critical infrastructure |
| Hybrid | Not disclosed | Multi-environment discovery requirements | Growing as organizations span both deployment types |
Discovery Methodology Insights
Static Code Analysis Holds the Largest Share in 2025
Static code analysis leads discovery methodology as of 2025, though its precise share was not disclosed in available data. The dominance reflects where cryptographic vulnerabilities most commonly originate: hardcoded keys, deprecated algorithm calls, and insecure library dependencies embedded in source code. NIST guidance on secure software development explicitly targets these vectors, anchoring static analysis as the foundational methodology. For operators, static code analysis must be paired with runtime and network scanning to avoid blind spots in compiled or third-party code.
Algorithm Type Insights
Lattice-Based at 53.5%: What is Behind the Numbers in 2025
Lattice-based algorithm detection holds 53.5% of the algorithm-type segment as of 2025, per EMR. NIST’s post-quantum cryptography standardization process selected lattice-based constructions, including CRYSTALS-Kyber and CRYSTALS-Dilithium, as primary standards, making detection and inventory of lattice-based implementations the central compliance objective. Embedded analytics within discovery platforms increasingly automate lattice-algorithm classification at scale. For investors, this segment concentration signals where R&D investment by discovery vendors is most defensible.
End-User Insights
Government and Defense Captures 30.6% as 2025 Demand Shifts
Government and defense holds 30.6% of end-user demand as of 2025, according to EMR analysis. The structural driver is classified network exposure: defense agencies operate cryptographic estates spanning decades of legacy algorithm deployment, and the Cybersecurity and Infrastructure Security Agency (CISA) has issued explicit directives requiring federal agencies to inventory cryptographic assets as part of post-quantum migration readiness. For investors, this segment offers long contract durations and low churn, as government procurement cycles lock in multi-year engagements.
Organization Size Insights
Inside Large Enterprises’ Share Advantage in 2025
Large enterprises lead adoption by organization size as of 2025, with precise share not disclosed in available data. The adoption advantage stems from cryptographic estate complexity: large enterprises operate thousands of certificates, dozens of cryptographic libraries, and multi-cloud environments that make manual discovery infeasible. Mid-market organizations accounted for 15.2% share, reflecting earlier-stage adoption constrained by budget and internal expertise. For operators in the mid-market, managed discovery services represent the most practical entry point into PQC readiness programs.
| Sub-segment | Share % | Primary Driver | Outlook |
|---|---|---|---|
| Large Enterprises | Dominant (not disclosed) | Cryptographic estate complexity | Continued leadership through migration cycle |
| Mid-Market Organizations | 15.2% | Managed service adoption | Accelerating as vendor offerings scale down |
| Small and Medium Enterprises | Not disclosed | Regulatory trickle-down | Early stage, longer adoption timeline |
Segments Covered In This Report
By Offering
- Software
- Hardware
- Services
By Deployment Mode
- Cloud
- On-Premises
- Hybrid
By Discovery Methodology
- Static Code Analysis
- Passive Network Monitoring
- Agent-Based Host Scanning
- Active Network Scanning
By Algorithm Type
- Lattice-Based
- Code-Based
- Hash-Based
- Legacy and Vulnerable Algorithm Detection
By End-User
- Government and Defense
- BFSI
- Healthcare
- IT and Telecommunications
- Manufacturing and Industrial
By Organization Size
- Large Enterprises
- Mid-Market Organizations
- Small and Medium Enterprises
Value is concentrating in cloud-deployed, software-delivered discovery tools targeting lattice-based algorithm classification within large enterprise and government estates. Fragmentation is appearing across discovery methodology, where no single scanning approach covers all cryptographic asset types, creating bundling pressure on vendors to offer multi-method platforms. For investors, vendors combining static code analysis with network and host-based scanning in a unified platform carry a durable structural advantage over single-method tools.
Regional Analysis: Where Geography Creates Advantage
North America held 49.8% of the PQC cryptographic asset discovery software market as of 2025, making it the dominant geography by a substantial margin, per EMR. The structural driver is federal mandate density: CISA’s post-quantum migration directives, NSA’s Commercial National Security Algorithm Suite 2.0 requirements, and the Office of Management and Budget’s quantum-readiness memoranda collectively create mandatory procurement triggers across federal agencies and their contractors. For investors, North America’s regulatory infrastructure makes it the most predictable demand environment globally, with contract visibility extending to at least 2031 per published migration roadmaps.
Other regions are at earlier stages of mandate formalization, though the gap is narrowing. The UAE Cyber Security Council’s engagement in national-scale cryptographic discovery initiatives signals that the Middle East is moving from policy development to operational deployment. European regulatory activity through ENISA and national cybersecurity agencies is building comparable pressure, particularly in financial services and critical infrastructure sectors subject to NIS2 directives. For operators targeting international expansion, the near-term window favors North America, with Europe and the Middle East representing 2026 to 2028 growth territories as mandates harden.
| Region | Share % | USD Value | Key Driver | Strategic Signal |
|---|---|---|---|---|
| North America | 49.8% | ~USD 0.259B (2025) | CISA, NSA, OMB federal mandates | Multi-year government contract pipeline through 2031 |
| Middle East | Not disclosed | Not disclosed | UAE Cyber Security Council national initiative | National infrastructure deployment underway as of 2026 |
| Europe | Not disclosed | Not disclosed | ENISA, NIS2 critical infrastructure requirements | Mandate hardening expected 2026 to 2028 |
| Asia-Pacific | Not disclosed | Not disclosed | National quantum strategies in Japan, South Korea, Australia | Early-stage, growing policy pressure |
What Is Actually Driving This Market
Regulatory timeline compression is the single mechanism converting latent awareness into active procurement. The UK National Cyber Security Centre roadmap, published in 2025, set 2028 as the hard deadline to complete cryptographic asset discovery across government and critical infrastructure. That deadline makes discovery software a compliance necessity, not a discretionary tool. For operators, the causal chain runs directly from NCSC deadline to procurement cycle, with no discretionary buffer.
Cryptographic library and hardware security module unreadiness creates a parallel demand signal. IBM’s 2025 quantum-readiness research found 81% of organizations reported their cryptographic libraries and HSMs were not ready for PQC integration. The mechanism is straightforward: you cannot upgrade what you have not mapped. Discovery software is the prerequisite layer for any remediation program. For investors, HSM unreadiness across large enterprise estates signals multi-year, recurring engagement contracts rather than one-time licenses.
The quantum-readiness strategy gap amplifies urgency. ISACA’s 2025 global poll of more than 2,600 digital-trust and cybersecurity professionals found only 5% of organizations had a defined quantum-computing strategy. The causal mechanism runs through governance: absent a formal strategy, cryptographic inventory becomes the first deliverable that forces organizations to operationalize their PQC posture. Quantum-safe cybersecurity frameworks require inventories as the entry-point artifact. For investors, low strategy maturity signals early-stage adoption with extended runway.
- The inventory gap is the primary growth engine, and it remains wide as of 2025
- UK NCSC 2028 deadline: mandates completion of cryptographic asset discovery across critical systems
- IBM 2025 research: 81% of organizations reported HSM and library unreadiness for PQC
- ISACA 2025 poll (n=2,600+): only 5% held a defined quantum-computing strategy
- 2026 DigiCert survey: 50% of organizations had conducted quantum-risk assessments, requiring discovery data as input
- Operators must treat discovery software deployment as a prerequisite, not a parallel track, to any PQC migration program
Where the Real Risk Is
The most underestimated risk is quantum-timeline uncertainty undermining procurement urgency. ISACA’s 2025 data shows 62% of professionals worried quantum computing would break current encryption before PQC is broadly implemented. The risk is correlational rather than causal at this stage: if enterprise buyers believe quantum timelines are soft, procurement cycles extend, compressing vendor revenue. This risk is temporary if regulatory deadlines hold, but permanent if governments soften compliance frameworks in response to lobbying. For investors, watch NCSC and NIST enforcement posture as the leading indicator.
Inventory completeness remains a structural vulnerability. Only 30% of organizations had completed a cryptographic inventory as of IBM’s 2025 research, meaning the majority of active buyers are in early-stage engagements, not production deployments. Incomplete inventories produce inaccurate migration roadmaps, which creates liability exposure for discovery vendors whose outputs are used as authoritative inputs into remediation programs. For operators, accuracy validation processes and audit trails are not optional features; they are the primary defense against remediation liability. Internet security posture depends on the reliability of these outputs.
- The risk most investors underestimate is quantum-timeline slippage reducing near-term procurement urgency
- ISACA 2025: 62% of professionals cited quantum encryption-breaking risk, but only 5% had formal strategies, signaling awareness without action
- IBM 2025: 70% of organizations had not completed a cryptographic inventory, exposing them to incomplete migration plans
- Watch NIST post-quantum standards enforcement dates and NCSC compliance audit announcements as signals that risk is materializing into procurement action
Competitive Landscape: Who Is Pulling Ahead and Why
The structural advantage in PQC cryptographic asset discovery software belongs to vendors that combine deep cryptographic library coverage with enterprise-grade integration into existing security operations workflows. Keyfactor has built a multi-capability position through acquisitions that extend its discovery reach across certificate lifecycle management, algorithm inventory, and cryptographic posture management. IBM brings mainframe-native discovery coverage that no pure-play competitor can replicate within IBM Z environments. For investors, these integration-depth advantages represent switching costs that protect market position beyond any single product launch.
The most aggressive challengers are purpose-built discovery specialists entering through vertical channels. CryptoNext Security, Fortanix, and Patero are targeting specific asset classes and operational contexts where broad-platform vendors have thinner coverage. QryptoCyber’s fixed-price inventory simulation model, priced at USD 25,000 per engagement with full credit toward license conversion, represents a land-and-expand strategy designed to lower initial procurement friction. For operators evaluating vendors, the key criterion is not feature breadth but cryptographic asset class coverage depth in your specific technology stack.
The market is consolidating at the platform layer while fragmenting at the specialist layer. Large vendors are acquiring discovery capabilities rather than building them organically, a pattern that signals that standalone discovery modules carry acquisition premium valuations. New entrants face barriers in cryptographic algorithm coverage breadth, regulatory certification, and integration with existing PKI and HSM infrastructure. For investors, early-stage specialists with defensible algorithm coverage in underserved verticals, particularly manufacturing and healthcare, represent the most viable acquisition targets in the 2026 to 2028 window.
| Company | Market Position | Key Advantage | Recent Move |
|---|---|---|---|
| Keyfactor | Platform leader | Multi-method discovery with certificate lifecycle integration | Expanded cryptographic posture management via acquisition |
| IBM | Enterprise incumbent | IBM Z mainframe-native cryptographic discovery | Launched dedicated mainframe inventory solution and joint migration offering |
| CryptoNext Security | Discovery specialist | IT and OT coverage breadth | Launched dedicated cryptographic discovery and analysis platform |
| Fortanix | Key management entrant | Integration with existing key management infrastructure | Extended platform to include PQC cryptographic scanning |
| Patero | Emerging challenger | Risk quantification and workshop-led engagement model | Launched discovery tool and structured inventory workshop |
| Arqit | New entrant | Centralized inventory with continuous monitoring | Commercially launched Encryption Intelligence platform |
| QryptoCyber | SME-focused specialist | Fixed-price simulation with license conversion credit | Introduced USD 25,000 inventory simulation engagement |
| QuantumGate | Regional specialist | National-scale infrastructure deployment | Partnered on UAE national cryptographic discovery initiative |
Key Players In This Report:
- Keyfactor
- IBM
- CryptoNext Security
- Fortanix
- Patero
- Arqit
- QryptoCyber
- QuantumGate
Where This Market Goes Next
The 2028 NCSC deadline for completing cryptographic asset discovery is the most concrete activation condition in this market. If enforcement holds, the window between now and 2028 becomes the primary procurement surge period for discovery platforms across UK government and critical infrastructure. The UK NCSC has also set 2031 for migration of critical systems, making continuous discovery a multi-year operational requirement rather than a one-time project. For operators, the activation question is not whether to deploy discovery software, but how quickly a full-estate inventory can be produced before the 2028 deadline.
Vendor consolidation at the platform layer will reshape competitive dynamics by 2027. As large security platform vendors acquire discovery specialists, standalone tools will either be absorbed or pushed into narrow vertical niches. The Automated Cryptography Discovery and Inventory Workshop model, introduced to help organizations structure inventory scope and ownership, points to a service-led engagement pattern that precedes software licensing. For operators, early vendor selection locks in integration dependencies that are difficult to reverse mid-migration, making 2025 to 2026 the critical evaluation window.
Full migration of systems, services, and products by 2035 creates a decade-long demand horizon for PQC cryptographic asset discovery software, per the NCSC roadmap. The scenario depends on two assumptions holding: regulatory timelines remain firm, and quantum computing capability advances within the projected window. Early deployments indicate that organizations completing discovery faster gain first-mover advantage in negotiating migration vendor terms and regulatory compliance timelines. For operators, treating the 2035 endpoint as a hard constraint rather than a soft target changes resource allocation and discovery platform investment calculus today.
| Condition | Timeline | Upside | Who Benefits |
|---|---|---|---|
| NCSC 2028 enforcement holds | 2025 to 2028 | Procurement surge across UK critical infrastructure | Platform vendors with government certifications |
| Service-to-software conversion scales | 2026 to 2027 | Recurring license revenue from workshop-led engagements | Vendors with structured onboarding models |
| Full migration mandate confirmed | 2028 to 2035 | Continuous discovery contracts across all sectors | Multi-method platform vendors |
Key Developments
- January 2026: Arqit commercially launched Encryption Intelligence, providing automated cryptographic discovery, centralized inventory, continuous monitoring, and risk prioritization for enterprise PQC migration planning. This signals that new entrants are moving from beta to commercial scale, increasing competitive pressure on incumbents.
- January 2026: Keyfactor and IBM Consulting launched a joint quantum-safe transformation solution combining cryptographic discovery and inventory with quantum-safe migration expertise, including automated discovery across on-premises, cloud, hybrid, and DevOps environments. This signals that platform-level partnerships are displacing point-solution procurement in large enterprise deals.
- June 2025: IBM introduced IBM Z Crypto Discovery and Inventory (IBM zCDI), enabling cryptographic asset discovery and inventory creation specifically within IBM Z environments. This signals that mainframe-specific discovery is emerging as a distinct product category with no direct substitute.
- June 2025: Fortanix launched PQC Central within Fortanix Key Insight, scanning systems for cryptographic usage, mapping dependencies, and cataloging quantum-vulnerable assets. This signals that key management vendors are extending upward into discovery, blurring traditional product category boundaries.
- May 2025: Keyfactor acquired InfoSec Global and CipherInsights, adding cryptographic asset discovery, inventory, real-time monitoring, and cryptographic posture management to its portfolio. This signals that acquisition is the preferred path to discovery capability for established PKI vendors.
Drivers Analysis
| Driver | (~) % Impact on CAGR Forecast | Geographic Relevance | Impact Timeline |
|---|---|---|---|
| Federal PQC inventory mandates | +5.2% | United States; allied public sectors | Short term (≤ 2 years) |
| NIST-standard algorithm finalization | +4.1% | Global; strongest in North America and Europe | Short term (≤ 2 years) |
| Harvest-now risk prioritization | +3.7% | Global regulated enterprises | Medium term (2–4 years) |
| Cryptographic-agility program adoption | +3.3% | North America; Europe; Asia-Pacific | Medium term (2–4 years) |
| Certificate lifecycle consolidation | +2.6% | Global large enterprises | Short term (≤ 2 years) |
| Critical-infrastructure cyber investment | +2.3% | North America; Europe; Japan; Australia | Medium term (2–4 years) |
Federal PQC inventory mandates
Government migration policy is converting cryptographic visibility from a discretionary security-control purchase into a compliance-led operating requirement. The U.S. federal migration program requires agencies to identify quantum-vulnerable cryptography and maintain annual inventories through 2035, while automated cryptography discovery and inventory tooling has been positioned as the means to identify exposed systems, protocols, certificates, keys, and software dependencies.
NIST’s final PQC standards in August 2024 removed a major adoption uncertainty, and CISA’s 2024 migration guidance elevated automated discovery as a practical implementation layer. This creates recurring SaaS and managed-assessment demand rather than one-off audit revenue: providers can price per endpoint, cloud account, application, certificate, or scanned code repository, with compliance urgency supporting faster procurement cycles and lowering customer-acquisition friction in federal, defense-adjacent, and critical-infrastructure accounts. +5.2% represents a plausible incremental contribution to the 47.8% baseline CAGR because mandated inventory deployment accelerates the initial discovery phase without assuming every discovered asset immediately converts into a full remediation project.
Restraints Analysis
| Restraint | (~) % Impact on CAGR Forecast | Geographic Relevance | Impact Timeline |
|---|---|---|---|
| Unfunded legacy modernization budgets | -4.4% | Global; concentrated in public sector and industrial estates | Short term (≤ 2 years) |
| Sovereign procurement approval delays | -3.4% | North America; Europe; Middle East; Asia-Pacific | Medium term (2–4 years) |
| Fragmented tool-budget ownership | -3.0% | Global large enterprises | Short term (≤ 2 years) |
| Restricted telemetry access | -2.7% | Defense; healthcare; financial services | Short term (≤ 2 years) |
| Long security-tool qualification cycles | -2.5% | Global regulated industries | Medium term (2–4 years) |
| Embedded-device replacement constraints | -2.1% | Industrial; energy; transport networks | Long term (≥ 4 years) |
Unfunded legacy modernization budgets
The immediate sales barrier is not lack of awareness but the separation between security teams that identify quantum-vulnerable cryptography and infrastructure owners who must fund remediation across aging estates. A discovery deployment can reveal thousands of certificates, libraries, firmware images, VPN endpoints, machine identities, and externally hosted dependencies, yet asset owners may defer integration or continuous-monitoring contracts until broader network, identity, cloud, or application-modernization budgets are approved. This creates a measurable conversion bottleneck: vendors can win low-cost assessments but face delayed expansion into enterprise-wide subscriptions, pressured professional-services margins, and longer revenue-recognition cycles. A -4.4% deduction from the 47.8% baseline is consistent with a fast-growing but budget-constrained market, because spending is delayed rather than eliminated and mandate-driven buyers can still procure targeted inventory capabilities.
Challenges Analysis
| Challenge | (~) % CAGR Friction Drag | Geographic Relevance | Mitigation Horizon |
|---|---|---|---|
| Opaque cryptography in code | -4.0% | Global software-intensive enterprises | Long term (≥ 4 years) |
| Cloud telemetry normalization | -3.5% | North America; Europe; Asia-Pacific | Medium term (2–4 years) |
| False-positive remediation prioritization | -3.1% | Global large enterprises | Medium term (2–4 years) |
| Cryptography skills scarcity | -2.8% | Global; acute in emerging markets | Long term (≥ 4 years) |
| Third-party dependency mapping | -2.6% | Global supply-chain ecosystems | Long term (≥ 4 years) |
| Hybrid protocol testing complexity | -2.3% | Global regulated enterprises | Medium term (2–4 years) |
Opaque cryptography in code
Cryptography is frequently embedded indirectly through inherited libraries, container images, build systems, open-source packages, device firmware, protocol defaults, and third-party APIs, making network-only discovery insufficient. NIST’s discovery workstream explicitly spans code-development pipelines, lifecycle components, network services and protocols, end-user systems, and servers; it also requires correlation between cryptographic findings and hardware, software, and service inventories.
The resulting operational friction is material: each uncorrelated finding demands validation of algorithm, key size, protocol role, data sensitivity, owner, upgrade path, and outage risk before it becomes a remediation priority. Providers must therefore invest continuously in software composition analysis, code scanning, passive and active network inspection, asset-graph correlation, and risk-scoring automation; otherwise analyst review costs rise, detection quality falls, and customers limit deployments to narrower environments. The -4.0% drag reflects a ceiling constraint on scalable coverage rather than a halt to current sales.
Opportunities Analysis
| Opportunity | (~) % Potential CAGR Upside | Geographic Relevance | Execution Window |
|---|---|---|---|
| Managed crypto-risk operations | +5.0% | Global mid-market and regulated enterprises | Medium term (2–4 years) |
| PQC procurement intelligence platforms | +4.1% | United States; Europe; allied governments | Short term (≤ 2 years) |
| Software supply-chain attestations | +3.7% | Global software vendors and buyers | Medium term (2–4 years) |
| OT and IoT discovery | +3.4% | Industrial economies globally | Long term (≥ 4 years) |
| Cyber-insurance risk scoring | +2.8% | North America; Europe; advanced Asian markets | Medium term (2–4 years) |
| Security-platform data partnerships | +2.5% | Global enterprise security ecosystems | Short term (≤ 2 years) |
Managed crypto-risk operations
This remains future white space because many organizations can purchase an initial cryptographic inventory but lack the specialist capacity, operating model, and continuous telemetry discipline to convert periodic scans into a managed remediation program. A managed model can bundle recurring discovery, ownership mapping, policy monitoring, risk scoring, migration backlog governance, and evidence production across cloud, code, certificates, endpoints, and third parties.
The unit-economics shift is significant: automation that reduces manual triage and asset-owner follow-up by roughly 30% to 50% can move revenue from project-based assessments toward higher-retention subscriptions, while standardized playbooks can support gross-margin expansion of roughly 8% to 15% versus labor-heavy consulting delivery. It is not a current baseline driver because enterprise procurement is still centered on initial visibility and compliance preparation; capitalizing on the opportunity requires providers to establish service operations, liability models, integrations, and outcome-based pricing. If executed at scale, the model could add approximately +5.0% to the stated 47.8% baseline CAGR without requiring an implausible immediate conversion of all discovered assets into PQC remediation.