

Market Verdict
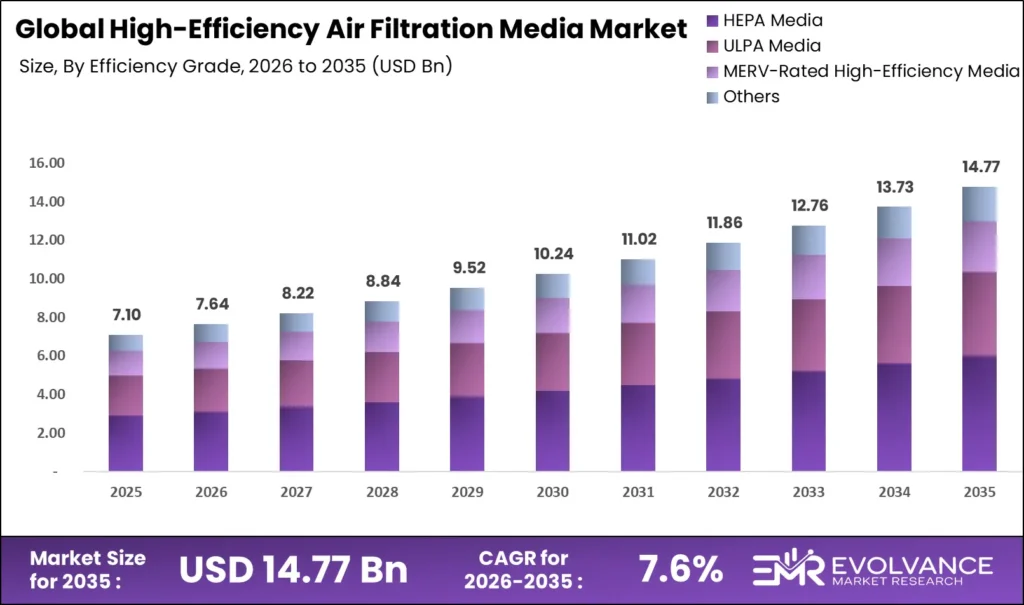
The high-efficiency air filtration media market is not riding a wellness trend. It is being structurally pulled by facility compliance mandates, post-pandemic indoor air quality standards, and wildfire-driven regulatory pressure that makes HEPA-grade performance a procurement floor, not a premium option. According to EMR, the market was valued at USD 7.64 billion in 2026, is projected to reach USD 14.77 billion in 2035, and will expand at a CAGR of 7.6% through the forecast period. Operators who treat filtration media as a commodity input will face specification lock-out as procurement standards tighten across commercial, healthcare, and semiconductor end-uses.
Key Takeaways
Market Size:
- Market size in 2025: USD 7.1 billion (2025), per EMR
- Market size in 2026 : USD 7.64 billion
- Market Size in 2035: USD 14.77 Billion
- CAGR: 7.6% over the forecast period
Dominant Segments:
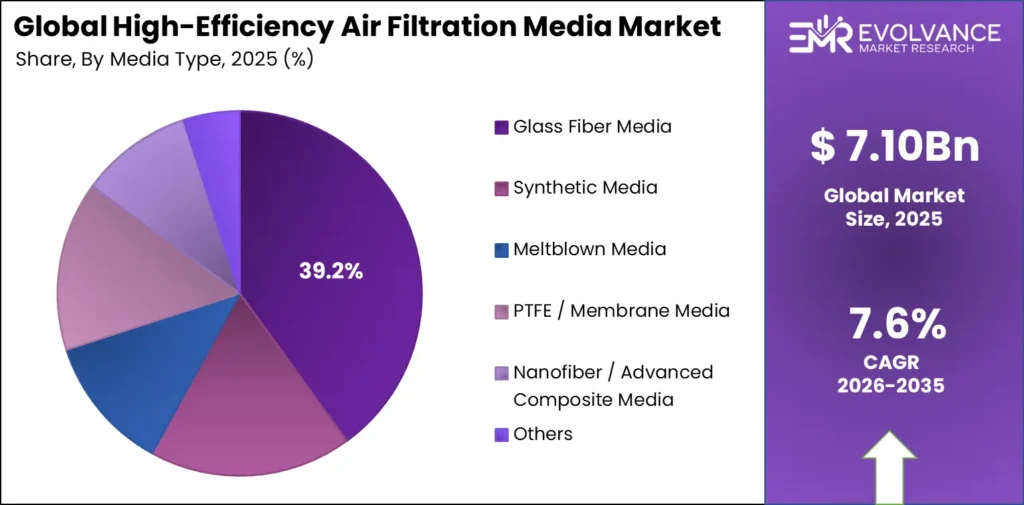
- Media Type: Glass Fiber Media at 39.2% as of 2025
- Efficiency Grade: HEPA Media at 57.8% as of 2025
- Filter Format: Pleated Media at 44.5% as of 2025
- Application: HVAC Systems at 35.6% as of 2025
- End-Use Industry: Commercial Buildings at 31.7% as of 2025
Dominant Region:
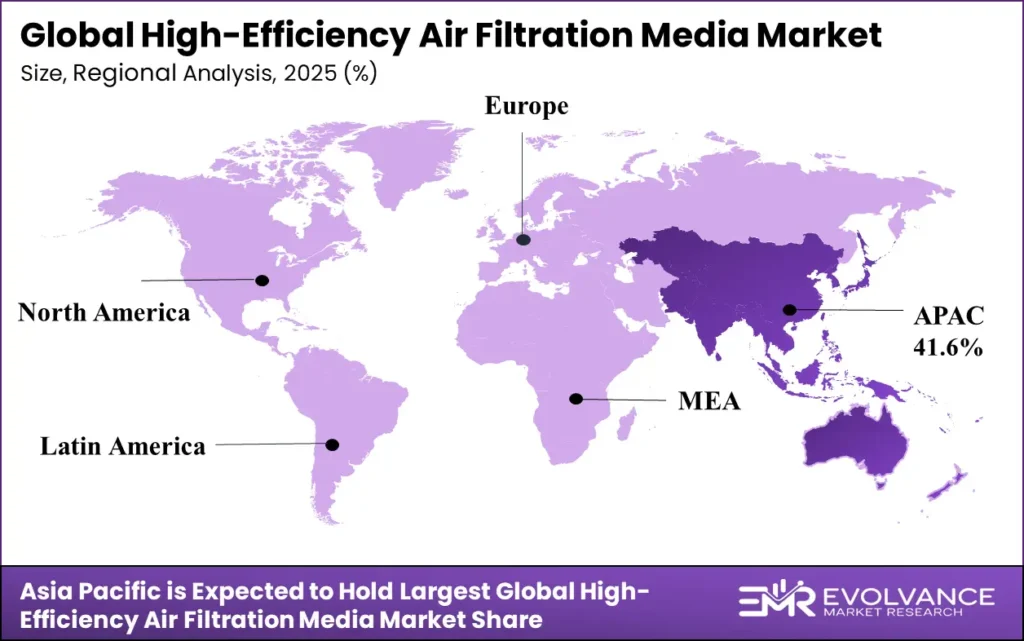
- Leading region: Asia Pacific at 41.6%, valued at USD 2.91 billion as of 2025
Source: Evolvance Market Research(EMR)
Market Overview
High-efficiency air filtration media sits at the mechanical core of every controlled indoor environment. Cleanrooms, hospital operating suites, commercial HVAC systems, semiconductor fabs, and automotive cabin assemblies all depend on filtration media to maintain particulate thresholds that are non-negotiable by design specification. The industries that buy this media do not treat it as optional infrastructure.
To build this analysis, our EMR research team combined primary interviews with procurement managers, facility engineers, and filtration media manufacturers across 20-plus countries, supplemented by secondary data from regulatory filings, trade association reports, and company disclosures. The study covers 2020 through the forecast horizon, with geographic scope spanning North America, Europe, Asia Pacific, Latin America, and the Middle East and Africa. Data was cross-validated against shipment volumes and regional construction pipeline data.
The problem this market solves is invisible until it fails. Buyers purchase filtration media when a facility must meet a particulate specification, when a regulatory audit is imminent, or when an existing system degrades below threshold. The U.S. Environmental Protection Agency defines HEPA performance at removal of at least 99.97% of particles at the most penetrating particle size of 0.3 micrometers. Missing that threshold in a pharmaceutical cleanroom or a semiconductor fab means production shutdown, not discomfort.
What the EPA standard also confirms is that filtration performance does not degrade linearly across particle sizes. Particles both larger and smaller than 0.3 micrometers are captured at efficiencies exceeding 99.97% through diffusion, interception, and impaction mechanisms, per EPA documentation. This physical reality makes HEPA media a genuine performance floor, not a marketing tier. For investors, the specification lock-in effect this creates means media suppliers certified to HEPA grade face lower substitution risk than commodity filter manufacturers.
What Is Actually Driving This Market
Consumer adoption of portable air cleaners has moved filtration demand from institutional to residential channels. According to the U.S. Centers for Disease Control and Prevention, 88.8% of U.S. adults using portable air cleaners in 2025 reported doing so to remove dust, pollen, mold, or other allergens. The causal mechanism runs through awareness created by wildfire events and pandemic indoor air guidance, which converted filtration from a facility management concern into a household purchase decision. For investors, the residential channel now represents a structurally new demand pool alongside institutional procurement.
Pandemic-era biosafety guidance created a durable secondary driver in virus particle removal. CDC data shows 51.6% of portable air cleaner users reported using devices to remove virus particles from indoor air as of 2025. The causal mechanism is policy-driven: ASHRAE Standard 241, issued post-pandemic, establishes infection risk reduction as a building performance target, making high-efficiency filtration a code-compliance tool rather than an elective upgrade. For operators, HVAC system retrofit specifications are now written to MERV and HEPA thresholds that were optional five years ago.
Wildfire smoke infiltration has created a third demand vector that did not exist at scale before 2020. CDC data confirms 38.3% of portable air cleaner users operated devices specifically to reduce wildfire smoke particles indoors as of 2025. The mechanism is geographic: the western U.S., southern Europe, and parts of Southeast Asia now experience multi-week smoke events that push PM2.5 concentrations above outdoor air quality thresholds indoors. Per the American Lung Association, jurisdictions affected by chronic wildfire events are tightening indoor air quality standards. For operators, procurement timelines in smoke-affected regions now compress sharply during fire seasons, making pre-positioned inventory a competitive advantage.
- The single most important driver insight: demand is no longer cyclical. Three independent structural forces, allergen avoidance, biosafety compliance, and wildfire infiltration, now reinforce each other year-round.
- Allergen and particulate removal: 88.8% of portable air cleaner users cited this as their primary motivation as of 2025 (CDC)
- Virus particle removal: 51.6% of users cited biosafety as a use case as of 2025 (CDC)
- Wildfire smoke reduction: 38.3% of users cited smoke infiltration as of 2025 (CDC)
- Capital should follow media manufacturers supplying both residential air purifier OEMs and commercial HVAC retrofit programs, as both channels are being activated simultaneously by the same structural forces.
Where the Real Risk Is
Purchase cost remains the most stubborn barrier in the consumer segment and correlates strongly with market ceiling in residential channels. CDC data shows 46.0% of consumers without a HEPA air purifier cited high purchase cost as the primary reason for non-ownership as of 2025. This is correlational, not causal: lower-cost alternatives exist, but consumer willingness to pay for HEPA-grade performance has not closed the gap. The restraint is structural and unlikely to resolve without either price compression from manufacturing scale or subsidy programs. For investors, premium residential HEPA plays carry addressable market risk until cost barriers erode.
Behavioral barriers compound the cost problem. CDC data indicates 38.3% of non-HEPA users believed they did not need a HEPA filter as of 2025, and 14.5% identified noise as a deterrent. These are perception gaps, not performance gaps, and they limit penetration in lower-acuity segments even where products are affordable. Whether education campaigns or product design changes resolve these barriers is unclear from available data. For operators, product development investment in low-noise media configurations and clearer performance labeling, as guided by standards bodies like Underwriters Laboratories, addresses the perception barriers more directly than price reductions alone.
- The risk most investors underestimate: behavioral non-adoption, not price sensitivity alone, caps the residential ceiling.
- Cost barrier: 46.0% of non-HEPA consumers cited purchase cost as primary barrier as of 2025 (CDC)
- Perception gap: 38.3% of non-HEPA users believed they had no need for HEPA-grade filtration as of 2025 (CDC)
- Noise deterrent: 14.5% of respondents identified noise as a purchasing barrier as of 2025 (CDC)
- Watch for: rising HEPA air purifier attach rates in smoke-affected geographies as the signal that cost and perception barriers are breaking down in high-acuity consumer segments.
Media Type Insights
Glass Fiber Media Holds the Largest Share at 39.2% in 2025
Glass fiber media commands the leading position in the media type segment because its fiber diameter consistency enables reliable HEPA-grade efficiency across high-volume production runs. As a category, high performance materials and chemicals define the substrate selection criteria in regulated filtration applications, where auditable performance repeatability is non-negotiable. Pharmaceutical manufacturers, cleanroom operators, and commercial HVAC system integrators specify glass fiber as the default substrate, while specialty polymer formulations in synthetic and meltblown media are gaining ground in moisture-resistant and respiratory-grade applications. For investors, switching costs in regulated industries protect glass fiber media suppliers from synthetic media displacement in the near term.
| Sub-segment | Share % | Primary Driver | Outlook |
|---|---|---|---|
| Glass Fiber Media | 39.2% | Specification-grade consistency in regulated applications | Stable leadership; synthetic competition emerging in HVAC retrofit |
| Synthetic Media | Not disclosed | Cost efficiency and moisture resistance | Gaining share in non-regulated HVAC |
| Meltblown Media | Not disclosed | Electrostatic charge filtration for respiratory and medical | Sustained demand from healthcare OEMs |
| PTFE / Membrane Media | Not disclosed | Chemical resistance in industrial environments | Niche but high-value; semiconductor fab demand growing |
| Nanofiber / Advanced Composite | Not disclosed | Sub-micron efficiency without pressure drop penalty | Emerging; qualification cycles limit near-term share gains |
Efficiency Grade Insights
HEPA Media at 57.8%: What’s Behind the Numbers in 2025
HEPA Media holds a majority share of the efficiency grade segment at 57.8% as of 2025, a position anchored by mandatory specification requirements in healthcare, pharmaceutical manufacturing, and semiconductor fabrication. The EPA’s established 99.97% particle removal threshold at 0.3 micrometers has become a procurement floor in regulated industries, not a performance ceiling buyers negotiate around. ULPA and MERV-rated sub-segments serve distinct niches but cannot displace HEPA in its core institutional base. For operators, HEPA media qualification is the entry condition for high-value contract manufacturing and facility management tenders.
Filter Format Insights
Pleated Media Pulls Ahead: 44.5% Share in 2025
Pleated media holds 44.5% of the filter format segment as of 2025 because pleating maximizes filtration surface area within a fixed housing footprint, a geometry advantage that directly reduces pressure drop and extends service intervals. HVAC system designers specify pleated formats as the standard configuration for commercial and industrial installations where energy efficiency and maintenance frequency are both cost variables. Mini-pleat formats are gaining traction in semiconductor and pharmaceutical cleanrooms where airflow uniformity requirements are stricter. For investors, pleated media production scale is a moat: the converting equipment required is capital-intensive and favors established manufacturers.
Application Insights
HVAC Systems Captures 35.6% as 2025 Demand Shifts
HVAC systems represent the largest application segment at 35.6% as of 2025, driven by commercial building retrofits responding to post-pandemic indoor air quality mandates and energy code updates that reward low-pressure-drop media configurations. ASHRAE and national building codes in multiple jurisdictions have raised minimum filtration efficiency requirements for new construction and major renovation projects. Cleanrooms, healthcare, and industrial filtration collectively represent a substantial secondary demand base, but HVAC volume dominance reflects the sheer scale of commercial real estate filtration cycles. For operators, HVAC media supply contracts tied to multi-year building management agreements provide revenue visibility that project-based cleanroom work does not.
End-Use Industry Insights
The Case for Commercial Buildings: 31.7% Share and Counting
Commercial buildings lead end-use industry demand at 31.7% as of 2025, a share reflecting the intersection of building performance certification programs such as LEED and WELL, tenant-driven indoor air quality expectations, and facility managers operating under tightening municipal ventilation codes. Healthcare and pharmaceutical and biotechnology follow as the highest-specification segments, where filtration media failure carries regulatory and liability consequences. Semiconductor and electronics manufacturing represents the most technically demanding application by particle count standards. For investors, the commercial buildings segment offers scale, while healthcare and semiconductor segments offer margin.
Segments Covered In This Report
By Media Type
- Glass Fiber Media
- Synthetic Media
- Meltblown Media
- PTFE / Membrane Media
- Nanofiber / Advanced Composite Media
- Others
By Efficiency Grade
- HEPA Media
- ULPA Media
- MERV-Rated High-Efficiency Media
- Others
By Filter Format
- Pleated Media
- Mini-Pleat Media
- Flat Sheet Media
- Roll Media
- Pocket/Bag Media
By Application
- HVAC Systems
- Cleanrooms
- Industrial Air Filtration
- Healthcare and Medical Facilities
- Automotive Cabin Filtration
- Air Purifiers
- Others
By End-Use Industry
- Commercial Buildings
- Healthcare
- Pharmaceutical and Biotechnology
- Semiconductor and Electronics
- Industrial Manufacturing
- Food and Beverage
- Automotive
- Residential
- Others
Value in this market is concentrating in the intersection of HEPA efficiency grade, pleated format, and HVAC and cleanroom applications. Glass fiber media in pleated HEPA configurations for commercial HVAC retrofits and pharmaceutical cleanrooms represents the highest-density value pocket. Fragmentation is occurring at the edges: nanofiber composites, sustainable media, and residential air purifier formats each address distinct demand pools but have not yet achieved the specification depth that drives institutional procurement. For investors, the core concentration point offers defensible margin; the edges offer growth optionality with higher qualification risk.
Regional Analysis: Where Geography Creates Advantage
Asia Pacific holds the dominant regional position at 41.6% of the global market, valued at USD 2.91 billion as of 2025, per EMR research. The structural driver is the concentration of semiconductor fabrication capacity across Taiwan, South Korea, Japan, and China, where cleanroom filtration media specifications are among the most demanding in any industry. Government-backed semiconductor investment programs administered through agencies such as Japan’s Ministry of Economy, Trade and Industry and South Korea’s Ministry of Trade, Industry and Energy are expanding fab capacity and pulling filtration media demand with them. For investors, Asia Pacific’s semiconductor-driven demand base provides a counter-cyclical floor that commercial real estate demand alone does not.
North America represents the second major demand region, anchored by commercial building retrofits, healthcare facility upgrades, and a residential air purifier market being activated by wildfire events across the western United States. The U.S. Environmental Protection Agency and ASHRAE together set the regulatory and standards framework that governs filtration specifications across commercial and institutional applications. Post-pandemic federal funding for hospital infrastructure upgrades through programs administered by the Department of Health and Human Services has accelerated healthcare facility filtration procurement cycles. For operators, North America’s retrofit-driven demand cycle rewards suppliers with rapid deployment capability and domestic inventory positioning.
Europe presents a structurally different demand profile, shaped by the European Union’s clean air legislative framework and tightening energy performance standards for buildings under the EU Energy Performance of Buildings Directive. Cleanroom demand from pharmaceutical manufacturing in Germany, Switzerland, and Ireland is growing alongside industrial filtration requirements linked to EU industrial emissions regulations. Sustainability-oriented procurement policies in Scandinavian markets are creating demand for fiber-based and lignin-containing filtration media that meet environmental product declarations. For investors, Europe’s regulatory-driven procurement cycle is slower to accelerate but more durable once standards are embedded in building codes and facility certifications.
| Region | Share % | USD Value | Key Driver | Strategic Signal |
|---|---|---|---|---|
| Asia Pacific | 41.6% | USD 2.91B | Semiconductor fab expansion and cleanroom demand | Government-backed fab investment sustaining baseline demand |
| North America | Not disclosed | Not disclosed | HVAC retrofit, healthcare upgrades, residential wildfire demand | Federal infrastructure funding accelerating institutional procurement |
| Europe | Not disclosed | Not disclosed | EU clean air legislation and building energy performance standards | Sustainability media demand differentiating regional suppliers |
Competitive Landscape: Who Is Pulling Ahead and Why
The leaders in high-efficiency air filtration media hold advantages that are embedded in qualification history, not product specifications alone. Companies such as 3M, Camfil, and Freudenberg Filtration Technologies have been written into facility specifications across pharmaceutical, semiconductor, and commercial HVAC applications for decades. Re-qualifying a filtration media supplier in a pharmaceutical cleanroom or a semiconductor fab is a multi-year process under ISO 14644 and GMP standards. For investors, incumbent qualification lock-in is the most defensible competitive moat in this market, and it does not appear on a balance sheet.
The most aggressive challengers are attacking on two fronts simultaneously: sustainable media formulations and energy-efficient configurations. Ahlstrom has positioned itself at the intersection of both vectors, expanding its sustainable filtration media production and winning healthcare and laboratory application selections that diversify its revenue base beyond traditional HVAC channels. Mann+Hummel and Donaldson are competing on industrial filtration breadth, targeting segments where specification requirements are tighter than commodity HVAC but less locked in than pharmaceutical or semiconductor applications. For operators, the challenger strategy signals that mid-market industrial filtration is the most actively contested segment in the near term.
The market is consolidating at the top through acquisition and manufacturing footprint expansion, while fragmenting at the specialty media level where nanofiber, PTFE membrane, and sustainable fiber formulations are being developed by smaller innovators. Advanced and intelligent manufacturing capabilities are emerging as a key differentiator among full-line suppliers, enabling tighter fiber diameter control, automated converting, and real-time quality validation that smaller producers cannot replicate at scale. Camfil’s expansion of its manufacturing presence through acquisition in 2026 illustrates the consolidation dynamic among full-line suppliers. For investors, the consolidation dynamic favors established players in core segments and creates acquisition targets among specialty media innovators who have cleared early qualification hurdles but lack distribution scale.
| Company | Market Position | Key Advantage | Recent Move |
|---|---|---|---|
| 3M Company | Global leader | Broad media portfolio with cross-industry qualification depth | Sustained investment in filtration media R&D |
| Camfil AB | Global leader | End-to-end filtration system expertise and manufacturing scale | Expanded manufacturing footprint through acquisition in 2026 |
| Ahlstrom Corporation | Strong challenger | Sustainable fiber media and healthcare application diversification | New HVAC glass microfiber launch and European production expansion |
| Freudenberg Filtration Technologies | Established leader | Automotive and industrial cleanroom media qualification history | Continued industrial segment investment |
| Mann+Hummel | Strong challenger | Industrial and automotive filtration systems breadth | Mid-market industrial filtration competition intensifying |
| Donaldson Company, Inc. | Established leader | Industrial filtration systems integration capability | Industrial and commercial segment focus maintained |
| Parker-Hannifin Corporation | Established player | Motion and control systems integration with filtration | Sustained industrial application focus |
| MAHLE GmbH | Established player | Automotive cabin filtration media specification depth | Automotive OEM supply chain positioning |
Key Players In This Report
- 3M Company
- Ahlstrom Corporation
- Camfil AB
- Donaldson Company, Inc.
- Parker-Hannifin Corporation
- Freudenberg Filtration Technologies
- Mann+Hummel
- Eaton Corporation
- Cummins Inc.
- MAHLE GmbH
- Compagnie de Saint-Gobain S.A.
- Filtration Group Corporation
- Robert Bosch GmbH
- Denso Corporation
- Hengst SE
- American Air Filter Company (AAF Flanders)
- Nederman Holding AB
- Lydall (IDEX Corporation)
- Sogefi S.p.A.
- UFI Filters
Where This Market Goes Next
The first growth scenario activates if wildfire season severity continues its upward trajectory in North America and southern Europe, driving municipal and state-level indoor air quality mandates for commercial buildings. Buildings with HEPA filtration recorded a median indoor/outdoor PM2.5 ratio of 0.43 during the 2020 U.S. wildfire season, compared with 0.82 in buildings without filtration, per published research. That performance gap is the evidence base regulators will use to set minimum filtration thresholds in smoke-affected jurisdictions. For operators, pre-positioning HEPA-grade media inventory and establishing retrofit service capability in western North America and Mediterranean Europe before mandate timelines is the required action now.
The second scenario activates through continued expansion of advanced glass microfiber filtration media that reduces energy consumption in HVAC systems. Ahlstrom’s May 2026 launch of an advanced glass microfiber media delivering up to 20% lower initial pressure drop while maintaining high particulate filtration performance illustrates how energy performance and filtration efficiency are being decoupled from their traditional trade-off relationship. As energy codes tighten globally under building performance standards administered by the International Energy Agency and national ministries, low-pressure-drop HEPA media becomes the specification that satisfies both filtration and energy requirements simultaneously. For operators, product qualification against emerging low-pressure-drop HEPA media specifications must begin now, given the 18-to-36-month qualification cycles in commercial HVAC procurement.
The third scenario centers on sustainable filtration media becoming a procurement requirement rather than a differentiation claim. Lignin-containing and fiber-based media formulations are moving from pilot to commercial-scale production, as evidenced by recent European manufacturing capacity additions in the sector. Smart polymers chemical innovation is quietly accelerating this transition, enabling media formulations that respond to humidity, particulate load, and airflow conditions in ways conventional glass fiber substrates cannot. The European Union’s Environmental Product Declaration framework and green procurement directives from public sector buyers are the activation conditions. For operators, early qualification of sustainable media variants positions suppliers ahead of a procurement shift that will disadvantage late movers once standards are embedded.
| Condition | Timeline | Upside | Who Benefits |
|---|---|---|---|
| Wildfire-driven indoor air quality mandates enacted in commercial building codes | 2026 to 2028 | Accelerated HEPA retrofit demand in North America and Mediterranean Europe | Established HEPA media suppliers with retrofit distribution networks |
| Low-pressure-drop HEPA media adopted in updated energy performance standards | 2026 to 2029 | Specification displacement of standard pleated HEPA in commercial HVAC | Advanced glass microfiber and nanofiber media producers |
| Sustainable media procurement criteria embedded in BREEAM and LEED standards | 2027 to 2030 | Green media premium pricing and preferred supplier status in public sector | Fiber-based and lignin-containing media manufacturers with EU production |
Key Developments
- June 2026, Ahlstrom: Announced its fiber-based filtration material was selected for PlasticTox’s microplastic blood test kit. This signals that high-performance filtration media is crossing from air filtration into diagnostic laboratory applications, a channel with distinct qualification requirements and recurring consumable demand dynamics.
- January 2026, Camfil: Acquired Italian air filtration company F.C.R., strengthening its southern European manufacturing footprint. The move signals that leading full-line suppliers are prioritizing geographic manufacturing redundancy and local-market specification capability over purely centralized production models.
Drivers
| Driver | (~) % Impact on CAGR Forecast | Geographic Relevance | Impact Timeline |
|---|---|---|---|
| Semiconductor fab cleanroom expansion | +1.4% | Asia Pacific, North America | Short term (2 years or less) |
| Indoor air quality regulation tightening | +1.1% | North America, Europe | Medium term (2 to 4 years) |
| Hospital and pharma cleanroom retrofits | +0.8% | Global | Short term (2 years or less) |
| HVAC replacement cycle in commercial real estate | +0.6% | North America, Europe | Medium term (2 to 4 years) |
| Rising ambient PM2.5 exposure awareness | +0.5% | Asia Pacific | Short term (2 years or less) |
| EV battery gigafactory dry room filtration adoption | +0.4% | Asia Pacific, Europe | Medium term (2 to 4 years) |
Semiconductor Fab Cleanroom Expansion
The root driver is the buildout of ISO Class 1 to Class 5 fabrication capacity across leading foundries, where wafer defect tolerances have tightened to fewer than 10 particles per cubic meter at 0.1 micrometers, a threshold that mandates continuous replacement of ULPA and HEPA media banks rather than one time installation; per SEMI capital equipment shipment tracking, fab construction starts accelerated through 2024 and 2025 as new logic and memory nodes moved to sub 3 nanometer geometries, directly lifting recurring filter media consumption per cleanroom by an estimated 15% to 20% versus prior generation fabs.
This mechanism has already shifted media suppliers away from one time equipment sales toward multi year consumables and replacement service contracts, a business model transition comparable to the licensing to subscription shift seen in software, with gross margins on recurring media replacement running an estimated 8 to 12 percentage points above initial installation margins as reflected in disclosed segment margin commentary from major filtration equipment manufacturers’ investor decks.
Strategically, this compresses the sales cycle for new business while extending customer lifetime value, and it is reinforced by national semiconductor incentive programs, including the U.S. CHIPS Act implementation milestones tracked by the U.S. Department of Commerce and comparable subsidy schemes documented in Taiwan’s Ministry of Economic Affairs industrial statistics, both of which catalyzed fab groundbreakings in 2024 that are now translating into 2026 cleanroom fit out demand. The net effect is a durable, non cyclical baseline uplift to media replacement volumes that is materially less sensitive to broader industrial capital expenditure cycles than legacy HVAC filtration demand.
Restraints
| Restraint | (~) % Impact on CAGR Forecast | Geographic Relevance | Impact Timeline |
|---|---|---|---|
| PTFE and glass microfiber input cost volatility | -1.2% | Global | Short term (2 years or less) |
| High interest rate constrained CapEx deferral | -0.9% | North America, Europe | Short term (2 years or less) |
| PFAS regulatory restrictions on fluoropolymer media | -0.7% | Europe, North America | Medium term (2 to 4 years) |
| Import tariff escalation on filtration components | -0.5% | North America | Short term (2 years or less) |
| Price sensitive residential adoption ceiling | -0.4% | Emerging markets | Medium term (2 to 4 years) |
PFAS Regulatory Restrictions On Fluoropolymer Media
The root cause is the classification of long chain and select short chain per and polyfluoroalkyl substances used in PTFE membrane media as substances of very high concern, with the European Chemicals Agency’s restriction dossier process advancing toward implementation dates that manufacturers anticipate could fall between 2027 and 2029, alongside individual U.S. state level bans already codified, including statutes with compliance deadlines as early as 2026 per state environmental agency filings.
The quantitative bottleneck is immediate: qualified alternative membrane chemistries such as expanded polypropylene or bio based nanofiber substrates currently carry a cost per square meter premium estimated at 25% to 35% above legacy PTFE membranes according to raw material cost disclosures embedded in filtration manufacturer annual reports, while requalification testing cycles for ULPA grade replacement media in regulated end markets such as pharmaceutical cleanrooms can extend 12 to 18 months per FDA current good manufacturing practice validation timelines.
Strategically, this freezes near term product roadmaps for manufacturers still dependent on fluoropolymer chemistries, forces working capital into dual sourcing inventories, and compresses blended gross margins by an estimated 200 to 350 basis points during the transition window as legacy inventory is written down against newly qualified substitute media. The restraint is distinct from a mere cost pressure because it constitutes an active legal phase out that removes specific SKUs from sale in defined jurisdictions on a statutory timeline, rather than simply raising input costs across the board.
Challenges
| Challenge | (~) % CAGR Friction Drag | Geographic Relevance | Mitigation Horizon |
|---|---|---|---|
| Skilled filtration engineering talent gap | -0.6% | Global | Long term (4 years or more) |
| Fragmented nonwoven substrate supply base | -0.5% | Asia Pacific, Europe | Medium term (2 to 4 years) |
| Inconsistent global filtration testing standards | -0.4% | Global | Long term (4 years or more) |
| Logistics lead time variability for specialty fibers | -0.3% | Asia Pacific | Medium term (2 to 4 years) |
| Counterfeit and non certified filter proliferation | -0.3% | Emerging markets | Medium term (2 to 4 years) |
Skilled Filtration Engineering Talent Gap
The structural vulnerability stems from an aging technical workforce in fiber science and filtration media engineering, with industry association workforce surveys from bodies tracking nonwovens and filtration manufacturing indicating that a significant share of qualified media formulation engineers are within 10 years of retirement eligibility, while university enrollment in textile and fiber engineering programs has declined relative to demand over the past decade per national labor statistics bureau occupational tracking.
The quantitative friction manifests as extended new product development cycles, with time to qualify a new nanofiber or meltblown media formulation for cleanroom grade certification stretching to an estimated 18 to 24 months, roughly 30% longer than a decade ago, compounded by a documented deficit of several thousand certified filtration process engineers globally as referenced in cross industry manufacturing workforce assessments conducted by national manufacturing associations.
Long term, this forces manufacturers into costly talent retention premiums, estimated at a 15% to 20% compensation premium for senior media scientists relative to adjacent materials science roles, and pushes larger players toward automation of quality control and fiber spinning processes to offset headcount constraints, with capital reallocation toward process automation representing a multi year adjustment rather than a quick fix. Unlike a restraint, this friction does not halt current shipments but steadily caps the rate at which the industry can scale advanced media innovation to meet tightening end market specifications.
Opportunities
| Opportunity | (~) % Potential CAGR Upside | Geographic Relevance | Execution Window |
|---|---|---|---|
| Bio based and PFAS free nanofiber media commercialization | +1.3% | Europe, North America | Medium term (2 to 4 years) |
| Smart sensor embedded filtration monetization | +0.9% | North America, Asia Pacific | Long term (4 years or more) |
| Residential air quality subscription service models | +0.6% | North America | Medium term (2 to 4 years) |
| Emerging market hospital infrastructure whitespace | +0.5% | Southeast Asia, Africa | Long term (4 years or more) |
| M&A consolidation of regional media converters | +0.4% | Global | Medium term (2 to 4 years) |
Bio Based And PFAS Free Nanofiber Media Commercialization
This is classified as untapped white space rather than a current driver because commercial scale, cost competitive PFAS free nanofiber substrates remain in pilot to early commercial production stages, with only a limited number of manufacturers having qualified such media for cleanroom grade applications as of 2026, meaning the volume impact today is negligible against the baseline while the medium term addressable opportunity is sizable and largely uncaptured.
The regulatory loophole closing into a monetization window is created by the same PFAS restriction timelines referenced under Restraints, but here the strategic action required is deliberate: early movers who commercialize cellulose nanofiber or bio polymer membrane alternatives ahead of the European Chemicals Agency’s anticipated restriction entry into force could capture premium pricing, with unit economics modeling suggesting a potential 10 to 15 percentage point gross margin expansion versus commodity glass fiber media once production scales past pilot volumes, per cost structure disclosures typical of specialty materials manufacturers’ investor communications.
Cost per unit for these next generation substrates is expected to decline an estimated 20% to 30% as production moves from pilot lines to continuous roll to roll manufacturing, a trajectory tracked in materials science literature and echoed in national bioeconomy strategy funding announcements from agencies such as the U.S. Department of Energy’s advanced manufacturing office. Because this requires proactive capital investment in new production lines and certification pathways rather than simply riding existing demand, it represents genuine strategic upside above the baseline forecast rather than a factor already embedded in current growth.