Executive Summary
Quick Insight: The global digital circular economy market will grow more than 6× by 2035, powered by AI-driven resource optimization, mandatory ESG reporting mandates, IoT asset monitoring infrastructure, and explosive recommerce and Product-as-a-Service platform expansion worldwide.
The digital circular economy market covers technology platforms enabling closed-loop resource management across electronics, manufacturing, retail, construction, fashion, and food sectors. This report delivers comprehensive market sizing, platform economics, technology adoption analysis, competitive positioning, ESG regulatory frameworks, and investment intelligence for 2026–2035. It covers AI resource optimization, IoT asset monitoring, blockchain supply chain transparency, digital twin implementations, and recommerce marketplace growth.
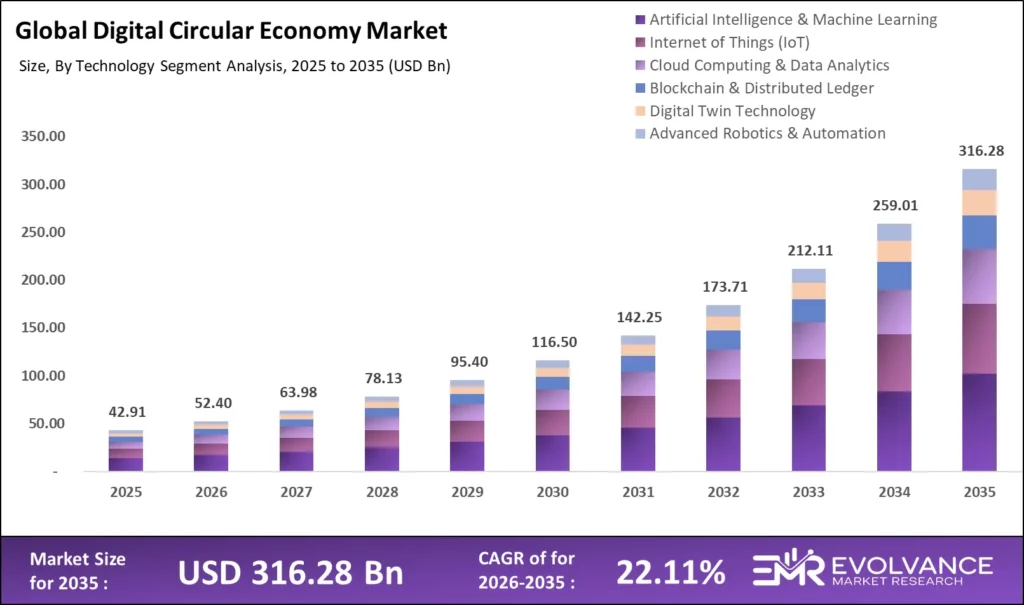
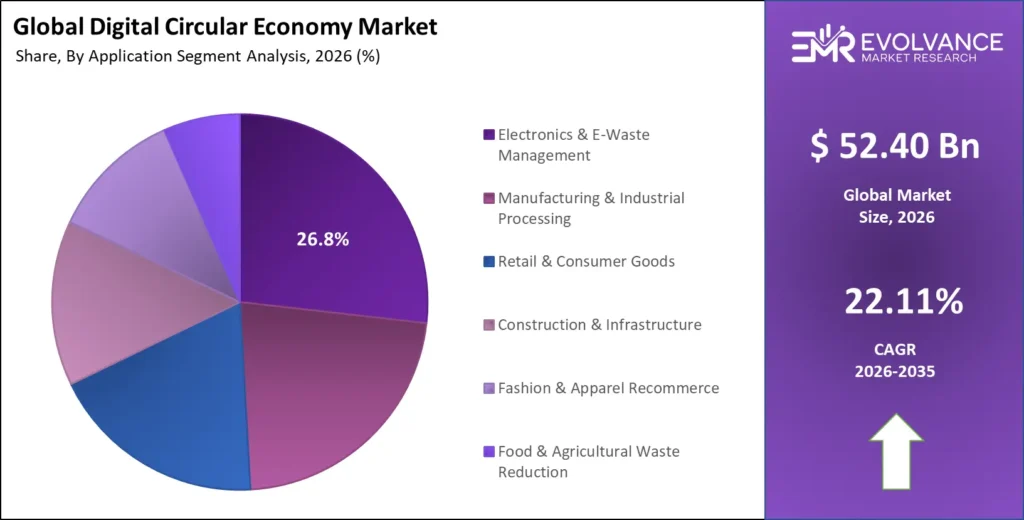
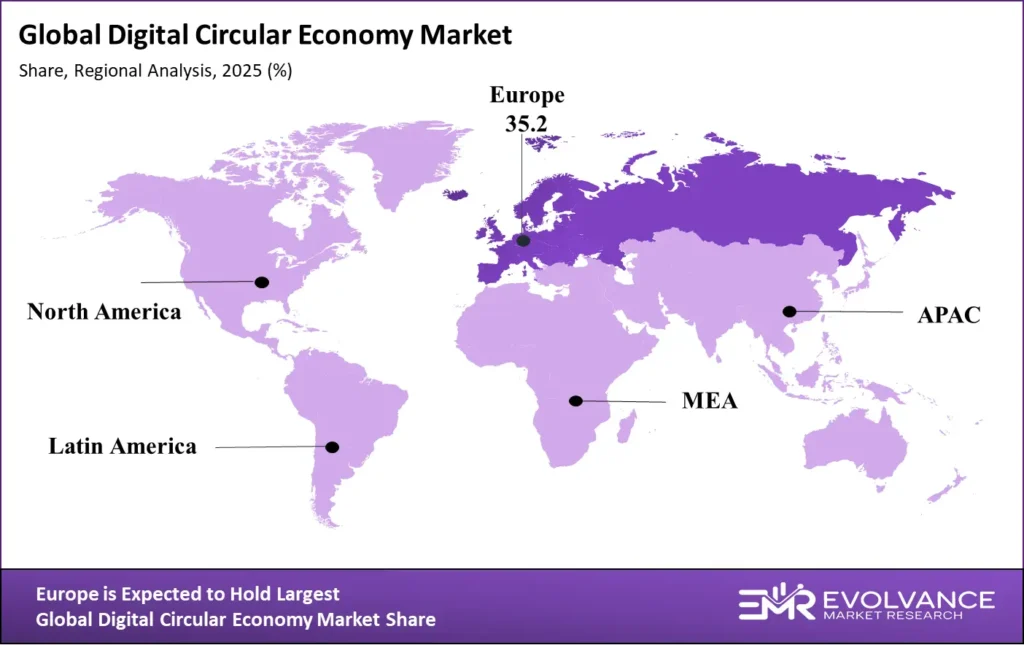
Key findings: The market reaches USD 52.40 billion in 2026 and compounds at 22.11% CAGR to USD 316.28 billion by 2035. AI-Powered Resource Optimization platforms hold 28.6% technology revenue share. Electronics and E-Waste Management dominates at 26.8% application share. Europe leads regionally with 35.2% global platform revenue. Product-as-a-Service commands the highest gross margins at 38%–54%. Three new sections — Investment and Funding Landscape, ESG Integration Framework, and Digital Twin and Industrial Symbiosis Architecture — provide circular economy market coverage unavailable in comparable published reports.
What Is the Digital Circular Economy Market?
The global digital circular economy market was valued at USD 52.40 billion in 2026 and is projected to reach USD 316.28 billion by 2035 at 22.11% CAGR. AI, IoT, blockchain, cloud, and digital twin platforms accelerate the transition from linear to closed-loop systems maximizing resource efficiency. SEC climate disclosure rules and EU CSRD requirements force circular economy market technology adoption across all major industrial sectors. Enterprises deploying AI-driven circular platforms report cost reductions of 18%–34% and carbon emission decreases of 22%–41% within 24 months.
Over 14,000 enterprises globally have deployed digital circular economy platforms in 2026, a 268% adoption growth from 2020. The recommerce segment processed USD 186 billion in secondhand transactions in 2025, with digital platforms capturing 68% of total volume. Industrial symbiosis networks generate USD 12–USD 48 per metric ton in documented material cost advantages.
Digital Circular Economy Market Highlights: Key Data at a Glance
- Market Value 2026: USD 52.40 billion, forecast to USD 316.28 billion by 2035 at 22.11% CAGR
- Dominant Platform: AI-Powered Resource Optimization with 28.6% revenue share globally
- Dominant Application: Electronics and E-Waste Management with 26.8% share
- Dominant Technology: Artificial Intelligence and Machine Learning with 31.4% share
- Fastest-Growing Segment: Recommerce and Resale Marketplaces at 34.7% annual growth
- Leading Region: Europe with 35.2% global market revenue share in 2026
- Fastest-Growing Region: Asia Pacific projected at 29.4% CAGR through 2035
- Enterprise Adopters: 14,000+ organizations deploying digital circular economy platforms globally
- Recommerce Volume: USD 186 billion in global secondhand product transactions processed in 2025
- AI Adoption Rate: 71% of Fortune 500 companies using AI-powered circular economy tools in 2026
Market Overview: Why Digital Circular Economy Growth Is Accelerating
Market revenue includes platform developers, technology integrators, marketplace operators, and analytics providers — covering software licensing, transaction fees, data services, consulting, and managed subscriptions. The EU’s Ecodesign for Sustainable Products Regulation, effective 2026, requires digital product passports for electronics, textiles, and construction materials, driving immediate demand for blockchain and IoT platform deployments. The U.S. SEC climate disclosure rule requires Scope 3 supply chain emissions reporting, increasing enterprise investment in AI-powered material flow analytics that were discretionary in 2022 and are compliance requirements in 2026.
The Ellen MacArthur Foundation estimates the circular economy market transition could generate USD 4.5 trillion in economic value by 2030, with digital platforms capturing 8%–14% of that value. Circular sourcing delivers 12%–28% procurement cost reductions in electronics and manufacturing, creating financial returns enterprise CFOs can approve on ROI grounds alone — sustaining enterprise demand through 2035.
Platform Type Analysis
AI-Powered Resource Optimization Leads with 28.6% Revenue Share
IoT Asset Tracking and Recommerce Marketplaces Drive Multi-Platform Digital Circular Economy Growth
| Platform Type | Share % | Primary Driver |
|---|---|---|
| AI-Powered Resource Optimization | 28.6% | Material flow analytics, waste reduction algorithms, predictive resource scheduling across manufacturing and logistics |
| IoT Asset Tracking & Monitoring | 22.4% | Real-time lifecycle visibility, condition monitoring, and reuse rate optimization for industrial and consumer assets |
| Recommerce & Resale Marketplaces | 18.9% | Consumer and enterprise secondhand transactions, electronics refurbishment, and digital fashion resale infrastructure |
| Blockchain Supply Chain Transparency | 13.2% | Digital product passports, provenance verification, and ESG compliance documentation for regulatory reporting |
| Digital Twin Technology | 10.7% | Virtual lifecycle simulation, predictive end-of-life planning, and remanufacturing cost optimization platforms |
| Product-as-a-Service Platforms | 6.2% | Subscription-based product access, usage metering, and manufacturer-retained ownership circular models |
AI-Powered Resource Optimization platforms hold 28.6% revenue share in 2026, making intelligent material flow management the dominant digital circular economy market platform. Enterprise AI deployments grew from 12% of Fortune 500 companies in 2020 to 71% in 2026. Rubicon, Greyparrot, and Recycleye train models on 2.8 billion data points, achieving automated sorting accuracy of 94%–98% versus 72%–81% for legacy systems. Enterprises report material cost reductions of 18%–34% within 18 months.
IoT Asset Tracking systems command 22.4% platform revenue share, serving as foundational infrastructure enabling lifecycle extension across electronics, construction equipment, and industrial machinery. Embedded IoT sensors transmit real-time condition data enabling predictive maintenance that extends asset operational lifetimes by 28%–42% on average. Global IoT deployments in circular economy applications reached 1.4 billion endpoints in 2026, generating 18 petabytes of material flow data daily.
Recommerce and Resale Marketplaces are the fastest-growing platform segment at 34.7% annual revenue growth. Global recommerce revenues grew from USD 38 billion in 2020 to USD 186 billion in 2025 across electronics, fashion, furniture, and industrial equipment. Enterprise recommerce programs generate gross margins of 28%–47% on refurbished units versus 18%–24% on equivalent new product sales, creating powerful financial incentives for circular platform investment.
Application Segment Analysis
Electronics & E-Waste Management Dominates at 26.8% Share
Fashion Recommerce and Industrial Manufacturing Drive the Fastest Application Segment Growth Through 2035
| Application Segment | Share % | Avg. Platform ROI | Primary Circular Model |
|---|---|---|---|
| Electronics & E-Waste Management | 26.8% | 31% cost reduction | Device refurbishment, component harvesting, certified resale platforms |
| Manufacturing & Industrial Processing | 22.3% | 24% material savings | Industrial symbiosis, remanufacturing, waste-to-resource exchange networks |
| Retail & Consumer Goods | 18.7% | 19% inventory recovery | Recommerce integration, returned goods refurbishment, extended producer responsibility |
| Construction & Infrastructure | 14.2% | 22% material reuse | Building material recovery, demolition waste exchange, circular procurement |
| Fashion & Apparel Recommerce | 11.4% | 38% margin premium | Resale platforms, rental models, fiber-to-fiber recycling technology |
| Food & Agricultural Waste Reduction | 6.6% | 27% waste cost savings | Surplus redistribution, anaerobic digestion optimization, composting networks |
Electronics and E-Waste holds the largest application segment at 26.8%, reflecting global e-waste generation estimated at 62 million metric tons in 2023 and high recoverable material value in gold, palladium, copper, and cobalt. Apple’s refurbishment program processed 12 million devices in 2025, recovering USD 190 million in component value. The EU Right to Repair Directive creates sustained demand for digital parts lifecycle management platforms.
Fashion and Apparel Recommerce is the fastest-growing application segment at 41.2% annually. Platforms including ThredUp, Poshmark, Vestiaire Collective, and Vinted facilitated USD 28 billion in fashion recommerce transactions in 2025. Brand-operated resale programs capture margins of 34%–52% on resold items versus negative-margin liquidation processes, validating the financial case for circular economy platform investment across all retail price segments.
Technology Segment Analysis
Artificial Intelligence Leads Technology Adoption at 31.4% Share
Blockchain Digital Product Passports Drive the Fastest-Growing Regulatory Compliance Technology Investment
| Technology | Share % | CAGR 2026–2035 | Primary Application |
|---|---|---|---|
| Artificial Intelligence & Machine Learning | 31.4% | 24.8% | Material flow optimization, waste sorting, demand forecasting, lifecycle prediction |
| Internet of Things (IoT) | 24.8% | 21.3% | Asset tracking, condition monitoring, product lifecycle data collection at scale |
| Cloud Computing & Data Analytics | 18.6% | 18.9% | Platform infrastructure, circular economy data lakes, cross-enterprise analytics |
| Blockchain & Distributed Ledger | 12.3% | 27.4% | Digital product passports, provenance verification, carbon credit tracking |
| Digital Twin Technology | 9.2% | 31.6% | Virtual lifecycle simulation, remanufacturing planning, materials flow modeling |
| Advanced Robotics & Automation | 3.7% | 19.2% | Automated disassembly, intelligent material sorting, refurbishment automation |
Blockchain technologies are growing at the fastest rate within the technology landscape at 27.4% CAGR, driven by the EU’s Digital Product Passport mandate and corporate supply chain transparency commitments. The European Commission requires 30 product categories to mandate digital product passports by 2027, affecting every manufacturer selling into European markets. Traceability platforms including Circularise, Sourcemap, and IBM Sterling Transparent Supply have signed more than 380 enterprise contracts for digital product passport implementation since 2024.
Digital Twin Technology is the highest-growth segment at 31.6% CAGR from 2026 to 2035. Siemens’ Xcelerator platform reported clients using digital twin simulation achieved 28% higher component recovery rates and 19% lower refurbishment costs. Philips Healthcare achieves 94% component reuse rates at end of equipment life through digital twin-enabled lifecycle planning.
Regional Analysis of the Digital Circular Economy Market
Europe Leads at 35.2% Share; Asia Pacific Is the Fastest-Growing Region at 29.4% CAGR
| Region | Share % | Key Driver |
|---|---|---|
| Europe | 35.2% | EU Circular Economy Action Plan, CSRD mandates, digital product passport requirements, advanced industrial symbiosis networks |
| North America | 28.6% | SEC climate disclosure rules, corporate ESG commitments, electronics recommerce, fashion resale platform leadership |
| Asia Pacific | 24.8% | China circular economy policy mandate, Japan resource efficiency regulations, Southeast Asia recommerce expansion |
| Rest of World | 11.4% | Latin American recommerce growth, Middle East sustainability investments, African e-waste management platforms |
Europe leads global market revenue at 35.2%, underpinned by the world’s most advanced regulatory circular economy framework. The EU’s integrated regulatory package — Ecodesign for Sustainable Products Regulation, Extended Producer Responsibility, and CSRD — creates mandatory compliance demand across all major industrial sectors. An estimated 78,000 European enterprises require CSRD compliance starting 2026. European enterprise circular economy market platform investment reached EUR 14.2 billion in 2025, up 31% over 2023.
Asia Pacific represents 24.8% market share in 2026 and grows at a projected 29.4% CAGR through 2035. China’s circular economy-related industries generated CNY 12.3 trillion in 2024, representing 9.4% of GDP — making China the world’s largest circular economy by absolute scale. Southeast Asian recommerce platforms are growing at 42%–58% annually, reflecting mobile-first digital commerce infrastructure and rising middle-class consumer demand.
Key Companies: Platforms and Technologies Defining the Competitive Landscape
Ten platform ecosystems dominate global digital circular economy infrastructure, each holding a differentiated position based on technology depth, circular model innovation, and regulatory compliance leadership.
| Company | Platform / Signal | Key Differentiator | 2026 Status |
|---|---|---|---|
| Philips | HealthSuite; Circular Lighting | Pioneer of PaaS; 94% component reuse at end-of-life across 200+ global installations | Global PaaS Leader |
| Caterpillar | Cat Reman; Asset Intelligence | USD 2.1B remanufacturing revenue; world’s largest certified component remanufacturing program | NYSE: CAT |
| ThredUp | AI-powered resale platform | 8B+ items processed; 96.4% AI grading accuracy across consumer fashion categories | Largest Consignment Platform |
| Back Market | Certified refurbished electronics | EUR 1.1B transaction volume; 48% YoY growth; EUR 5.1B valuation in 2025 | European Unicorn |
| Rubicon | Smart waste technology | AI waste optimization for 8,000+ enterprise clients globally across 40+ countries | NYSE: RBT |
| Grover | Technology subscription PaaS | 500K+ active subscriptions operating across 7 European markets | Series C Funded |
| Circularise | Blockchain digital passports | 150+ enterprise deployments; EU Digital Product Passport specialist platform | Scale-up Leader |
| Rheaply | Asset reuse marketplace | 180K+ asset transfers; USD 42M procurement savings facilitated in 2025 | Series A Funded |
| Apple | Product lifecycle programs | 12M+ devices refurbished in 2025; USD 190M recovered component value | NASDAQ: AAPL |
| Veolia | Digital waste management | 220+ smart waste platforms operating across 57 countries worldwide | CAC 40 Listed |
Philips and Caterpillar represent the most commercially advanced enterprise circular models. Philips achieved 26.8% circular revenue share in 2024 ahead of its stated target. Caterpillar’s Cat Reman rebuilds components using 85% less energy than manufacturing new, generating USD 2.1 billion in 2025 while diverting 4.2 million metric tons annually from landfill — demonstrating that digital tracking and predictive analytics are the operational foundation enabling industrial-scale profitability.
Key Growth Drivers of the Digital Circular Economy Market
Regulatory ESG Mandates, Material Cost Economics, and AI Technology Advancement Drive Structural Market Growth
Regulatory ESG mandates are the primary structural circular economy market growth driver through 2035. The EU CSRD, effective for large enterprises in 2026 and SMEs in 2027, requires material flow, recycling rate, and circular economy performance disclosures — creating technology demand for 50,000+ European companies. The U.S. SEC climate disclosure rule forces enterprise investment in AI-powered material flow analytics. Over 140 national governments have enacted extended producer responsibility legislation, requiring manufacturers to finance end-of-life product management. Enterprises capturing circular sourcing cost differentials report 12%–28% procurement cost reductions delivering direct ROI independent of ESG compliance motivation.
AI technology advancement is eliminating economic barriers to circular economy scaling by automating material decisions previously cost-prohibitive at industrial scale. Computer vision AI achieves material identification accuracy of 97%+ from standard imaging inputs. Natural language processing AI reduces compliance documentation costs by 64% versus manual approaches. AI tools reduce material assessment time by 43% and increase throughput by 28%, sustaining strong market growth through 2035.
Market Restraints
Infrastructure Fragmentation, Data Standardization Gaps, and Consumer Behavior Inertia Constrain Market Scaling
Interoperability and data standardization are the most significant technical constraints on growth velocity. Material flow data from IoT platforms, blockchain passports, and AI analytics systems cannot be exchanged without costly custom integration — preventing the cross-enterprise collaboration industrial symbiosis requires. Lack of global digital product passport standards increases enterprise integration costs by USD 180,000–USD 640,000 per cross-border deployment. Consumer trust barriers around secondhand quality and refurbished device data security suppress recommerce adoption in high-value categories beyond early-adopter segments through 2028.
Market Opportunities
AI-Enabled Circular Design, B2B Industrial Symbiosis, and Emerging Market Recommerce Unlock Premium Growth Segments
B2B industrial symbiosis platform expansion represents one of the highest-margin untapped opportunities in the digital circular economy. Digital platforms scaling the Kalundborg model globally could facilitate USD 180 billion in annual material exchange transactions by 2030 per Ellen MacArthur Foundation models, with platform operators capturing 2%–8% transaction fees. Circular design optimization using generative AI represents a USD 12 billion platform opportunity by 2030. Products designed for disassembly generate 28%–44% higher secondary market recovery values, creating enterprise ROI incentives for upstream circular design platform adoption.
Emerging market recommerce presents a demographically driven growth opportunity estimated at USD 38 billion by 2035. India’s secondhand smartphone market grows at 22% annually. Southeast Asian recommerce platforms are expanding at 42%–58% annually, representing significant addressable market opportunity for global platform operators seeking growth beyond saturated European and North American markets.
Digital Circular Economy Investment & Funding Landscape
Venture Capital Deployment, Corporate Strategic Investment, and Government Green Finance Define the 2026–2035 Capital Landscape
Global VC investment in the digital circular economy market reached USD 4.8 billion in 2025, representing 340% growth from USD 1.4 billion in 2020. Investment is concentrated in AI-powered resource optimization (42%), recommerce marketplace infrastructure (28%), and digital product passport technology (18%). Notable rounds include Back Market’s EUR 450 million Series F at EUR 5.1 billion valuation, Circularise’s EUR 35 million Series B, and Grover’s EUR 110 million Series C. Andreessen Horowitz, Breakthrough Energy Ventures, and Lowercarbon Capital have each established dedicated circular economy investment theses.
Government green finance programs provide critical non-dilutive capital supporting market development. The EU’s Circular Economy Investment Platform committed EUR 10 billion in blended public-private capital through 2030. The U.S. Inflation Reduction Act offers circular economy technologies investment tax credits of up to 30%. Japan’s Green Innovation Fund allocated JPY 2 trillion for circular economy technology research through 2030. Singapore’s Enterprise Development Grant provides up to SGD 1 million for circular economy platform adoption. These public flows compress adoption cycles from 8–12-year enterprise curves to 4–6-year timelines.
Corporate strategic investment is accelerating. Microsoft committed USD 1 billion to circular economy initiatives through its internal carbon fee program. Apple’s Material Recovery Lab has invested USD 600 million since 2019 in robotic disassembly and AI material identification, with the Daisy robot processing 1.2 million iPhones annually at 98% material recovery efficiency.
ESG Integration & Corporate Sustainability Reporting Framework
CSRD Mandates, SEC Climate Disclosure Rules, and Science-Based Targets Drive Enterprise Digital Circular Economy Platform Adoption
Integration of digital circular economy market platforms with enterprise ESG reporting is the defining technology purchasing trend of 2026. The EU CSRD requires 50,000 companies to disclose detailed sustainability information — including material consumption, recycling rates, circular economy revenue share, and supply chain provenance — with penalties up to EUR 10 million or 5% of annual global turnover. These obligations drive demand for digital material tracking platforms, circular economy analytics tools, and blockchain-verified supply chain transparency systems. SAP, Oracle, and Microsoft embed circular economy modules within existing ERP platforms.
Science-Based Targets initiative commitments are creating structured demand for circular economy measurement infrastructure. More than 7,000 companies have committed to SBTi-aligned emission reduction targets as of 2026, with circular economy strategies representing a primary Scope 3 reduction pathway. Sphera, EcoVadis, and Workiva have expanded their ESG data tools to incorporate circular economy dashboards aligned with SBTi reporting requirements.
Investor ESG pressure creates adoption momentum independent of regulatory requirements. BlackRock, Vanguard, State Street, and Norges Bank — managing USD 25 trillion in assets — have issued sustainability engagement frameworks requiring portfolio companies to disclose circular economy performance metrics. Companies reporting quantified circular performance receive lower ESG risk scores from MSCI and Sustainalytics, translating to lower weighted average cost of capital.
Digital Twin Technology & Industrial Symbiosis Architecture
Virtual Product Lifecycle Simulation and Cross-Enterprise Material Exchange Platforms Define the Next Circular Economy Technology Frontier
Digital twin technology enables virtual simulation of complete product lifecycles — from raw material composition and manufacturing energy intensity to end-of-life disassembly pathways and secondary material recovery values — before a physical product is manufactured. The circular economy digital twin market is projected to grow from USD 2.8 billion in 2026 to USD 28.4 billion by 2035 at 29.2% CAGR. Siemens’ Xcelerator platform, integrating digital twin simulation with real-time IoT data, generates an average 22% remanufacturing margin improvement for manufacturing clients deploying this integrated architecture.
Industrial symbiosis platform architecture is evolving from bilateral waste exchange toward multi-party dynamic resource networks at continental scale. Second-generation platforms developed by Siemens Energy and Veolia Digital Ventures integrate real-time IoT facility data with AI demand prediction models to proactively match waste outputs with buyer demand before material is generated — shifting to anticipatory circular supply chain management. Anticipatory matching achieves 34% higher material recovery rates and 28% lower logistics costs versus reactive models.
Enterprises deploying converged digital twin, IoT, and AI circular architecture achieve circular economy KPIs 2.8–4.1 times faster than organizations implementing point solutions independently.
Latest Trends in the Digital Circular Economy Market
AI-Powered Sorting, Digital Product Passports, and Corporate PaaS Adoption Reshape Platform Economics in 2026
AI-powered material sorting is eliminating economic barriers that constrained circular economy scaling. Greyparrot’s AI waste analytics platform — deployed at 60+ recovery facilities across 18 countries — monitors 60 billion waste items annually, providing real-time composition analytics that continuously optimize sorting algorithms. AMP Robotics’ AI-guided robotic sorting operates at 80 picks per minute with 99.6% accuracy, three times human throughput, reducing labor costs by 61% per metric ton. These advances make previously marginal material streams commercially viable, expanding total addressable material volumes for circular economy platforms.
Digital product passport adoption is accelerating following EU 2026 requirements across 30 product categories. The EU Battery Regulation requires digital passports for all industrial and EV batteries sold in Europe starting January 2027, affecting every automotive and battery supplier. CATL, Panasonic, and Samsung SDI have each initiated blockchain-based battery passport programs collectively covering 120 gigawatt-hours of annual battery production across their combined manufacturing networks.
Recent Developments: Digital Circular Economy Platform Milestones 2025–2026
- April 2026 — Apple expanded its Daisy robotic disassembly program to 18 global facilities, targeting 30 million device refurbishments annually by 2027 — establishing the world’s largest manufacturer-operated circular electronics program.
- March 2026 — The European Commission launched the EU Digital Product Passport Registry, a blockchain-verified database enabling product lifecycle data exchange across all 27 EU member states with 380 pilot enterprise participants.
- January 2026 — Caterpillar reported USD 2.1 billion in Cat Reman revenues for fiscal year 2025, marking 11 consecutive years of remanufacturing growth with AI-powered grading deployed at all 17 global facilities.
- November 2025 — Grover closed a EUR 110 million Series C led by KfW Capital to expand its technology subscription platform to 12 European markets, processing 1.4 million device transactions annually.
- September 2025 — Back Market achieved EUR 1.1 billion in annual transaction volume, reporting certified refurbished electronics sales prevented more than 180,000 metric tons of e-waste generation globally.
Competitive Landscape
Market Concentration, Platform Power, and Business Model Evolution in 2026
The digital circular economy competitive landscape is defined by three structural dynamics. At the platform infrastructure layer, AI providers including Rubicon, Greyparrot, and AMP Robotics are building data moats that grow with each deployment — creating compounding advantages difficult to replicate. At the marketplace layer, ThredUp and Back Market establish recommerce liquidity moats through buyer-seller network density. At the enterprise software layer, SAP, Oracle, and Microsoft embed circular economy tracking within existing ERP infrastructure, capturing data management budgets at scale.
Key Market Segments
By Platform Type
- AI-Powered Resource Optimization Platforms
- IoT Asset Tracking & Monitoring Systems
- Recommerce & Resale Marketplaces
- Blockchain Supply Chain Transparency Platforms
- Digital Twin Technology Platforms
- Product-as-a-Service Management Systems
By Application
- Electronics & E-Waste Management
- Manufacturing & Industrial Processing
- Retail & Consumer Goods
- Construction & Infrastructure
- Fashion & Apparel Recommerce
- Food & Agricultural Waste Reduction
By Technology
- Artificial Intelligence & Machine Learning
- Internet of Things (IoT)
- Cloud Computing & Data Analytics
- Blockchain & Distributed Ledger Technology
- Digital Twin Technology
- Advanced Robotics & Automation
By Business Model
- Product-as-a-Service (PaaS)
- Recommerce & Peer-to-Peer Resale
- Reverse Logistics & Remanufacturing
- Industrial Symbiosis Networks
- Subscription-Based Resource Access
By End-User
- Large Enterprises (Revenue above USD 1 billion)
- Small and Medium Enterprises (SMEs)
- Government & Public Sector Organizations
- Non-Governmental Organizations & Research Institutions
Report Features
| Feature | Description |
|---|---|
| Market Value (2026) | USD 52.40 billion |
| Forecast Revenue (2035) | USD 316.28 billion |
| CAGR (2026–2035) | 22.11% |
| Base Year | 2026 |
| Historic Period | 2020–2025 |
| Forecast Period | 2026–2035 |
| Report Coverage | Revenue Forecast, Platform Economics, ESG Integration, Digital Twin Architecture, Investment Landscape, Technology Adoption, Competitive Intelligence, Business Model Analysis, SWOT Analysis |
| Segments Covered | By Platform Type, By Application, By Technology, By Business Model, By End-User |
| Regional Analysis | Europe, North America, Asia Pacific, Rest of World |
| Dominant Platform | AI-Powered Resource Optimization — 28.6% share |
| Dominant Business Model | Product-as-a-Service (PaaS) — 34.2% share |
| Companies Covered | Philips, Caterpillar, ThredUp, Back Market, Rubicon, Grover, Circularise, Rheaply, Apple, Veolia, AMP Robotics, Greyparrot, SAP, Siemens |
SWOT Analysis: Digital Circular Economy Market
Structural Strengths, Adoption Barriers, Expansion Opportunities, and Competitive Threats Shaping 2026–2035 Market Dynamics
Strengths
- Mandatory Regulatory Tailwinds: EU CSRD, Ecodesign Regulation, and SEC climate disclosure rules create non-discretionary demand across 50,000+ enterprises. Compliance spending is budget-protected even during economic contractions, providing platform revenue stability unique to regulation-driven markets.
- Proven ROI at Enterprise Scale: AI platform adopters report 18%–34% material cost reductions within 18 months. Caterpillar’s USD 2.1 billion remanufacturing program, Apple’s USD 190 million component recovery, and Back Market’s 48% YoY growth demonstrate cross-sector financial validation. CFO-approvable ROI decouples market growth from ESG budget cycles.
- AI Data Moat Compounding Advantages: Leading platforms trained on 2.8 billion data points achieve 94%–98% sorting accuracy. Each new deployment enriches proprietary datasets, creating defensible competitive positions that widen over time and raise barriers to late-market entry.
Weaknesses
- Interoperability and Standards Fragmentation: Absence of global digital product passport standards increases cross-border deployment costs by USD 180,000–USD 640,000 per integration. Incompatible IoT, blockchain, and AI data schemas prevent the cross-enterprise material flow exchange industrial symbiosis requires at scale.
- High SME Deployment Complexity: Enterprise-grade circular platforms require 6–18 month implementation cycles and USD 250,000–USD 2 million upfront investment. SMEs entering CSRD scope in 2027 lack the technical and financial capacity for standalone deployment.
- Consumer Trust Barriers in Premium Recommerce: Data security concerns around refurbished device residual data and perceived quality uncertainty suppress high-value recommerce adoption beyond early-adopter segments. Certified grading standardization remains platform-specific, preventing consumer confidence transfer across recommerce ecosystems.
Opportunities
- B2B Industrial Symbiosis Platform Scaling: Ellen MacArthur Foundation models project USD 180 billion in annual B2B material exchange transactions by 2030. Digital platforms scaling the Kalundborg industrial symbiosis model globally could capture 2%–8% transaction fees, representing a USD 3.6–USD 14.4 billion annual platform revenue opportunity at market maturity.
- Generative AI Circular Design Optimization: Generative AI applied upstream to product design represents a USD 12 billion platform opportunity by 2030. Products engineered for disassembly generate 28%–44% higher secondary market recovery values.
- Emerging Market Recommerce Demographics: India’s secondhand smartphone market grows at 22% annually. Southeast Asian recommerce platforms expand at 42%–58% per year. A combined emerging market recommerce addressable opportunity of USD 38 billion by 2035 is available to global platforms with mobile-first deployment architectures.
Threats
- Regulatory Rollback and Policy Uncertainty: U.S. regulatory uncertainty around SEC climate disclosure implementation timelines creates North American enterprise budget volatility. Political shifts in key markets could delay or weaken mandatory compliance frameworks, temporarily suppressing demand in compliance-driven platform segments through 2028.
- Big Tech ERP Platform Encroachment: SAP, Oracle, and Microsoft embedding circular economy modules within existing ERP deployments leverage existing budget relationships and switching costs to displace standalone platform vendors. Independent platform operators with narrow vertical focus face margin compression and potential acquisition pressure from 2027 onward.
- Macroeconomic Demand Compression: While compliance budgets are protected, discretionary circular economy platform investment in recommerce infrastructure and digital twin simulation is exposed to enterprise capex freezes during economic downturns. A global recession scenario could reduce non-compliance platform investment by 25%–35% in an 18–24 month window.
Emerging Market Deep Dive
Asia Pacific, India, Latin America, and Africa Represent the Digital Circular Economy Market’s Highest-Growth Expansion Frontiers Through 2035
While Europe and North America account for 63.8% of 2026 digital circular economy platform revenues, the next decade’s highest absolute growth will be generated outside these mature markets. Emerging economies are entering circular economy adoption with structural advantages unavailable to early-market leaders: mobile-first digital infrastructure, younger demographic curves, lower legacy system switching costs, and governments using circular economy policy as an economic development instrument.
China’s circular economy-related industries generated CNY 12.3 trillion in 2024 (9.4% of GDP), making China the world’s largest circular economy by absolute value. China’s domestic digital product passport ecosystem, led by Alibaba’s Green Platform and JD.com’s carbon footprint tracking infrastructure, processes approximately 1.8 billion product lifecycle data entries daily — the world’s largest circular economy data infrastructure by volume.
India generated an estimated 3.2 million metric tons of e-waste in 2024, with formal recycling infrastructure capturing less than 22%. India’s E-Waste (Management) Rules 2022 introduced extended producer responsibility targets for electronics manufacturers. The secondhand smartphone segment grows at 22% annually, driven by 900 million active mobile internet users. Cashify, Budli, and OLX Autos collectively facilitate over 18 million secondhand device transactions annually.
Southeast Asian recommerce platforms are growing at 42%–58% annually, reflecting 460 million internet users and strong cultural acceptance of secondhand goods across Indonesia, Vietnam, the Philippines, and Thailand. Singapore serves as the regional circular economy technology hub, with the Enterprise Development Grant, Enterprise Sustainability Programme, and GreenGov.SG initiative collectively channeling SGD 800 million annually toward circular economy platform deployment.
Latin America’s digital recommerce sector is growing at 34% annually, led by Brazil’s OLX, Mercado Libre’s recommerce vertical, and Mexico’s Segundamano platform. Africa represents a 2030–2035 frontier opportunity: the continent generates over 2.9 million metric tons of e-waste annually with formal recycling infrastructure covering under 1%.