Executive Summary
Quick Insight: The U.S. hospital bed management software market is set to more than double by 2035, driven by AI-powered capacity management, EHR interoperability mandates, and escalating pressure on hospitals to reduce emergency department boarding times and average length of stay.
The U.S. hospital bed management software market is the fastest-growing segment within healthcare IT operational management. This report analyzes hospital bed management system market size, deployment dynamics, end-user economics, solution revenue structure, competitive positioning, and regulatory requirements for 2026–2035. It covers 6,120 acute care hospitals, 15,600 long-term care facilities, and 1,400+ critical access hospitals. Decision-makers in hospital administration, health system IT, healthcare private equity, and software vendor sales will find data-driven frameworks for capital allocation, vendor selection, and market entry planning through 2035.
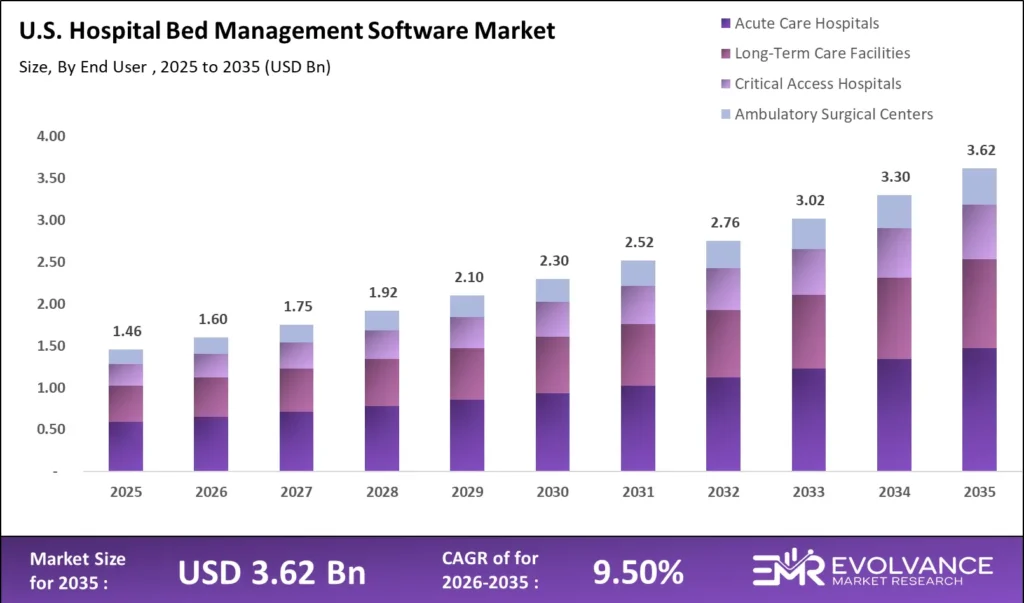
Key findings: The U.S. hospital bed management software market size reaches USD 1.60 billion in 2026, compounding at 9.50% CAGR to USD 3.62 billion by 2035. Cloud-based deployment commands 59.3% of revenue. AI predictive analytics adopted by 38.7% of health systems with 500+ beds.
What Is the U.S. Hospital Bed Management Software Market?
The U.S. hospital bed management software market size was valued at USD 1.60 billion in 2026 and is projected to reach USD 3.62 billion by 2035, growing at a CAGR of 9.50% during the forecast period 2026 to 2035. Escalating hospital capacity pressures — driven by an aging population, rising chronic disease prevalence, and post-pandemic care backlogs — are primary growth drivers. Adoption of AI-powered patient flow management platforms and CMS interoperability mandates requiring real-time ADT data sharing are accelerating hospital bed management system and software deployment timelines across all hospital segments.
The U.S. hospital ecosystem includes 6,120 registered acute care hospitals. Bed management software delivers real-time patient flow management visibility across medical, surgical, and ICU units. Health systems report length of stay reductions of 0.4–1.1 days and ED throughput gains of 12%–28% post-deployment.
U.S. Hospital Bed Management Software Market Highlights: Key Data at a Glance
- Market value: USD 1.60 billion in 2026, forecast to USD 3.62 billion by 2035 at 9.50% CAGR
- Dominant deployment mode: Cloud-Based with 59.3% revenue share
- Dominant end user: Acute Care Hospitals with 44.6% share
- Dominant bed type: Acute Care Beds with 47.2% software configuration share
- Fastest-growing solution type: AI-Powered Predictive Capacity Analytics at 18.9% annual growth
- Total registered acute care hospitals: 6,120 facilities, 4,749 acute care classified by CMS
- Leading software vendors: Epic Systems, Oracle Health, TeleTracking Technologies, Qventus, LeanTaaS
- Average length of stay reduction: 0.4 to 1.1 days per patient following full platform deployment
- EHR interoperability compliance: Mandated under CMS Interoperability Final Rule effective 2024–2026
- AI adoption rate: 38.7% of health systems with 500+ beds deploy predictive analytics in 2026
Market Overview: Why U.S. Hospital Bed Management Software Growth Is Accelerating
This market includes revenue from hospital bed management software and system platforms for patient flow management, discharge coordination, and capacity forecasting across U.S. healthcare facilities. Growth is accelerating as hospital COOs have resolved implementation uncertainty — clinical validation data from Kaiser Permanente, HCA Healthcare, and CommonSpirit Health confirms measurable throughput gains. By 2026, multidisciplinary discharge management requires 5.7 coordinated interactions per patient, up from 3.2 in 2022, making manual bed tracking operationally unsustainable at scale.
Regulatory pressure is a structural tailwind. The CMS Interoperability Final Rule requires hospitals to exchange real-time ADT data via standardized APIs. Platforms like TeleTracking and Epic Capacity IQ now process 2.3 million bed transactions daily across U.S. health systems.
Deployment Mode Analysis
Cloud-Based Deployment Dominates with 59.3% Revenue Share
SaaS Architecture Accelerates Adoption Among Mid-Size and Community Hospital Networks
| Deployment Mode | Share % | 2026 Revenue (USD M) | Primary Driver |
|---|---|---|---|
| Cloud-Based (SaaS / Hosted) | 59.3% | USD 676 million | Lower upfront capex, automatic updates, multi-site scalability for regional health systems |
| On-Premises | 28.4% | USD 324 million | Data sovereignty requirements, air-gapped security compliance for government and VA hospital systems |
| Hybrid (Cloud + On-Premises) | 12.3% | USD 140 million | Phased migration strategy for large IDNs transitioning legacy infrastructure to cloud architecture |
Cloud-based deployment holds a 59.3% revenue share in 2026, making SaaS the dominant architecture in U.S. hospital IT procurement. The shift accelerated between 2022 and 2025 as COVID-19 exposed the limitations of on-premises platforms during multi-facility patient flow management crises. Health systems operating 10 or more hospitals report IT infrastructure cost reductions of 22%–34% after migrating to cloud platforms. Automatic updates, multi-site dashboards, and subscription pricing are the primary procurement advantages cited in 2026 hospital RFP evaluations for bed management software.
On-premises retains 28.4% share among VA medical centers and DoD hospitals requiring air-gapped security. Hybrid deployment is expanding among IDNs executing multi-year cloud migrations, preserving real-time bed management continuity during infrastructure transitions.
End-User Analysis
Acute Care Hospitals Lead with 44.6% Software Revenue Share
Long-Term Care and Critical Access Hospitals Represent High-Growth Adoption Segments Through 2035
| End-User Segment | Share % | Avg. Annual Contract | Primary Software Need |
|---|---|---|---|
| Acute Care Hospitals (General) | 44.6% | USD 280,000–USD 1.8M | Real-time bed tracking, ED throughput optimization, discharge coordination |
| Health System / IDN (10+ facilities) | 26.3% | USD 1.2M–USD 8.5M | Centralized capacity command centers, multi-facility patient transfer optimization |
| Long-Term Care & Post-Acute Facilities | 14.2% | USD 42,000–USD 180,000 | Occupancy management, CMS compliance reporting, discharge transition tracking |
| Critical Access Hospitals (<25 beds) | 9.7% | USD 28,000–USD 95,000 | Rural patient placement, transfer coordination, CMS interoperability mandate compliance |
| Ambulatory Surgical Centers | 5.2% | USD 18,000–USD 64,000 | Same-day surgery throughput, recovery bay utilization, patient flow analytics |
Acute care hospitals hold a 44.6% revenue share in 2026, reflecting both facility volume and operational complexity that drives high contract values. Large health systems and IDNs represent the highest-value segment, with enterprise agreements averaging USD 1.2 million to USD 8.5 million annually, inclusive of implementation and support. The 10 largest U.S. health systems — including HCA Healthcare, CommonSpirit Health, Ascension, and Tenet Healthcare — collectively manage 1,800+ acute care hospitals, representing the largest hospital bed management software market size concentration by revenue.
Long-term care facilities are the fastest-growing segment by new deployments. CMS Value-Based Purchasing incentives for reduced readmissions are driving post-acute operators to adopt transition tracking software. Critical access hospitals accelerated procurement following 2024 CMS ADT mandate enforcement.
Bed Type Analysis
Acute Care Bed Configuration Drives 47.2% of Software Deployment Volume
Critical Care Unit Software Investment Grows at 14.6% Annually as ICU Capacity Optimization Becomes a Board-Level Priority
| Bed Type | Deployment Share % | Avg. Software Config Value | Key Analytics Requirement |
|---|---|---|---|
| Acute Care / Medical-Surgical | 47.2% | USD 1,200 per bed/yr | Real-time availability, cleaning status, admission queue management |
| Critical Care / ICU / NICU | 22.8% | USD 2,400 per bed/yr | Acuity scoring integration, ventilator availability, multi-organ support tracking |
| Rehabilitation & Step-Down | 14.6% | USD 980 per bed/yr | Functional milestone tracking, discharge readiness scoring, payer authorization |
| Long-Term / Skilled Nursing | 10.9% | USD 640 per bed/yr | Occupancy rate optimization, CMS MDS compliance, readmission risk flagging |
| Behavioral Health / Psychiatric | 4.5% | USD 820 per bed/yr | Hold tracking, involuntary admission compliance, observation bed management |
Acute care and medical-surgical beds represent 47.2% of software deployment share, reflecting general care bed volume in U.S. hospital infrastructure. ICU bed management integrates acuity scoring, ventilator tracking, and isolation compliance — generating USD 2,400 per bed annually, nearly double medical-surgical rates. Reducing critical care length of stay and optimizing patient flow management across ICU-to-step-down transitions is a board-level priority. COVID-19 created lasting urgency, and health systems have allocated disproportionate IT investment to critical care management platforms since 2022.
Solution Type Analysis
Real-Time Bed Tracking Leads Revenue Share; Predictive Analytics Is the Fastest-Growing Segment
AI-Assisted Discharge Management Emerging as Highest-ROI Solution Type in 2026
| Solution Type | Revenue Share % | Growth Rate (YoY) | Primary Buyer |
|---|---|---|---|
| Real-Time Bed Tracking & Status Boards | 34.8% | 9.2% | Hospital COOs, nursing operations directors |
| Discharge & Care Transition Management | 22.6% | 12.4% | Case management departments, CMOs |
| AI-Powered Predictive Capacity Analytics | 18.3% | 18.9% | Health system CFOs, capacity management executives |
| ADT Integration & EHR Interoperability | 15.7% | 11.6% | CIOs, HIT directors, compliance officers |
| Centralized Command Center Platforms | 8.6% | 15.2% | IDN CEOs, regional operations executives |
Real-time bed tracking holds a 34.8% revenue share as the foundational patient flow management entry-point solution for U.S. hospital deployments. Digital bed boards replacing manual whiteboards now operate in 73% of U.S. acute care hospitals. Discharge management software has grown rapidly since CMS tied reimbursement to readmission rates under the Hospital Readmissions Reduction Program. AI predictive analytics is the highest-growth segment at 18.9% annually — health systems forecast census fluctuations 4–8 hours in advance at 85%+ accuracy, enabling proactive staffing that measurably reduces length of stay and boarding time.
Centralized command center platforms deliver the highest total contract value, with enterprise deployments averaging USD 3.4 million to USD 12 million. IDN operators report 15%–31% internal transfer time reductions and annual operational savings of USD 4.2–18.7 million.
Hospital Size Analysis
Large Health Systems Drive Revenue; Small Hospitals Represent the Highest-Growth Adoption Segment
| Hospital Size | Bed Count | Revenue Share % | Key Adoption Driver |
|---|---|---|---|
| Large Hospitals & IDNs | 500+ beds | 51.4% | Enterprise platform ROI, multi-facility command centers, AI analytics investment capacity |
| Medium Hospitals | 100–499 beds | 32.8% | CMS compliance pressure, competitive patient experience benchmarking, population growth |
| Small & Critical Access Hospitals | <100 beds | 15.8% | Rural health funding programs, CMS ADT mandate, cloud SaaS cost accessibility |
Large hospitals and IDNs with 500+ beds drive 51.4% of total U.S. market revenue, reflecting enterprise procurement scale and the high operational complexity justifying advanced platform investment. Small and critical access hospitals are the fastest-growing adoption segment by percentage change. Cloud SaaS pricing at USD 1,800–USD 4,200 per month for sub-50-bed facilities has made entry-level digital bed management accessible to rural hospitals previously relying on paper-based workflows, accelerating first-time deployments across underserved rural markets.
U.S. Regional Analysis
Southeast Leads Growth; Northeast Anchors Revenue Share in Hospital Bed Management Software Market
| Region | Revenue Share % | Growth Rate (YoY) | Key Driver |
|---|---|---|---|
| Northeast | 31.4% | 9.8% | High academic medical center density; Epic and Oracle installed base concentration |
| Southeast | 24.7% | 16.2% | Fastest-growing region; hospital network expansion and rural digitization funding |
| Midwest | 21.3% | 10.4% | Large IDN consolidation activity; critical access hospital SaaS adoption surge |
| Southwest | 13.6% | 12.9% | Population growth driving new hospital construction and greenfield deployments |
| West Coast | 9.0% | 11.7% | Tech-forward health systems; early AI predictive analytics and RTLS adoption |
The Northeast holds a 31.4% revenue share, anchored by dense academic medical center clusters in Boston, New York, and Philadelphia driving enterprise-scale hospital bed management software contracts. The Southeast is the fastest-growing region at 16.2% annually, fueled by rapid hospital network expansion across Florida, Texas, and Georgia and HRSA rural digitization grants accelerating critical access hospital deployments. The Midwest is experiencing IDN consolidation-driven procurement, while the Southwest benefits from greenfield hospital construction creating first-time patient flow management software installations with no legacy infrastructure migration costs.
Key Growth Drivers of the U.S. Hospital Bed Management Software Market
EHR Interoperability Mandates, AI Adoption, Population Aging, and Value-Based Care Drive Structural Market Growth
CMS Interoperability and Patient Access mandates are the most powerful procurement accelerant in this market. The CMS Final Rule, fully enforced from 2024, requires all Medicare and Medicaid participating hospitals to transmit real-time ADT notifications via HL7 FHIR-compatible infrastructure. Non-compliant systems face reimbursement penalties under CMS Conditions of Participation. This regulatory demand floor sustains hospital bed management software and system procurement independent of discretionary IT budget cycles, generating consistent annual purchasing pressure across all hospital size segments and geographies through 2035.
Population aging is expanding bed management complexity. Adults 65+ will reach 73.1 million by 2030 — a 28.4% increase — driving 36% of hospital admissions with an average length of stay 2.3× longer than younger adults, amplifying patient flow management pressure across all acute care settings.
Value-based care incentives also drive software investment. CMS penalized 2,583 hospitals USD 521 million in FY2026 for excessive readmissions. Discharge management software reduces 30-day readmission rates by 9%–22%, delivering measurable CFO-level ROI justification.
Market Restraints
Legacy EHR Integration Complexity, Workforce Resistance, and Capital Constraints Limit Adoption Velocity
Legacy EHR integration complexity is the primary technical barrier. Over 48% of U.S. community hospitals operate EHR platforms installed before 2015 with limited HL7 FHIR API compatibility. Integrating modern bed management software with legacy Meditech or McKesson platforms requires custom middleware costing USD 180,000–USD 740,000 per facility, extending implementation timelines from an average of 6 months to 14–22 months. This complexity disproportionately impacts community hospitals that lack internal integration engineering resources.
Clinical workforce resistance remains persistent. 41% of bedside nurses reported resistance to new digital bed management workflows in 2025 ANA surveys. Hospitals investing in structured change management achieve adoption success rates of 88% versus 61% without it.
Capital constraints also modulate procurement timing. Approximately 28% of U.S. hospitals operated at negative operating margins in 2025, compressing discretionary IT investment capacity at safety-net hospitals — a significant portion of the addressable market.
Market Opportunities
AI Command Centers, Hospital-at-Home Integration, and Rural Health Digitization Unlock High-Growth Revenue Segments
AI-powered centralized capacity command centers represent the highest-revenue expansion opportunity through 2035. Health systems deploying enterprise-wide command centers report 15%–31% reductions in internal transfer time and USD 4.2–18.7 million in annual operational savings per health system, per published data from Johns Hopkins and Novant Health. The addressable U.S. market for IDN-scale command center platforms exceeds USD 380 million annually, with less than 22% penetration in 2026 — indicating substantial runway for market expansion.
Hospital-at-home expansion creates an adjacent market. CMS extended the Acute Hospital Care at Home waiver through 2027, with 290+ enrolled health systems. Virtual bed management integration represents upsell opportunities valued at USD 42,000–160,000 per health system annually.
Rural health digitization is underserved. HRSA Rural Health IT programs provide USD 1.2 billion annually for infrastructure grants. Critical access hospital SaaS adoption is projected to grow at 16.4% annually through 2030 as grant funding offsets capital barriers.
AI & Predictive Analytics Integration Framework for Hospital Bed Management
Machine Learning Forecasting, NLP Discharge Automation, and RTLS Integration Define Next-Generation Platform Architecture
Predictive census forecasting models trained on historical ADT patterns enable operations teams to anticipate bed demand with high accuracy. Epic’s AI Capacity Advisor, deployed across 185 U.S. health systems in 2026, generates 4- and 8-hour census forecasts at 87% unit-level accuracy. This enables charge nurses to initiate discharge preparation before clinical readiness — reducing post-discharge bed turnover by 34 minutes per bed per day and measurably cutting length of stay, two of the most critical patient flow management performance metrics for U.S. health systems.
NLP integration automates discharge barrier identification by extracting pending labs, specialist consultations, and authorization status from EHR documentation. Vendors report case manager productivity gains of 28%–44%, enabling the same staffing to manage 30%–45% higher discharge volumes.
Real-Time Location Systems (RTLS) integration enhances hospital bed management system accuracy by automating bed status updates without manual nurse documentation. Sensors in patient wristbands and doorway readers update occupancy status as patients move between care areas, eliminating the 15–45 minute documentation lag that historically degraded bed board reliability. Hospitals integrating RTLS report bed board accuracy improvements from 71% to 96%. The RTLS integration market represents a bundled revenue opportunity projected to reach USD 280 million by 2030 in the U.S. alone.
AI ethics requirements are entering procurement criteria. Following CMS AI guidance published in late 2025, health systems now require algorithmic bias audits and explainable model documentation — creating competitive differentiation for vendors with transparent AI architectures.
Vendor Selection & Total Cost of Ownership (TCO) Evaluation Framework
Integration Depth, Implementation Timeline, Clinical Workflow Fit, and Scalability Define Procurement Decision Criteria
Hospital CIOs evaluating bed management vendors apply a TCO framework extending beyond license pricing to include implementation, integration engineering, training, and upgrade cycles over a 5- to 10-year horizon. Enterprise platform TCO ranges from USD 1.8 million to USD 24 million over 7 years for large health systems. This financial scale makes procurement decisions comparable to major capital equipment purchases. Rigorous vendor evaluation reduces implementation failure rates — each failed implementation averages USD 340,000 in recovery costs in the U.S. market.
EHR integration depth is the leading technical criterion. Epic Capacity IQ and Oracle Capacity Management win preference within their respective EHR ecosystems by eliminating custom middleware costs entirely — a significant procurement advantage for health systems evaluating total implementation cost.
Implementation timelines vary significantly by deployment model. Cloud SaaS deployments for single acute care hospitals average 90–150 days from contract to live use. Multi-facility IDN deployments average 9–18 months. On-premises deployments extend to 12–24 months. Vendors offering phased roadmaps — activating foundational bed tracking within 60–90 days and layering predictive analytics in subsequent quarters — achieve higher implementation satisfaction scores and lower contract termination rates than full-deployment-first vendors.
Post-implementation clinical validation is now standard. Procurement committees require 90-day pilot results measuring bed assignment cycle time, ED boarding duration, and LOS delta. Vendors with published peer-reviewed outcomes achieve sales cycles of 4.2 months versus 8.7 months without evidence.
Regulatory & Patient Safety Compliance Landscape for Hospital Bed Management Software
CMS Interoperability Rules, Joint Commission Standards, HIPAA Security, and State Privacy Laws Shape Platform Design
CMS Interoperability and Patient Access mandates are the most operationally significant regulatory driver in 2026. Under 42 CFR Part 431, all Medicare and Medicaid participating hospitals must transmit electronic ADT notifications to community providers within 24 hours of each patient admission, discharge, or transfer. Compliance requires HL7 FHIR R4-compatible infrastructure. Non-compliance exposes hospitals to CMS Conditions of Participation violations, with enforcement escalating from corrective action plans to potential Medicare enrollment termination for persistent non-compliant systems.
Joint Commission NPSG 01.01.01 requires dual patient identifiers at every bed assignment event. Since 2023, Joint Commission triennial surveys have actively reviewed electronic bed management configurations, making system compliance documentation a standard hospital IT procurement requirement.
HIPAA Security Rule compliance requires role-based access controls, AES-256 encryption for PHI in transit and at rest, comprehensive audit logging with user-level attribution, and executed Business Associate Agreements with all hospital customers. SOC 2 Type II and HITRUST CSF Certification are increasingly required by hospital security review committees. Vendors achieving HITRUST certification win enterprise contracts at significantly higher rates than non-certified competitors, as the certification satisfies multiple hospital audit requirements simultaneously, reducing procurement committee due diligence burden.
State-level regulations add complexity beyond federal HIPAA. As of 2026, 14 states have enacted health data privacy laws with provisions beyond HIPAA — including California CPRA and Texas Medical Records Privacy Act — requiring vendor compliance program frameworks for national contract retention.
Latest Trends in the U.S. Hospital Bed Management Software Market
AI Capacity Command Centers, Remote Monitoring Integration, and Vendor Consolidation Reshape Platform Economics in 2026
AI-powered capacity command centers are redefining competitive positioning. Epic’s November 2025 AI Capacity Advisor launch triggered accelerated roadmap announcements from Oracle Health and TeleTracking within 90 days. Vendors without AI-native predictive analytics are losing enterprise RFPs to AI-enabled competitors, compressing legacy platform modernization timelines. Health systems evaluating platform replacements now list AI predictive analytics as a non-negotiable requirement — compared with only 28% of procurement committees applying this criterion in 2023, a shift reflecting rapid competitive maturity.
Vendor consolidation is accelerating. Private equity investment in healthcare IT operational platforms reached USD 3.8 billion in 2025, combining bed management, workforce management, and supply chain platforms into unified health system operating systems — delivering compounding operational improvements exceeding siloed platform capabilities.
Recent Developments: Epic, Oracle Health, and TeleTracking Lead 2025–2026
- March 2026: GE HealthCare and NXP Semiconductors integrated edge-based AI into acute care bed management, enabling on-device patient deterioration detection without cloud connectivity — addressing key security concerns at government hospital facilities.
- February 2026: Oracle Health launched automated bed allocation tools generating proactive placement recommendations for ED admission queues, reducing ED-to-floor transfer time by an average of 38 minutes in pilot deployments.
- January 2026: Epic expanded AI Capacity Advisor to all Epic-hosted cloud customers, delivering predictive census forecasting to 185+ U.S. health systems through existing Epic nursing operational workflows.
- November 2025: TeleTracking launched TransferCenter 3.0 with AI-enhanced referral acceptance decision support, reducing time-to-accept decisions for incoming transfer requests by 41% in beta testing across five IDN customers.
- September 2025: Qventus closed a USD 50 million Series D led by General Atlantic to expand its AI-native hospital operations platform across discharge automation, OR scheduling, and predictive census management.
Competitive Landscape
EHR-Integrated Platform Concentration and AI-Native Startup Growth Define the 2026 Competitive Dynamics
The U.S. competitive landscape is characterized by EHR vendor dominance at the enterprise level and specialized vendor competition in community and post-acute segments. Epic Systems and Oracle Health collectively serve 61% of U.S. hospital beds, giving them inherent distribution advantages for hospital bed management system and software module adoption. Standalone specialists including TeleTracking and LeanTaaS compete through superior clinical workflow depth and cross-EHR interoperability. AI-native vendors Qventus and Carevive are gaining enterprise market share rapidly, with combined contract growth exceeding 340% between 2023 and 2026.
Key vendors: Epic Systems (Capacity IQ, AI Advisor); Oracle Health (Cerner Capacity Mgmt); TeleTracking (TransferCenter 3.0); Qventus (AI-native operations); LeanTaaS (iQueue); Central Logic (Transfer Intelligence); MEDITECH; Nuvolo; Sonifi Health.
Key Market Segments
By Deployment Mode
- Cloud-Based (SaaS / Hosted Infrastructure)
- On-Premises (Local Server / Dedicated Infrastructure)
- Hybrid (Cloud + On-Premises Integration Architecture)
By End User
- Acute Care / General Hospitals
- Integrated Delivery Networks (10+ Facilities)
- Long-Term Care & Post-Acute Facilities
- Critical Access Hospitals (<25 Beds)
- Ambulatory Surgical Centers
By Bed Type
- Acute Care / Medical-Surgical Beds
- Critical Care / ICU / NICU / PICU Beds
- Rehabilitation & Step-Down Beds
- Long-Term & Skilled Nursing Beds
- Behavioral Health / Psychiatric Beds
By Solution Type
- Real-Time Bed Tracking & Digital Status Boards
- Discharge & Care Transition Management
- AI-Powered Predictive Capacity Analytics
- ADT Integration & EHR Interoperability Modules
- Centralized Capacity Command Center Platforms
By Hospital Size
- Large Hospitals & IDNs (500+ Beds)
- Medium Hospitals (100–499 Beds)
- Small & Critical Access Hospitals (<100 Beds)
Report Features
| Feature | Description |
|---|---|
| Market Value (2026) | USD 1.60 billion (U.S. market) |
| Forecast Revenue (2035) | USD 3.62 billion (U.S. market) |
| CAGR (2026–2035) | 9.50% |
| Base Year for Estimation | 2026 |
| Historic Period | 2020–2025 |
| Forecast Period | 2026–2035 |
| Report Coverage | Revenue Forecast, Deployment Mode Economics, End-User Segment Deep Dive, Bed Type Configuration, Solution Type Growth, AI Integration Framework, Vendor TCO Evaluation, Regulatory Compliance, Competitive Intelligence |
| Segments Covered | By Deployment Mode, By End User, By Bed Type, By Solution Type, By Hospital Size |
| Regional Analysis | Northeast, Southeast, Midwest, Southwest, West — state-level hospital density data |
| Dominant Deployment Mode | Cloud-Based with 59.3% revenue share |
| Dominant End-User Segment | Acute Care Hospitals with 44.6% share |
| Competitive Landscape | Epic Systems, Oracle Health, TeleTracking, Qventus, LeanTaaS, Sonifi Health, Central Logic, MEDITECH, Nuvolo, Carevive |