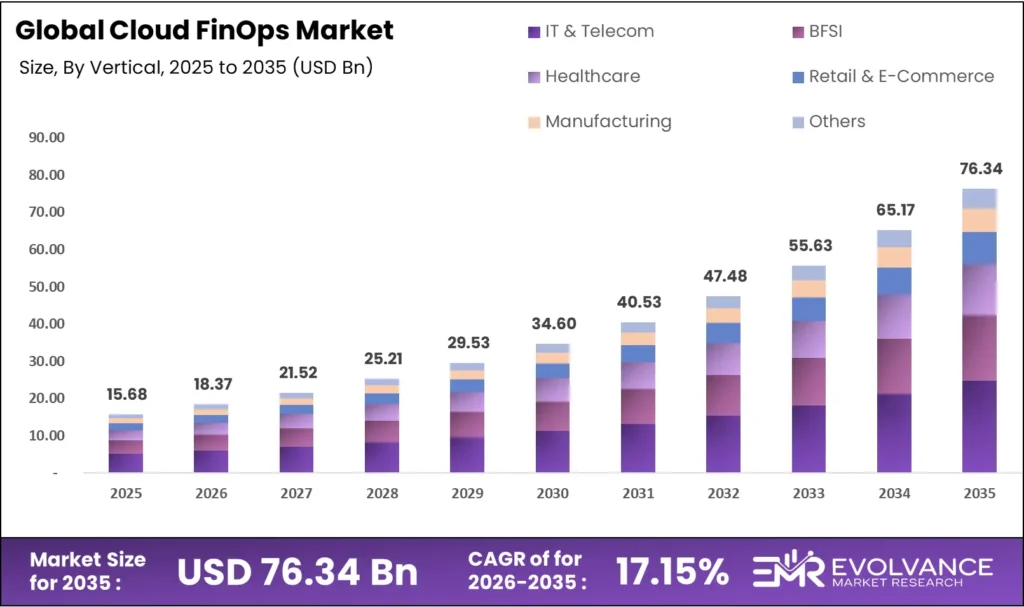
Cloud FinOps Market: USD 15.68B to USD 76.34B by 2035
The global Cloud FinOps market will reach USD 76.34 billion by 2035 from USD 15.68 billion in 2025, growing at a CAGR of 17.15% during the forecast period 2026 to 2035. Accelerating multi-cloud sprawl, mounting pressure on engineering and finance teams to jointly govern cloud spend, and the maturation of AI-driven cost anomaly detection tools are the structural forces driving this expansion. Organizations that once accepted uncontrolled cloud cost growth as a byproduct of digital transformation are now instituting dedicated FinOps practices, tooling, and cross-functional teams as board-level financial governance mandates.
Enterprise cloud spending reached an estimated USD 670 billion globally in 2024, yet analyst surveys consistently report that 30–35% of that spend is wasted through idle resources, over-provisioned instances, and unused reserved capacity commitments. Cloud FinOps platforms address this waste through real-time cost visibility dashboards, automated rightsizing recommendations, commitment-based discount management, and chargeback/showback reporting that attributes spend to accountable business units.
The ROI case is among the clearest in enterprise software: organizations report average first-year savings of 20–30% on cloud infrastructure costs following structured FinOps platform deployment, creating procurement urgency that compresses evaluation cycles significantly compared to other enterprise software categories.
The Cloud FinOps Market is gaining momentum as organizations prioritize cost optimization and financial accountability in cloud environments. Increasing adoption of multi-cloud strategies is driving demand for advanced financial management tools. This trend is closely associated with digital transformation across the Buy Now Pay Later (BNPL) and data-intensive applications in the High Content Screening (HCS). Furthermore, secure cloud operations are supported by advancements in the Internet Security and Security Analytics.
Cloud FinOps Market Highlights: Key Data at a Glance
- Market value: USD 15.68 billion in 2025, forecast to USD 76.34 billion by 2034 at 17.15% CAGR
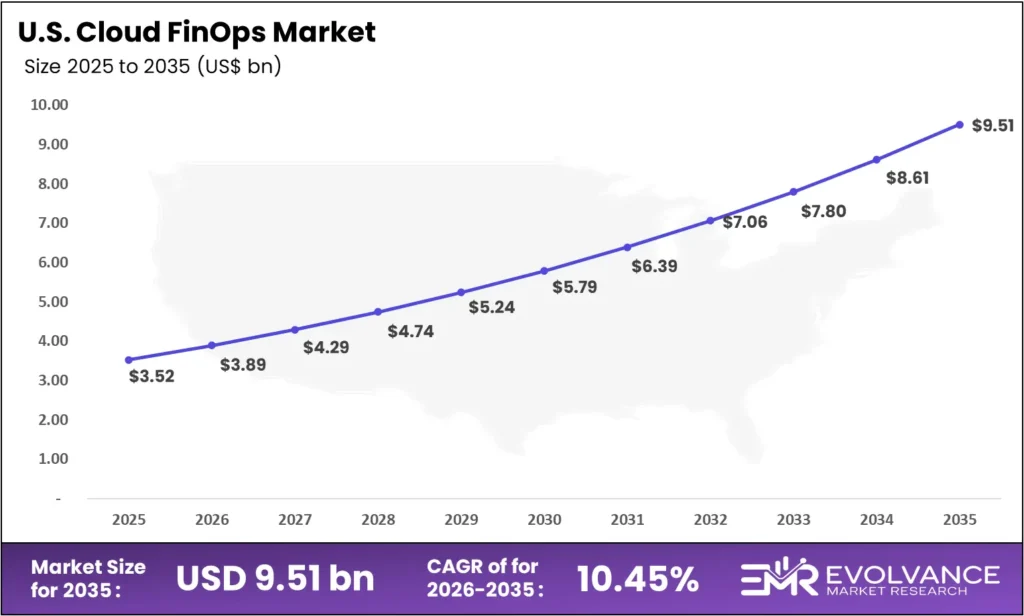
- US market: USD 3.52 billion in 2025, forecast to USD 9.51 billion by 2034 at 10.45% CAGR
- Dominant service type: Managed Services with 58.4% revenue share, driven by outsourced FinOps operations and platform-as-a-service delivery models
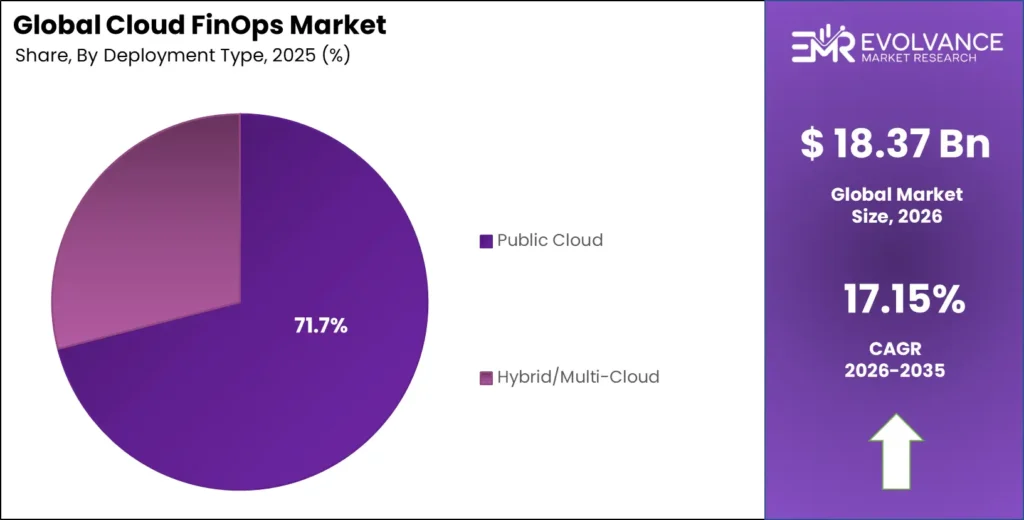
- Dominant deployment: Public Cloud with 71.7% share, anchoring consumption-based billing analytics and native hyperscaler API integration
- Dominant vertical: IT & Telecom with 34.8% revenue share, reflecting the highest cloud spend density and FinOps maturity among all industries
- Dominant tool type: Cost Optimization leads all tool investment categories with the highest procurement urgency across all organization sizes
- Dominant organization size: Large Enterprises lead with 63.1% revenue share, anchored by Fortune 500 multi-cloud environments requiring enterprise-grade governance
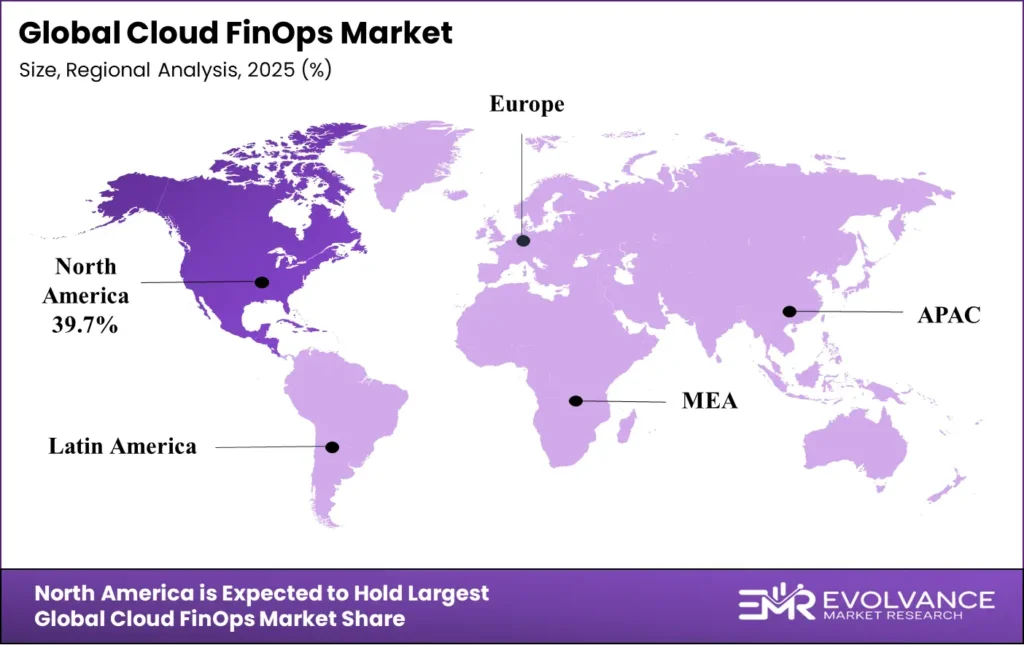
- North America: Largest regional share at 39.7%, valued at USD 0.41 billion in 2025
- Asia-Pacific: Fastest-growing region globally at 29.4% CAGR
US Cloud FinOps Market: USD 0.38B to USD 3.19B by 2034
The US Cloud FinOps market will reach USD 3.19 billion by 2034 from USD 0.38 billion in 2025, growing at a CAGR of 26.8%. The US market houses the highest concentration of cloud-native organizations globally. US enterprises are furthest along the FinOps maturity curve: Fortune 500 companies have moved from ad hoc cloud cost reviews to institutionalized FinOps Centers of Excellence, with the FinOps Foundation reporting over 12,000 certified professionals globally. This maturity is pulling tool investment toward AI-driven anomaly detection, automated commitment purchasing, and carbon cost attribution — driving higher contract values and expanding the addressable market per organization.
US regulatory context is increasingly shaping FinOps procurement. The SEC’s climate disclosure rules require public companies to report Scope 1, 2, and 3 emissions — creating direct demand for cloud carbon footprint tracking that leading FinOps platforms now embed alongside cost data. This regulatory linkage converts FinOps from a cost tool into a compliance infrastructure investment, expanding the buyer population beyond engineering and finance to include sustainability and legal functions.
Market Overview: Why Cloud FinOps Investment Is Structurally Accelerating
The Cloud FinOps market covers software platforms, managed services, and professional consulting that enable organizations to achieve financial accountability, cost visibility, and spend optimization across public cloud, hybrid cloud, and multi-cloud infrastructure environments. It excludes general IT financial management software not specifically designed for cloud environments, and on-premises data center cost management tools that do not incorporate cloud billing API integrations.
Cloud FinOps as a discipline formalizes the intersection of financial management, engineering operations, and business strategy around cloud infrastructure. The FinOps Foundation’s framework — now adopted by over 9,000 member organizations globally including Google, Spotify, Capital One, and Atlassian — defines three core phases: Inform (visibility and allocation), Optimize (rightsizing, commitment management, waste elimination), and Operate (continuous improvement and cultural embedding). Platforms in this market serve all three phases with varying degrees of automation and AI augmentation, and the most mature vendors now offer closed-loop automation that executes optimization actions without requiring manual engineering intervention.
Buyer behavior spans three procurement profiles. Large enterprises seek advanced FinOps capabilities through modular add-ons integrating with ServiceNow, Jira, and Terraform. Mid-market organizations managing USD 1–10M in annual cloud spend prefer consolidated platforms combining visibility, rightsizing, and commitment management in a single SaaS interface. SMEs entering structured cloud governance are the fastest-growing buyer cohort, pulled by freemium offerings from AWS Cost Explorer, Azure Cost Management, Harness Cloud Cost Management, and Infracost.
The growth of the Cloud FinOps Market is being significantly influenced by the rising need for cost optimization, governance, and secure cloud financial operations. As organizations increasingly migrate to cloud environments, the importance of Internet Security and advanced Security Analytics has become critical to ensure financial data integrity and prevent unauthorized access. Additionally, solutions like High Content Screening (HCS) are gaining traction for monitoring and managing large volumes of financial and operational data within cloud ecosystems. The emergence of Quantum-Safe Cybersecurity is further reshaping cloud FinOps strategies, as enterprises prepare to secure their financial workloads against future quantum computing threats.
Service Type Analysis
Managed Services Dominate with 58.4% Due to Outsourced FinOps Operations Demand
| Sub-segment | Share % | Primary Driver |
|---|---|---|
| Managed Services | 58.4% | Outsourced FinOps operations, platform-as-a-service, and recurring managed optimization |
| Professional Services | 41.6% | Advisory, implementation, training, and FinOps Center of Excellence buildout |
In 2025, Managed Services held a dominant position in the By Service Type segment with a 58.4% share. Organizations outsourcing cloud cost management benefit from on-demand access to FinOps expertise without sustaining a full-time internal team — a particularly compelling model for organizations spending USD 500K–5M annually on cloud infrastructure where the cost of a dedicated FinOps team exceeds the value of incremental optimization gains. Managed FinOps providers generate recurring revenue through percentage-of-savings or flat subscription models, creating predictable contract economics that support high NRR even as cloud spend fluctuates.
Professional Services address the organizational change dimension that software platforms alone cannot resolve. FinOps transformation engagements — covering tagging strategy, chargeback model implementation, and FinOps Center of Excellence establishment — are growing as organizations recognize that tooling without process change delivers incomplete cost reduction. Consulting firms including Accenture, Deloitte, and KPMG have each established dedicated cloud FinOps practices generating eight-figure annual revenue streams.
Deployment Model Analysis
Public Cloud Dominates with 71.7% Due to Native Billing API Integration and Hyperscaler Partnerships
| Sub-segment | Share % | Primary Driver |
|---|---|---|
| Public Cloud | 71.7% | Native AWS/Azure/GCP billing API integration and consumption-based analytics |
| Hybrid/Multi-Cloud | 28.3% | Unified cost visibility across cloud and on-premises for regulatory and architecture complexity |
In 2025, Public Cloud deployment held a dominant position with a 71.7% share. FinOps platforms built natively on public cloud billing APIs — AWS Cost and Usage Reports, Azure Cost Management APIs, Google Cloud Billing Export to BigQuery — achieve data ingestion latency and granularity that hybrid integrations cannot match. Hyperscaler marketplace listings further accelerate adoption: AWS Marketplace, Azure Marketplace, and Google Cloud Marketplace each host 30+ FinOps ISV solutions, enabling procurement through existing cloud spend commitments rather than separate vendor contracts.
Hybrid/Multi-Cloud deployments are growing as enterprise architecture complexity increases. Organizations managing workloads across AWS, Azure, GCP, and private cloud require unified cost views that no single hyperscaler’s native tooling can provide. Platforms including Apptio Cloudability, Flexera One, and CloudHealth command premium pricing in multi-cloud environments by eliminating the data normalization work engineering teams otherwise perform manually. The multi-cloud segment carries the highest average contract value and lowest churn rate in the FinOps market, as switching costs rise with each additional cloud environment under management.
Organization Size Analysis
Large Enterprises Dominate with 63.1% Due to Multi-Cloud Complexity and Governance Scale
| Sub-segment | Share % | Primary Driver |
|---|---|---|
| Large Enterprises | 63.1% | Fortune 500 multi-cloud environments, FinOps Center of Excellence investment, regulatory compliance |
| SMEs | 36.9% | SaaS adoption, freemium-to-paid conversion, and cloud cost maturity growth in mid-market |
Large Enterprises lead through procurement scale — organizations spending USD 50M+ annually on cloud sustain dedicated FinOps tooling budgets generating seven-figure platform contracts. The FinOps Foundation’s State of FinOps 2025 report found 78% of organizations spending over USD 10M annually have a formalized FinOps function, versus 34% of those spending under USD 1M. This adoption gap is narrowing as cloud costs grow among mid-market companies, but large enterprises retain structural dominance through contract volume and multi-year commitment sophistication.
The SME growth story is structurally compelling. Cloud-native SaaS FinOps platforms with consumption-based pricing are making enterprise-grade cost optimization accessible to organizations previously reliant solely on hyperscaler native tools. Harness Cloud Cost Management’s free tier and Infracost’s open-source IaC cost estimation tool have collectively driven over 3 million developer interactions, creating freemium-to-paid funnels that expand the buyer base beyond traditional enterprise procurement channels.
Vertical Analysis
IT & Telecom Dominates with 34.8% Due to Cloud Spend Density and FinOps Maturity
| Sub-segment | Share % | Primary Driver |
|---|---|---|
| IT & Telecom | 34.8% | Highest cloud spend density and advanced FinOps tooling maturity |
| BFSI | 22.1% | Regulatory compliance requirements and multi-cloud governance mandates |
| Healthcare | 13.5% | HIPAA-compliant cloud migration and cost governance for sensitive workloads |
| Retail & E-Commerce | 11.8% | Seasonal workload scaling, demand forecasting, and cost containment |
| Manufacturing | 10.3% | IoT and edge cloud cost management for Industry 4.0 deployments |
| Others | 7.5% | Government, education, and media adopting cloud FinOps frameworks |
In 2025, IT & Telecom held a dominant position in the By Vertical segment with a 34.8% share. Software companies, SaaS vendors, and technology infrastructure providers represent the most cloud-intensive organizations globally — cloud infrastructure commonly constitutes 20–40% of total COGS for SaaS businesses, making FinOps optimization a direct gross margin lever rather than a discretionary efficiency initiative. Engineering-led organizations also hold the technical capability to implement advanced FinOps automation, including Kubernetes cost allocation, spot instance orchestration, and infrastructure-as-code cost policies that manual FinOps processes cannot achieve at development velocity.
BFSI represents the highest-compliance FinOps buyer segment. Financial services organizations subject to Basel III capital requirements, DORA operational resilience mandates in the EU, and OCC cloud risk management guidance in the US require FinOps platforms with audit-grade cost attribution, data residency controls, and GRC framework integration. These requirements command premium contract values and drive preference for established vendors with financial services certifications, reference customers, and dedicated compliance engineering support.
Retail and E-Commerce FinOps investment is shaped by seasonality. Peak shopping events — Black Friday, Cyber Monday, Prime Day — generate cloud spend spikes of 300–800% above baseline that require pre-event commitment optimization and real-time anomaly alerts. FinOps platforms with predictive autoscaling recommendations, event-triggered commitment purchasing, and cost-per-transaction attribution capture premium contract values as retailers quantify cloud cost mismanagement’s direct revenue impact during critical sales periods.
Tool Type Analysis
Cost Optimization Dominates Due to Immediate ROI Visibility and Procurement Urgency
| Sub-segment | Share % | Primary Driver |
|---|---|---|
| Cost Optimization | Dominant | Reserved instance management, rightsizing, spot orchestration, and waste elimination |
| Governance & Compliance | — | Tagging policy enforcement, budget alerts, and cloud spending guardrails |
| Reporting & Analytics | — | Chargeback/showback, unit economics, and executive spend dashboards |
| Automation & Orchestration | — | Infrastructure-as-code cost policies, auto-remediation, and CI/CD cost gates |
Cost Optimization tools lead all tool investment categories due to unmatched ROI immediacy. Organizations can typically demonstrate first-dollar savings within 30–60 days of deploying rightsizing recommendations and reserved instance optimization — a payback period that no other enterprise software category reliably achieves. AWS estimates that organizations leveraging Reserved Instances and Savings Plans optimally save 30–72% versus on-demand pricing; FinOps platforms automate the analysis and purchasing workflows that make these commitments operationally sustainable at scale without manual finance team intervention.
Automation & Orchestration is the fastest-growing tool category. Integrating FinOps policies into CI/CD pipelines — generating infrastructure cost estimates at pull request stage before deployment — prevents cost-inefficient configurations from reaching production. Infracost, CAST AI, and Harness are investing in pre-deployment cost governance tools that shift FinOps from reactive post-deployment analysis to proactive development workflow integration, capturing developer tool budget lines that traditional FinOps procurement channels did not previously reach.
Key Market Segments
By Service Type
- Managed Services
- Professional Services
By Deployment Model
- Public Cloud
- Hybrid/Multi-Cloud
By Organization Size
- Large Enterprises
- SMEs
By Vertical
- IT & Telecom
- BFSI
- Healthcare
- Retail & E-Commerce
- Manufacturing
- Others
By Tool Type
- Cost Optimization
- Governance & Compliance
- Reporting & Analytics
- Automation & Orchestration
Regional Analysis of Cloud FinOps Market
North America Leads at 39.7% Share
| Region | Market Value (2025) | Share % | CAGR |
|---|---|---|---|
| North America | USD 0.41 billion | 39.7% | 26.8% |
| Asia-Pacific | USD 0.23 billion | 22.1% | 29.4% (fastest) |
| Europe | USD 0.25 billion | 24.3% | 25.6% |
| Latin America | USD 0.09 billion | 8.6% | 23.8% |
| Middle East & Africa | USD 0.05 billion | 5.3% | 22.4% |
North America holds 39.7% of global Cloud FinOps revenue at USD 0.41 billion in 2025 — the largest region by absolute value. Its structural advantage lies in the highest concentration of cloud-native SaaS companies, the most mature FinOps practitioner ecosystem anchored by FinOps Foundation certification programs, and the earliest enterprise cloud adoption generating the longest track record of optimization ROI data. The SEC’s climate disclosure requirements are expanding FinOps platform procurement beyond finance and engineering to include sustainability reporting functions, broadening the buyer base within organizations already deploying cost management tooling.
Europe Cloud FinOps Market Trends
Europe’s Cloud FinOps market reached an estimated USD 0.25 billion in 2025, driven by enterprise multi-cloud adoption across Germany, the UK, France, and the Netherlands. GDPR data sovereignty requirements sustain substantial on-premises and private cloud infrastructure that European FinOps platforms must incorporate alongside public cloud into unified cost views. The EU’s Digital Operational Resilience Act (DORA), effective January 2025, mandates cloud concentration risk assessment and cost attribution by IT asset for financial services firms — creating compliance-driven FinOps procurement in the banking and insurance sectors that did not previously exist.
Asia-Pacific Cloud FinOps Market: Fastest-Growing Region Globally
Asia-Pacific’s 29.4% CAGR makes it the fastest-growing major region for Cloud FinOps. India’s cloud market is accelerating as Tier-1 IT services firms — Infosys, TCS, Wipro, HCL Technologies — deploy FinOps capabilities both for internal estate management and as a billable service within managed cloud offerings. Japan’s enterprise cloud migration, driven by the Digital Agency’s government cloud mandate, creates structured FinOps procurement across public and private sectors. Australia’s financial services and telecommunications sectors lead APAC adoption with cloud spend levels that closely parallel North American procurement patterns.
Middle East & Africa Cloud FinOps Market Trends
The Middle East and Africa region is underpenetrated but structurally promising for Cloud FinOps platforms. Saudi Arabia’s Vision 2030 digital infrastructure mandate has accelerated cloud adoption across government and financial services, with AWS, Microsoft Azure, and Google Cloud all operating local availability zones in the Kingdom since 2023 — creating the cloud spend baseline from which FinOps demand emerges. UAE’s Smart City initiatives and the Gulf’s financial hub status are generating BFSI cloud migrations with parallel FinOps governance requirements. Africa is in early-stage adoption led by South Africa, Egypt, and Nigeria, where hyperscaler infrastructure investment is creating the prerequisite cloud spend density for commercial FinOps platform viability.
Key Regions and Countries
North America
- US
- Canada
Europe
- Germany
- France
- The UK
- Netherlands
- Sweden
- Rest of Europe
Asia Pacific
- China
- Japan
- India
- Australia
- South Korea
- Rest of APAC
Latin America
- Brazil
- Mexico
- Rest of Latin America
Middle East & Africa
- GCC
- South Africa
- Rest of MEA
Cloud FinOps Value Chain Analysis
The Cloud FinOps value chain spans five interconnected layers, each contributing distinct economic value and carrying different competitive dynamics. Understanding the full chain is essential for investors evaluating platform differentiation and operators selecting vendor portfolios for multi-year FinOps transformation programs.
| Value Chain Layer | Key Participants & Economic Role |
|---|---|
| Cloud Infrastructure | AWS, Azure, GCP — generate billing data and native cost management APIs that FinOps platforms consume |
| Data Ingestion & Normalization | FinOps ISVs, data pipeline vendors — standardize multi-cloud billing formats for unified analytics |
| Cost Intelligence Platform | Apptio, CloudHealth, Harness, Flexera — core optimization engine, AI recommendations, commitment management |
| Integration & Workflow | ServiceNow, Jira, Terraform — embed FinOps policies into ITSM, project management, and IaC workflows |
| Advisory & Enablement | Accenture, Deloitte, FinOps Foundation — organizational transformation, training, and CoE buildout |
The data ingestion and normalization layer holds the most significant competitive moat. Organizations with workloads across AWS, Azure, and GCP receive cost data in three incompatible billing formats with different resource hierarchies and tagging schemas. FinOps platforms solving multi-cloud billing normalization programmatically capture higher switching costs and command premium pricing. Vendors who have built pre-built connectors for Kubernetes cost allocation, Snowflake consumption analytics, and SaaS spend management are extending this moat into adjacent cost domains beyond hyperscaler infrastructure billing.
Key Companies: Three Platforms Define the Core Competitive Landscape
Three platforms — Apptio (IBM), CloudHealth (Broadcom/VMware), and Harness Cloud Cost Management — dominate enterprise Cloud FinOps revenue through platform breadth, hyperscaler partnership depth, and enterprise customer reference base. This concentration creates high switching costs in large enterprise accounts but leaves AI-native cost optimization, Kubernetes-native FinOps, and developer-first cost governance segments meaningfully open for challengers with differentiated architectures.
| Company | Segment / Revenue Context |
|---|---|
| Apptio (IBM) | Market leader in enterprise FinOps; IBM acquisition 2023 expands into Watson AI-driven cost analytics |
| CloudHealth (Broadcom) | Broadcom acquisition of VMware includes CloudHealth; multi-cloud focus, 6,000+ enterprise customers |
| Harness Cloud Cost Mgmt | Developer-first FinOps; USD 425M Series D at USD 3.7B valuation; rapid mid-market growth |
| Flexera One | Hybrid IT asset + cloud FinOps for regulated industries; strong BFSI and government presence |
| CAST AI | Kubernetes cost optimization specialist; automated rightsizing for container workloads |
| Spot by NetApp | Spot instance automation and savings plans management; acquired by NetApp 2020 |
| Infracost | Open-source IaC cost estimation; 3M+ developer interactions; pre-deployment cost governance |
| AWS/Azure/GCP Native Tools | Included in cloud spend; foundational but limited in multi-cloud and advanced optimization scenarios |
IBM’s acquisition of Apptio in 2023 for USD 4.6 billion is the largest M&A event in Cloud FinOps history, signaling market maturation from startup-driven innovation to platform consolidation. IBM integrates Apptio’s Cloudability product with Watson AI cost anomaly detection and IBM’s Technology Lifecycle Services consulting, creating a vertically integrated FinOps offering competing with both specialist ISVs and hyperscaler native tools. For enterprise buyers, this reduces vendor fragmentation but raises concentration risk that specialist FinOps ISVs actively exploit in competitive evaluations.
CAST AI represents the most compelling emerging category — Kubernetes-native FinOps automation. As containerized workloads represent an increasing share of cloud spend (Datadog’s State of Cloud Costs 2025 estimates 35% of EC2 spend now runs in containers), traditional VM-level rightsizing recommendations become structurally insufficient. CAST AI’s automated pod rightsizing, node autoscaling, and spot instance bin-packing algorithms operate at the container orchestration layer that legacy FinOps platforms were not architecturally designed to address. This Kubernetes-native positioning creates a white-space opportunity that the largest incumbent platforms cannot easily close through configuration rather than fundamental platform re-architecture.
Top Key Players
- Apptio, Inc. (IBM)
- CloudHealth Technologies (Broadcom / VMware)
- Harness, Inc.
- Flexera Software LLC
- CAST AI
- Spot by NetApp
- Infracost
- Densify (Densify Inc.)
- CloudCheckr (Spot by NetApp)
- ProsperOps
- Zesty
- Turbot (Steampipe)
- Other Major Players
Key Growth Drivers of the Cloud FinOps Market
Multi-Cloud Sprawl and Engineering-Finance Accountability Mandates Drive Structural Platform Demand
Multi-cloud adoption is the single most powerful structural force in the Cloud FinOps market. Flexera’s State of the Cloud 2025 Report found that 89% of enterprises operate multi-cloud environments, averaging 2.6 public and 2.7 private clouds simultaneously. This fragmentation creates billing complexity that native hyperscaler tools cannot resolve: cost data exists in isolated silos with incompatible resource taxonomies, pricing models, and commitment discount structures that prevent unified spend governance without third-party normalization platforms.
The engineering-finance accountability mandate is institutionalizing FinOps beyond individual cost optimization projects into sustained organizational capability investment. CFOs and CTOs are jointly establishing unit economics metrics — cost-per-customer, cost-per-API-call, cloud gross margin — that require FinOps platforms attributing spend to business outcomes rather than simply to AWS service line items. This executive mandate converts FinOps from an engineering efficiency tool into a board-level financial governance investment, expanding procurement authority beyond IT operations teams to include finance, product, and executive leadership.
AI-driven cost anomaly detection is the highest-urgency near-term capability expansion across buyer segments. Cloud spend can increase 10x within hours due to misconfigured autoscaling, runaway ETL jobs, or unexpected data transfer charges — creating financial exposure that weekly cost reviews cannot contain. FinOps platforms embedding real-time anomaly detection with sub-15-minute alert latency are capturing procurement urgency that traditional cost reporting tools with daily data refresh cycles cannot address. Gartner positions AI-driven cloud cost anomaly detection as a Top 10 emerging technology capability for infrastructure and operations through 2027.
Restraints
Organizational Culture Barriers and Tagging Debt Compress FinOps Platform ROI Realization
Organizational culture is the primary deployment barrier for Cloud FinOps adoption. Engineering teams optimized for delivery velocity resist FinOps practices perceived as constraining autonomy or adding approval overhead. FinOps Foundation surveys consistently identify ‘getting engineers to act on FinOps recommendations’ as the top practitioner challenge — more frequently cited than any tooling or data quality limitation. Deployments generating accurate cost recommendations but failing to change engineering behavior deliver materially less ROI than projected, creating adoption skepticism in organizations lacking executive-level FinOps sponsorship.
Cloud resource tagging debt is a technical constraint that compounds cultural barriers. FinOps cost allocation and chargeback reporting depend on consistent resource tagging — attaching metadata labels to cloud resources at provisioning time. Organizations with years of infrastructure deployed without systematic tagging policies face remediation projects extending 12–24 months before FinOps platforms can deliver business unit chargeback accuracy. Vendors offering automated tag remediation through AI-assisted policy enforcement are addressing this barrier, but the underlying technical debt requires engineering capacity investment that competes with product delivery priorities.
Opportunities
FinOps-as-a-Service and Carbon Cost Attribution Unlock Premium Revenue Segments
FinOps-as-a-Service for managed service providers is the highest near-term channel expansion opportunity. MSPs managing cloud infrastructure for 50–500 mid-market clients require multi-tenant FinOps platforms generating per-client cost optimization reports, consolidated margin analytics, and automated commitment purchasing. This white-label delivery model serves a channel that enterprise-focused incumbents were not designed to serve — creating a structural opening for purpose-built MSP FinOps platforms including CloudZero, Spot.io’s MSP Console, and Nops.
Carbon cost attribution is converting sustainability reporting into a core FinOps feature requirement. AWS Customer Carbon Footprint Tool, Azure Emissions Impact Dashboard, and Google Cloud Carbon Footprint each provide emissions data organizations now correlate with cost data for regulatory disclosure. FinOps platforms embedding carbon intensity metrics in unified dashboards — enabling carbon cost per workload and per business unit — are commanding 15–25% contract premiums over cost-only platforms as SEC climate disclosure, EU CSRD, and equivalent mandates expand globally.
Latest Trends in Cloud FinOps Market
AI-Autonomous Cost Governance and FinOps-as-Code Reshape Platform Economics
AI-autonomous cost governance — where FinOps platforms execute cost optimization actions without human approval — is the most transformative capability shift entering commercial deployment. CAST AI’s autonomous mode, automatically resizing Kubernetes pods and replacing on-demand instances with spot within configurable guardrails, has delivered documented average savings of 63% on Kubernetes compute costs. ProsperOps’ fully automated Reserved Instance and Savings Plans management achieves commitment coverage optimization without any engineering team involvement, applying the same autonomous paradigm to AWS-scale commitment management.
FinOps-as-Code embeds cost governance into infrastructure provisioning at source code level. Terraform cost policies via Infracost, Open Policy Agent cost rules via Checkov, and GitHub Actions cost estimation workflows let engineering teams see infrastructure cost impact before merging code — preventing misconfigurations from reaching production. This pre-deployment prevention shift compresses cloud waste rates while pulling FinOps procurement into developer platform budgets managed by engineering leadership.
Generative AI workload cost management is the newest and fastest-growing FinOps sub-category. LLM inference costs — measured in tokens per second across GPU-accelerated instances — do not fit standard VM rightsizing models and require purpose-built attribution frameworks correlating AI inference volume with cost and business outcome. As enterprise AI spending grows from USD 91 billion in 2024 toward USD 632 billion by 2028 (IDC), FinOps platforms developing AI cost management capabilities first will capture this high-growth category before incumbents can adapt VM-centric cost models to GPU-based workload economics.
Recent Developments: Key Moves in 2025–2026
- February 2026 — Harness launched AI Cost Intelligence, an LLM inference cost management module tracking GPU utilization, token costs, and model performance trade-offs for enterprise AI teams deploying models on AWS, Azure, and GCP.
- January 2026 — IBM Apptio released FinOps for GenAI, extending Cloudability’s cost attribution engine to cover Amazon Bedrock, Azure OpenAI Service, and Google Vertex AI workloads with token-level cost allocation.
- December 2025 — FinOps Foundation launched the FinOps Open Cost and Usage Specification (FOCUS) 1.1 standard, with adoption commitments from AWS, Azure, GCP, Oracle Cloud, and 12 major FinOps ISVs to normalize multi-cloud billing data formats.
- October 2025 — CAST AI announced Series C funding of USD 108 million at a USD 1.1 billion valuation, targeting expansion of Kubernetes cost automation into Azure AKS and GKE environments beyond its initial AWS EKS focus.
- September 2025 — Flexera released One Platform 2025 update incorporating AI-powered software asset management with cloud FinOps in a unified ITAM+FinOps platform targeting hybrid IT governance for regulated industries.
- August 2025 — ProsperOps expanded its autonomous AWS Savings Plans management service to Microsoft Azure Reserved Instances, becoming the first platform to offer fully automated commitment management across both major hyperscalers.
- July 2025 — Zesty raised USD 52 million Series B to accelerate development of its dynamic Reserved Instance automation technology, which continuously adjusts commitment portfolios in real time to match actual usage patterns rather than static annual forecasts.
Report Features
| Feature | Description |
|---|---|
| Market Value (2025) | USD 15.68 billion |
| Forecast Revenue (2034) | USD 76.34 billion |
| CAGR (2026–2034) | 17.15% |
| Base Year for Estimation | 2025 |
| Historic Period | 2020–2025 |
| Forecast Period | 2026–2035 |
| Report Coverage | Revenue Forecast, Market Dynamics, Competitive Landscape, Recent Developments |
| Segments Covered | By Service Type, By Deployment Model, By Organization Size, By Vertical, By Tool Type |
| Regional Analysis | North America, Europe, Asia-Pacific, Latin America, Middle East and Africa |
| Dominant Segment | Managed Services 58.4%; IT & Telecom 34.8%; Cost Optimization (tool type) |
| Dominant Region | North America 39.7%; Asia-Pacific fastest-growing at 29.4% CAGR |
| Regulatory Framework | GDPR, DORA, SEC Climate Disclosure, HIPAA Cloud Guidance, FinOps Foundation FOCUS Standard |
| Competitive Landscape | Apptio (IBM), CloudHealth (Broadcom), Harness, Flexera, CAST AI, Spot by NetApp, Infracost, ProsperOps, Zesty, CloudCheckr, Densify, Turbot |
Cloud FinOps Maturity Model: Crawl, Walk, Run
The FinOps Foundation defines Cloud Financial Operations maturity across three phases — Crawl, Walk, and Run — that describe progressively advanced capability deployment. Understanding where an organization sits on this maturity curve determines which platform capabilities they will purchase next. The FinOps Foundation’s State of FinOps 2025 report found that 41% of organizations globally remain at the Crawl stage, 38% at Walk, and 21% at Run — indicating substantial near-term market expansion as organizations advance through the curve.
| Maturity Phase | Capability Profile & Platform Requirement |
|---|---|
| Crawl | Basic cost visibility, tagging, showback reporting, cloud governance guardrails. Native hyperscaler tools sufficient for single-cloud. Buyer concern: understanding where cloud spend is going. |
| Walk | Multi-cloud normalization, chargeback activation, rightsizing, reserved instance optimization, unit economics dashboards. Third-party FinOps platforms required. Buyer concern: reducing waste and attributing costs accurately. |
| Run | Automated commitment purchasing, AI anomaly detection, FinOps-as-Code in CI/CD, Kubernetes-native automation, carbon attribution, closed-loop cloud governance. Advanced API-first platforms required. Buyer concern: autonomous optimization at development velocity. |
The Walk stage represents the highest volume procurement tier, generating the majority of recurring platform revenue. Run-stage organizations command the highest average contract values and lowest churn, as deep cloud governance automation integrations make switching economically prohibitive. Vendors spanning all three maturity phases capture full customer lifetime value as organizations progress through Cloud Financial Operations maturity over multi-year journeys.
Investment & Funding Landscape
VC and PE Capital Validates Cloud FinOps as a Standalone Enterprise Software Category
The Cloud FinOps investment landscape has received over USD 2.1 billion in disclosed venture capital and private equity funding since 2020, accelerating in 2023–2025 as enterprise cloud spend growth created measurable ROI data. The IBM acquisition of Apptio for USD 4.6 billion in 2023 established the category’s M&A benchmark. Subsequent rounds across CAST AI (USD 108M Series C), Zesty (USD 52M Series B), and Harness (USD 425M Series D at USD 3.7B valuation) confirm sustained institutional conviction through 2028.
| Company | Funding Event | Amount | Year | Signal |
|---|---|---|---|---|
| Apptio (IBM) | Acquisition | USD 4.6B | 2023 | Largest FinOps M&A; enterprise category validation |
| Harness | Series D | USD 425M at USD 3.7B valuation | 2022 | Developer-first FinOps at scale |
| CAST AI | Series C | USD 108M at USD 1.1B | Oct 2025 | Kubernetes FinOps automation breakout |
| Zesty | Series B | USD 52M | Jul 2025 | Dynamic commitment automation category |
| CloudZero | Series B | USD 32M | 2023 | MSP and unit economics FinOps positioning |
| Infracost | Seed | USD 7M | 2022 | Open-source IaC cost governance developer adoption |
Private equity interest is intensifying as the market transitions from growth to consolidation-stage acquisition activity. Thoma Bravo, Vista Equity Partners, and Francisco Partners represent the most likely acquirers for mid-market FinOps platforms reaching USD 30–100M ARR thresholds. The most defensible acquisition targets combine multi-cloud billing normalization moats with Kubernetes-native automation and MSP channel distribution — a combination no single mid-market platform fully delivers today, creating white-space consolidation opportunity through 2027.
Related Markets: 5 Segments Shaping the Cloud FinOps Ecosystem
Five adjacent markets intersect directly with Cloud Financial Operations, sharing the same upstream technology stack — cloud billing APIs, AI cost optimization frameworks, and infrastructure-as-code tooling — and many of the same enterprise procurement channels.
- Cloud Management Platforms (CMP) Market: Valued at USD 9.8 billion in 2025, growing at a CAGR of 18.4% through 2034. CMPs serve as the cloud governance infrastructure layer within which FinOps cost optimization tools operate, and organizations frequently bundle FinOps capabilities as a CMP procurement requirement.
- IT Financial Management (ITFM) Software Market: Valued at USD 4.2 billion in 2025, growing at a CAGR of 14.7% through 2034. The ITFM software market is converging with Cloud Financial Operations as cloud infrastructure displaces on-premises spend. Apptio’s Cloudability bridges ITFM and FinOps in a single platform — the most commercially successful category convergence example.
- Kubernetes Cost Management Market: Valued at USD 890 million in 2025, growing at a CAGR of 34.2% through 2034 — the fastest-growing adjacent segment. With CNCF’s Annual Survey 2025 reporting 84% of organizations running Kubernetes in production, container workload cost governance is the highest-velocity expansion opportunity in the FinOps ecosystem.
- Cloud Security Posture Management (CSPM) Market: Valued at USD 6.3 billion in 2025, growing at a CAGR of 21.8% through 2034. Platforms combining cost anomaly detection with security misconfiguration alerts are creating a unified cloud governance category spanning FinOps and CSPM, flagging both financial waste and security exposure from the same over-permissioned resource.
- AIOps Platforms Market: Valued at USD 3.1 billion in 2025, growing at a CAGR of 22.6% through 2034. As AIOps platforms consume growing GPU infrastructure budgets, FinOps cost allocation frameworks are being extended to attribute AI compute costs to specific ML experiments and model versions — creating a new unit economics capability that bridges Cloud Financial Operations and MLOps procurement.
Competitive Landscape: Porter’s Five Forces Analysis
The Cloud Financial Operations competitive landscape is shaped by five structural forces determining platform profitability, vendor differentiation sustainability, and market entry barriers.
| Force | Intensity | Key Dynamic |
|---|---|
| Threat of New Entrants | Medium — Multi-cloud normalization and Kubernetes automation require significant engineering investment limiting pure-play new entry; hyperscaler free tools set the baseline |
| Bargaining Power of Buyers | High — Multiple competing platforms, freemium entry points, and annual switching windows enable aggressive enterprise negotiation; large enterprises run competitive RFPs annually |
| Bargaining Power of Suppliers | Medium — AWS, Azure, GCP control billing API access and also compete directly with native cost management tools, creating simultaneous supplier and competitor dynamics |
| Threat of Substitutes | High — Hyperscaler native tools serve as zero-cost substitutes for single-cloud organizations; threat increases as hyperscalers invest in native FinOps capabilities |
| Competitive Rivalry | High — 50+ platforms compete across overlapping capability sets; M&A consolidation is accelerating but rivalry remains elevated through 2027 |
The most strategically significant force is hyperscaler substitution. AWS, Azure, and Google Cloud each have structural incentives to provide cost management at no charge — AWS Cost Explorer’s additions of anomaly detection, rightsizing, and Savings Plans coverage analysis have eroded the value proposition of entry-level third-party FinOps tools. The defensive moat for independent platforms lies exclusively in multi-cloud normalization, Kubernetes-native automation, and unit economics capabilities that hyperscaler tools cannot provide without disadvantaging their own platform adoption. Platforms excelling across real-time anomaly detection latency, Kubernetes pod-level cost attribution, autonomous commitment optimization, and MSP multi-tenant architecture command the highest NRR and the strongest pricing power in enterprise Cloud Financial Operations procurement.
Sources
-
- Flexera — 89% of enterprises operate multi-cloud environments; 84% cite managing cloud spend as top challenge; 27% of cloud spend wasted; 59% of organizations have a dedicated FinOps team; State of the Cloud Report 2025
- FinOps Foundation — State of FinOps 2025: 41% of organizations at Crawl stage, 38% Walk, 21% Run; 12,000+ certified FinOps professionals globally; ‘getting engineers to take action’ ranked top practitioner challenge
- FinOps Foundation — 9,000+ member organizations including Google, Spotify, Capital One, and Atlassian; FinOps Open Cost and Usage Specification (FOCUS) 1.1 standard launched December 2025 with AWS, Azure, GCP, and Oracle Cloud adoption commitments
- IBM Investor Relations — Acquisition of Apptio for USD 4.6 billion, 2023; largest M&A transaction in Cloud FinOps market history
- CAST AI — USD 108 million Series C funding at USD 1.1 billion valuation, October 2025; Kubernetes autonomous mode delivers average 63% savings on compute costs for early adopters
- Zesty — USD 52 million Series B funding, July 2025; dynamic Reserved Instance automation technology for real-time commitment portfolio adjustment
- Harness — USD 425 million Series D at USD 3.7 billion valuation; AI Cost Intelligence LLM inference cost management module launched February 2026 for AWS, Azure, and GCP
- IBM Apptio — FinOps for GenAI released January 2026; Cloudability cost attribution engine extended to Amazon Bedrock, Azure OpenAI Service, and Google Vertex AI with token-level cost allocation
- ProsperOps — Autonomous AWS Savings Plans management expanded to Microsoft Azure Reserved Instances, August 2025; first platform offering fully automated commitment management across both major hyperscalers
- Flexera — One Platform 2025 update released September 2025; AI-powered ITAM and cloud FinOps unified platform for hybrid IT governance in regulated industries
- Datadog — State of Cloud Costs 2025: 35% of EC2 spend now runs in containerized workloads, validating Kubernetes-native FinOps as a structural requirement
- CNCF (Cloud Native Computing Foundation) — Annual Survey 2025: 84% of organizations running Kubernetes in production, driving Kubernetes cost management market at CAGR of 34.2%
- S. Securities and Exchange Commission (SEC) — Climate-related disclosure rules requiring Scope 1, 2, and 3 emissions reporting; creating compliance-driven demand for cloud carbon footprint attribution in FinOps platforms
- European Banking Authority (EBA) — Digital Operational Resilience Act (DORA) entered into application 17 January 2025; mandates ICT risk management, cloud concentration risk assessment, and cost attribution by IT asset for all EU financial services firms
- AWS — Cost Explorer anomaly detection, rightsizing recommendations, and Savings Plans coverage analysis; organizations leveraging Reserved Instances and Savings Plans optimally save 30–72% versus on-demand pricing
- Microsoft Azure — Azure Cost Management APIs and Azure Emissions Impact Dashboard; Azure Operator Nexus platform for enterprise FinOps workloads
- Google Cloud — Cloud Billing Export to BigQuery; Google Cloud Carbon Footprint tool for emissions data correlated with cost data for regulatory disclosure
- CloudZero — USD 32 million Series B, 2023; unit economics and MSP-focused Cloud FinOps platform positioning
- Infracost — USD 7 million Seed round, 2022; open-source infrastructure-as-code cost estimation tool with 3 million+ developer interactions driving pre-deployment cloud cost governance
- Thoma Bravo / Vista Equity Partners / Francisco Partners — Enterprise software consolidation activity in cloud management and IT financial management adjacent categories, 2023–2025