What is the Integrated Pest Management Pheromones Market Size?
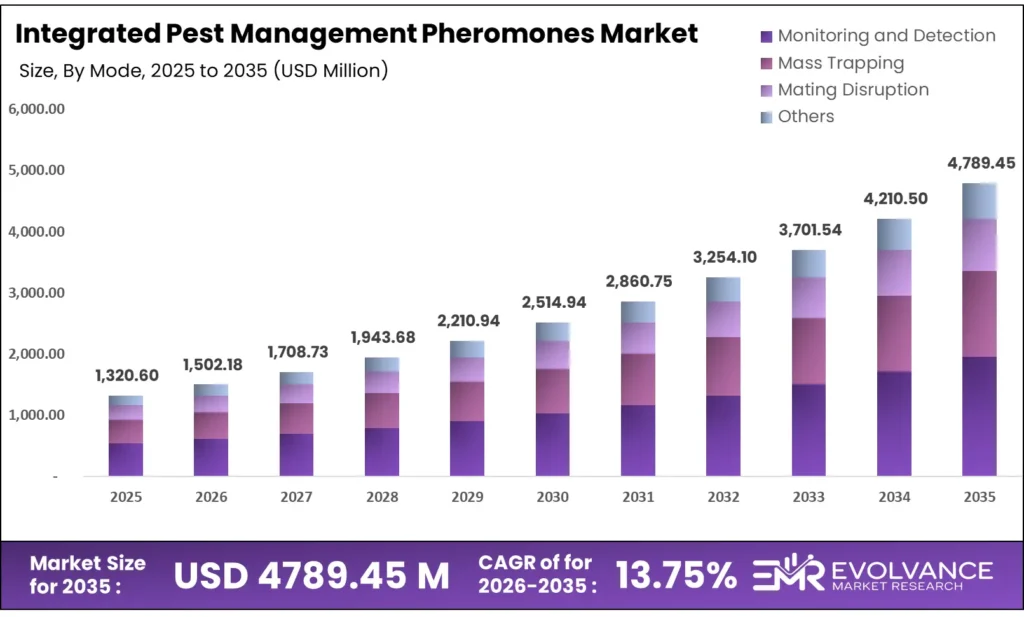
The Global Integrated Pest Management Pheromones Market size will be worth around USD 4789.45 Million by 2035 from USD 1320.60 Million in 2025, growing at a CAGR of 13.75% during the forecast period 2026 to 2035. The EU’s Farm to Fork target of a 50% cut in chemical pesticide use by 2030 is pushing buyers toward pheromone-based solutions at speed. Procurement is shifting away from broad-spectrum chemicals toward species-specific monitoring and mating disruption tools. High R&D and production costs remain a supply-side constraint, limiting the range of formulations available to small-scale buyers.
Market Highlights
- The Global Integrated Pest Management Pheromones Market will grow from USD 1320.60 Million in 2025 to USD 4789.45 Million by 2035, at a CAGR of 13.75%.
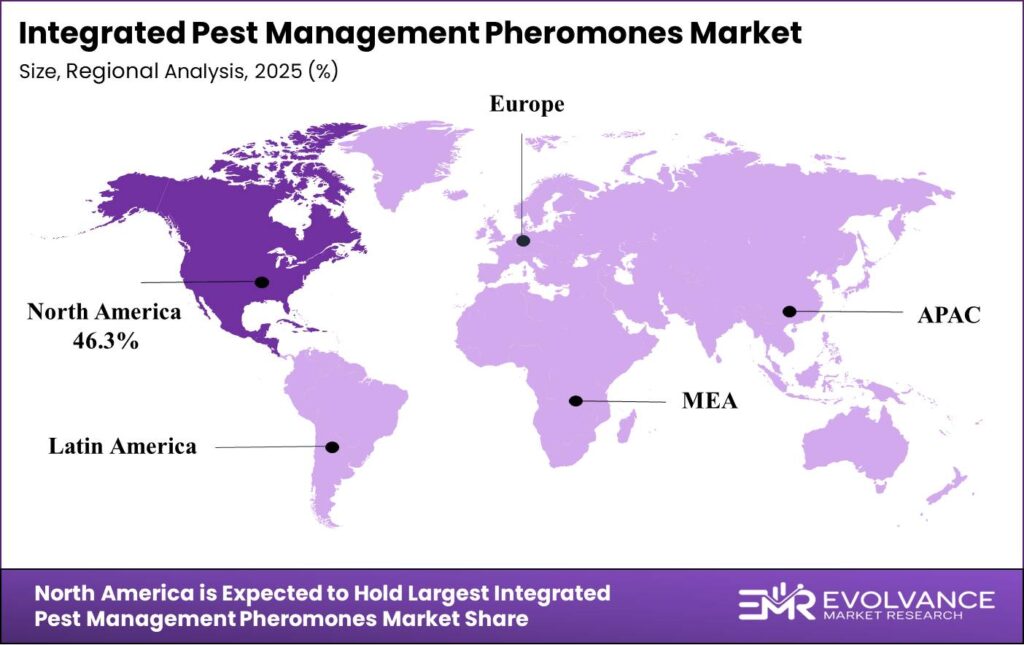
- North America leads with a 46.3% share, valued at USD 624.6 Million in 2025.
- By Mode, Monitoring and Detection dominates with 48.1% share.
- By Product, Sex Pheromones leads with 65.2%.
- By Application, Agriculture holds 47.3%.
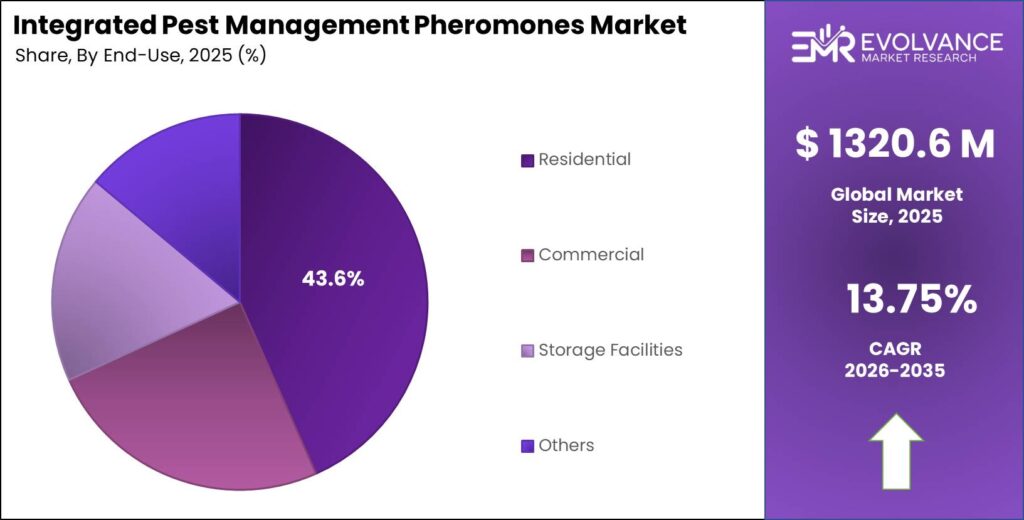
- By End User, Residential captures 43.6%.
Market Overview
The IPM pheromones market covers chemical signals used to monitor, trap, and disrupt pest behavior without broad-spectrum chemicals. These tools serve farms, orchards, forests, and storage facilities. Their core advantage lies in species-specificity — a pheromone lure for codling moth does not affect beneficial insects, giving buyers a precision tool that broad pesticides cannot match.
Pheromone products fall into four functional modes: monitoring traps, mass trapping systems, mating disruption dispensers, and other targeted applications. Buyers range from large commercial growers to government IPM programs. As organic certification and regulatory requirements tighten, pheromones are no longer optional — they are becoming a baseline requirement in compliant farming systems.
Government investment is a structural force driving adoption. The European Union mandates IPM implementation under Directive 2009/128/EC across 27 member countries, covering millions of hectares. The USDA National IPM Database has funded pest management programs since 1998, with project grants reaching up to USD 10,000. These are not short-cycle incentives — they represent multi-decade policy commitments that lock in demand.
According to the Food and Agriculture Organization, global crop losses from pests range between 10% and 25% annually. This scale of loss quantifies why governments fund IPM pheromone adoption — every percentage point of crop loss recovered through targeted pest management translates directly into national food security gains.
The EPA shows that biopesticides — including pheromones — account for approximately 5% of total US pesticide volume. With over 400 registered bio based chemical products on market, the EPA’s reduced-risk classification is compressing approval timelines, giving pheromone vendors a faster route to market than conventional chemistry competitors.
Mode Insights
Monitoring and Detection dominates with 48.1% due to low-cost entry and universal IPM compliance use.
In 2025, Monitoring and Detection held a dominant market position in the By Mode segment of the IPM Pheromones Market, with a 48.1% share. This mode acts as the entry point for IPM adoption — growers cannot trigger treatment thresholds without reliable trap count data. As per FAO guidelines, thresholds such as more than 5 codling moth catches per trap per week define when action is required, making monitoring tools indispensable before any other mode can function. Buyers who start with monitoring often expand to mating disruption, creating a sequential upgrade path for vendors.
Mass Trapping serves high-pressure pest scenarios where population suppression — not just monitoring — is the goal. This mode is most effective in isolated orchards and storage environments where pest reinfestation from adjacent zones is limited. It commands a premium price point and tends to attract commercial buyers operating intensive production systems.
Mating Disruption represents the most technically sophisticated mode and the strongest long-term growth vector. Research by the PHERA project demonstrated rice yield increases of up to 30% when mating disruption was combined with full IPM programs. Advancements in automated dispensing systems by companies such as Semios are improving delivery precision, lowering labor requirements, and making this mode accessible to mid-scale growers who previously could not justify the cost.
Product Insights
Sex Pheromones dominate with 65.2% due to broad crop applicability and proven field efficacy.
In 2025, Sex Pheromones held a dominant market position in the By Product segment of the IPM Pheromones Market, with a 65.2% share. Sex pheromones are the most commercially mature product type, with established lure formulations covering hundreds of insect species. Their dominance reflects decades of field validation across high-value crops. Findings from market trend data show sex pheromones holding a 42.3% share specifically in 2025 within the trend toward precision delivery, confirming their lead position is structural rather than transitional.
Alarm Pheromones trigger avoidance behavior in pest populations, making them useful in combination programs designed to push insects away from treated areas. Their application is more specialized than sex pheromones and is concentrated in crops where feeding damage rather than reproduction is the primary concern. Buyer awareness of this product type remains lower, creating both an education challenge and a white-space opportunity for vendors.
Aggregation Pheromones attract multiple individuals of a species to a single trap location, enabling mass trapping at scale. They are particularly effective for beetle pests in stored grain and forest management programs. The India Ministry of Agriculture’s rollout across more than 3.5 million hectares of IPM-covered land creates a large addressable base for aggregation pheromone products where grain storage pest control is a priority.
Others in the product category include trail pheromones and epideictic signals used in niche applications. Their current commercial volume is limited, but ongoing USDA and EU IPM programs exploring non-target safety and biodiversity benefits are building the evidence base that will support broader product registration in coming years.
Application Insights
Agriculture dominates with 47.3% due to scale of cultivated area and regulatory IPM mandates.
In 2025, Agriculture held a dominant market position in the By Application segment of the IPM Pheromones Market, with a 47.3% share. The sheer scale of global cultivated land — combined with the EU’s obligation on all professional pesticide users to apply IPM principles — creates a captive demand base. FAO data shows IPM Farmer Field Schools operating in over 90 countries, each one building grower familiarity with pheromone tools at the grassroots level. This institutional infrastructure accelerates adoption far beyond what commercial marketing alone could achieve.
Forestry applications focus on bark beetle and wood-boring insect management, where early detection through pheromone traps prevents large-scale timber loss. Forest IPM programs run on government funding cycles that make them less price-sensitive than commercial agriculture buyers. China’s zero-growth pesticide policy, in effect since 2015, has redirected government forestry programs toward biological alternatives, expanding the addressable market in Asia Pacific’s largest economy.
Horticulture is the premium segment, covering high-value crops such as grapes, apples, and stone fruits where chemical residue limits are strictest. Mating disruption in these crops delivers direct economic returns by protecting export quality grades. FAO data indicates pheromone-based mating disruption can cut insecticide applications by up to 90% in orchard crops — a reduction that lowers both input costs and residue-related rejection risk at export inspection.
End User Insights
Residential dominates with 43.6% due to growing awareness of chemical-free pest management.
In 2025, Residential held a dominant market position in the By End User segment of the IPM Pheromones Market, with a 43.6% share. This dominance reflects a buyer shift toward safer, non-toxic pest control at the household level, driven by health concerns and tighter urban pesticide regulations. Residential buyers primarily use monitoring traps for pantry moths, clothes moths, and stored-product pests — applications requiring no specialist knowledge and offering clear visible results.
Commercial end users include food processors, retailers, and hospitality operators where pest presence triggers regulatory action and reputational damage. This segment is the most value-sensitive on a per-unit basis, with buyers focused on documentation trails that support third-party food safety audits. Pheromone monitoring in commercial settings integrates directly into pest management recordkeeping systems, making switching costs high once a program is established.
Storage Facilities represent a specialized end-user category covering grain silos, warehouses, and cold-chain operations. OECD data shows total agricultural pesticide sales in OECD countries exceeding 3.5 million tonnes annually — a figure that underscores the substitution potential for pheromone-based systems in storage environments where fumigants currently dominate but face mounting resistance and regulatory restriction.
Others in end users include public agencies, research institutions, and pest control operators. These buyers often act as early adopters and technology validators. USDA funding under programs such as Agreement No. 2018-70006-28884 directly supports multi-regional pest management work through this professional channel, seeding commercial demand as validated protocols move from trial to standard practice.
Market Segments Covered in the Report
By Mode
- Monitoring and Detection
- Mass Trapping
- Mating Disruption
- Others
By Product
- Sex Pheromones
- Alarm Pheromones
- Aggregation Pheromones
- Others
By Application
- Agriculture
- Forestry
- Horticulture
- Others
By End User
- Residential
- Commercial
- Storage Facilities
- Others
Regional Insights
North America Dominates the IPM Pheromones Market with a Market Share of 46.3%, Valued at USD 624.6 Million
North America holds 46.3% of the global IPM pheromones market, valued at USD 624.6 Million in 2025. The EPA’s reduced-risk biopesticide classification and the USDA’s multi-decade IPM funding programs — operational since 1998 — have built procurement infrastructure that newer markets are only beginning to replicate. This regulatory and institutional maturity gives North American vendors a stable, policy-backed demand floor that insulates the market from commodity crop price volatility.
Europe IPM Pheromones Market Trends
Europe is the regulatory front-runner among all regions, with the Farm to Fork Strategy mandating a 50% cut in chemical pesticide use by 2030. Directive 2009/128/EC, active since 2014, already requires professional pesticide users across 27 countries to apply IPM principles. The January 2024 EU guidance on bio-based fermented pheromones has further compressed the regulatory pathway, creating faster market entry for producers with compliant formulations.
Asia Pacific IPM Pheromones Market Trends
Asia Pacific is the fastest-developing regional market, led by policy shifts in China and India. China’s zero-growth pesticide policy — in effect since 2015 — has redirected government agricultural programs toward biological alternatives. India’s 35 Central Integrated Pest Management Centres cover more than 3.5 million hectares of cropland, providing a funded distribution and training network that accelerates pheromone product adoption at national scale.
Latin America IPM Pheromones Market Trends
Latin America’s market is driven by export agriculture, where residue compliance with EU and US import standards forces growers to reduce chemical inputs. Brazil and Mexico — the region’s two largest agricultural economies — are both expanding organic certification areas. FAO-supported IPM Farmer Field Schools operating across the region are building grower literacy in pheromone tools, shifting buyer behavior from awareness to active procurement.
Middle East & Africa IPM Pheromones Market Trends
The Middle East and Africa region presents early-stage but structurally supported demand. FAO programs have implemented IPM Farmer Field Schools in over 90 countries globally, with African nations representing a significant share of that footprint. Food security pressures and climate-driven pest range expansion are pushing governments to fund biological pest control alternatives. Low baseline penetration means this region offers high percentage-growth potential for vendors willing to invest in distribution infrastructure.
Key Regions and Countries
North America
- US
- Canada
Europe
- Germany
- France
- The UK
- Spain
- Italy
- Rest of Europe
Asia Pacific
- China
- Japan
- South Korea
- India
- Australia
- Rest of APAC
Latin America
- Brazil
- Mexico
- Rest of Latin America
Middle East & Africa
- GCC
- South Africa
- Rest of MEA
Regulatory Landscape
The European Union’s Directive 2009/128/EC, enforced since 2014, requires all professional pesticide users across 27 member states to apply general IPM principles. This includes prioritizing biological controls such as pheromones over chemical alternatives. The directive covers millions of hectares of farmland, making it the single most consequential regulatory instrument for IPM pheromone demand globally.
The European Commission’s Farm to Fork Strategy, adopted in 2020, added a binding target: a 50% reduction in chemical pesticide use by 2030. This timeline creates a hard commercial deadline for growers and agribusinesses. Those who delay transitioning to pheromone-based IPM risk non-compliance at a point when alternative supply infrastructure may be under strain.
In the United States, the EPA classifies pheromones as biopesticides and applies a reduced-risk review pathway. This classification has allowed over 400 biochemical pesticide products to reach registration. Faster approvals lower the cost and time burden for market entrants, directly expanding the range of commercially available formulations.
In January 2024, the EU issued updated guidance on bio-based fermented pheromones, improving their regulatory recognition under existing frameworks. This development is particularly relevant for producers using fermentation-based synthesis — a lower-cost production method — as it removes a key barrier that previously slowed product registration in Europe’s high-value markets.
Drivers
EU Farm to Fork and EPA Reduced-Risk Rules Accelerate Pheromone Market Entry
The European Commission’s Farm to Fork Strategy targets a 50% cut in chemical pesticide use by 2030 across 27 EU countries. This is a policy-driven procurement shift — growers are not choosing pheromones on preference alone; they are choosing them to stay compliant. The scale of mandated change across European agriculture gives vendors a time-bound, government-enforced sales window that chemical alternatives simply do not face.
In the US, the EPA’s reduced-risk classification for pheromones cuts approval timelines and lowers regulatory costs for new product entrants. This has enabled the registration of over 400 biochemical pesticide products. Shorter approval cycles mean vendors can respond to pest resistance developments and new crop registrations faster — a structural speed advantage over full-chemistry competitors that require longer re-registration cycles.
Moreover, increased government subsidies for sustainable agrochemicals in both North America and Europe are directly lowering the financial risk of pheromone program adoption for growers. These subsidies shift the economics of adoption without requiring buyers to absorb full program costs upfront. For vendors, this means less price resistance at the point of sale and a more predictable demand cycle tied to annual subsidy windows.
Restraints
High R&D and Production Costs Limit Access for Small-Scale Buyers
Advanced pheromone formulations require significant research investment, synthesis expertise, and quality-controlled production facilities. These cost structures push unit prices above what many small-scale farmers in developing markets can absorb without subsidy. The result is a two-speed market: large commercial growers and government programs adopt rapidly while smallholders remain underserved despite representing the majority of global farm operations.
However, the accessibility gap is not purely a pricing problem — it is also a formulation problem. Products optimized for large-scale deployment in North American orchards may not suit the fragmented field sizes and varied pest pressures in South Asian or African farming systems. Adapting formulations to local conditions requires additional R&D spend, which further delays the point at which small-farm markets become commercially viable for vendors.
Additionally, the potential for pest populations to develop behavioral resistance to specific pheromone blends requires vendors to maintain active formulation development pipelines. Unlike conventional pesticides where resistance triggers a known chemical rotation, pheromone resistance demands a biological understanding of pest evolution that is costly and time-consuming to monitor. This creates an ongoing cost burden that keeps production economics challenging for smaller manufacturers.
Growth Factors
Mating Disruption Expansion and Organic Certification Demand Open New Revenue Streams
Mating disruption technologies are moving from premium specialty tools to mainstream IPM components. PHERA project field trials demonstrated rice yield increases of up to 30% when mating disruption was combined with full IPM programs. For rice growers — a crop feeding billions — this yield improvement translates into a compelling economic case that goes beyond compliance. Vendors who can document this ROI have a direct route into government-funded rice IPM programs across Asia.
The rise of USDA Organic and EU Organic certification is creating captive demand for pheromone products. Certified organic operations cannot use synthetic insecticides, making pheromone-based monitoring and mating disruption the only viable pest management tools for compliance. As organic acreage expands globally, each new certified hectare represents a buyer who has no alternative — a structurally protected revenue channel for pheromone vendors.
Furthermore, UAV and drone-based pheromone dispersal systems are seeking FAA Part 137 approvals for broader field coverage. This is not incremental improvement — it is a delivery format shift that could unlock large-scale field crop applications where ground-based dispensers are impractical. Companies positioned to supply drone-compatible pheromone formulations as approvals come through will access a market segment currently constrained by delivery logistics rather than product efficacy.
Emerging Trends
Precision Delivery Systems and Combination Biocontrol Programs Redefine Product Expectations
The shift from passive lure traps to active precision delivery — aerosol puffers and microcapsule systems led by companies such as Shin-Etsu and ISCA Technologies — is changing what buyers expect from pheromone programs. These systems dispense pheromone compounds at programmed intervals with documented release rates, giving growers and auditors verifiable data on program performance. This documentation capability is increasingly required for food safety certification and retail supply chain compliance.
FAO biological pest control data shows that pheromone-based methods can reduce environmental pesticide residues by up to 70% in monitored systems. This figure matters most to buyers under buyer-of-last-resort pressure: exporters selling into markets with maximum residue limits, and food brands managing liability under retailer sustainability commitments. The environmental residue argument is shifting from a marketing claim to a contractual requirement in high-value export supply chains.
Additionally, the growing use of pheromones in combination with beneficial microbes and bioinsecticides is creating a new product category: integrated biocontrol stacks. These combinations improve efficacy against resistant pest populations while reducing the risk of any single-mode resistance development. Vendors building stack-compatible formulations are positioning for a market where buyers purchase systems rather than individual products — a dynamic that raises average transaction value and deepens customer relationships.
Key Companies Insights
ATGC operates at the research-to-market interface of the IPM pheromones space, focusing on developing and commercializing pheromone-based crop protection tools. Their approach centers on proprietary formulation development, giving them a product differentiation advantage in markets where commodity lure products face heavy price competition. ATGC’s positioning in high-value crop applications — where performance justifies premium pricing — protects margin in a market that is broadening toward lower-margin commodity segments.
Russell IPM Ltd has built a broad commercial footprint across monitoring, trapping, and mating disruption product lines. Their strength lies in geographic reach and product breadth — they serve professional pest managers, research institutions, and commercial growers across multiple continents. This diversity reduces Russell’s exposure to single-market regulatory shifts. As EU and US policies tighten chemical use, Russell’s established distribution channels give them a first-mover advantage in converting conventional pesticide buyers to IPM-compliant programs.
Semios differentiates through technology integration, combining pheromone delivery hardware with digital monitoring platforms. Their automated dispensing systems address one of the key cost barriers in mating disruption adoption — labor-intensive manual trap checking. By connecting pheromone data to farm management software, Semios converts a standalone product into a subscription-linked service. This model creates recurring revenue and raises switching costs, insulating their position against low-cost product competitors entering the market.
Rovensa Next approaches the IPM pheromones market through its broader bioprotection portfolio, combining pheromone products with biostimulants and other biological crop inputs. This portfolio strategy allows Rovensa Next to position pheromone tools as components of a larger integrated program rather than standalone products. For growers under pressure to simplify procurement and reduce supplier complexity, a single vendor offering a full biological program has a clear commercial advantage over specialist pheromone-only suppliers.
Key Companies
- ATGC
- Russell IPM Ltd
- Semios
- Rovensa Next
- Syngenta
- AgriSense-BCS Ltd.
- Harmony Ecotech Pvt. Ltd
- Trécé, Inc.
- Shin-Etsu Chemical Co., Ltd.
- Bioline Agrosciences Ltd.
- Others
Recent Development
- In 2025 — The European Union issued updated guidance recognizing bio-based fermented pheromones under existing regulatory frameworks. This guidance cut the registration pathway for fermentation-derived products, lowering barriers to market entry for producers using lower-cost synthesis methods across EU member states.
- In 2025 — Semios continued expanding its automated pheromone dispensing platform, integrating precision delivery hardware with digital farm monitoring tools. Shin-Etsu Chemical advanced its aerosol puffer and microcapsule delivery formats for sex pheromone applications in high-value crops. These precision dispensers allow programmable release intervals, supporting compliance documentation for third-party IPM certification programs in grape and apple production.
- In 2025 — PHERA project trials confirmed rice yield increases of up to 30% when mating disruption pheromone technology was combined with full IPM programs. UAV and drone-based pheromone dispersal systems progressed toward FAA Part 137 approval filings for expanded commercial field coverage. Approval would unlock large-scale field crop applications — particularly in row crops — where ground-based systems are impractical and aerial delivery is the only viable deployment method.
Market Scope
| Report Features | Description |
|---|---|
| Market Value (2025) | USD 1,320.60 Million |
| Forecast Revenue (2035) | USD 4,789.45 Million |
| CAGR (2026-2035) | 13.75% |
| Base Year for Estimation | 2025 |
| Historic Period | 2020-2024 |
| Forecast Period | 2026-2035 |
| Report Coverage | Revenue Forecast, Market Dynamics, Competitive Landscape, Recent Developments |
| Segments Covered | By Mode (Monitoring and Detection, Mass Trapping, Mating Disruption, Others), By Product (Sex Pheromones, Alarm Pheromones, Aggregation Pheromones, Others), By Application (Agriculture, Forestry, Horticulture, Others), By End User (Residential, Commercial, Storage Facilities, Others) |
| Regional Analysis | North America (US and Canada), Europe (Germany, France, The UK, Spain, Italy, and Rest of Europe), Asia Pacific (China, Japan, South Korea, India, Australia, and Rest of APAC), Latin America (Brazil, Mexico, and Rest of Latin America), Middle East & Africa (GCC, South Africa, and Rest of MEA) |
| Competitive Landscape | ATGC, Russell IPM Ltd, Semios, Rovensa Next, Syngenta, AgriSense-BCS Ltd., Harmony Ecotech Pvt. Ltd, Trécé, Inc., Shin-Etsu Chemical Co., Ltd., Bioline Agrosciences Ltd., Others |
| Customization Scope | Customization for segments, region/country-level will be provided. Moreover, additional customization can be done based on the requirements. |
| Purchase Options | We have three licenses to opt for: Single User License, Multi-User License (Up to 5 Users), Corporate Use License (Unlimited User and Printable PDF) |
