US Direct Selling: $47.95B in 2025 to $90.01B by 2035
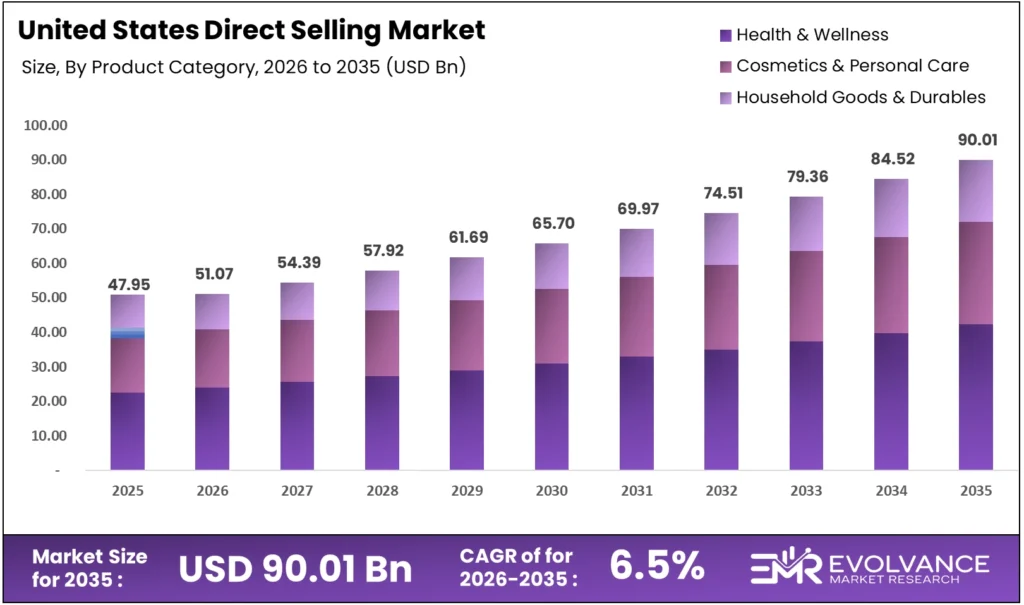
The United States direct selling market will be worth USD 90.01 billion by 2035, up from USD 47.95 billion in 2025. The channel grows at a CAGR of 6.5% from 2026 to 2035. Health and wellness product demand anchors this channel, with personalized purchasing experiences sustaining loyalty beyond traditional retail.
Independent seller networks across all 50 US states create distributed economic participation that generates local income in markets that platform-based retail does not serve. This geographic reach, combined with the channel’s personal relationship model, is a structural advantage the broader direct selling market built over decades.
United States Direct Selling Market Highlights
- The United States direct selling market is valued at USD 47.95 billion in 2025 and is forecast to reach USD 90.01 billion by 2035.
- The market is projected to grow at a CAGR of 6.5% during the forecast period 2026 to 2035.
- Health and wellness leads product segmentation with 35.3% of total US direct selling channel volume.
- Single-level marketing holds the dominant business model position at 51.4% share, ahead of multi-level marketing at 48.6%.
- North America, anchored by the United States, represents the most mature regional market within the global direct selling industry valued at USD 242.40 billion in 2025.
What Is the United States Direct Selling Market
The United States direct selling market covers the sale of consumer products and services through independent representatives outside fixed retail locations. These transactions span health and wellness, cosmetics, household goods, financial services, and real estate, conducted through personal demonstrations, social networks, and digital platforms.
This cluster analysis draws on company filings, Direct Selling Association annual studies, and Federal Trade Commission disclosures. Evolvance market research analysts mapped 10 major US direct selling companies across 4 segment groups. The forecast is grounded in DSA-verified 2024 actuals and corporate disclosures through early 2026.
The US direct selling channel differs structurally from its global counterpart. Services now exceed 60% of channel volume — a ratio that mirrors the broader US economy. Real estate, insurance, and financial services have entered the model through eXp Realty and Primerica, diversifying the channel beyond its traditional wellness and cosmetics base.
Buyer behavior in this sector divides into two groups. According to the Direct Selling Association, 34.3 million preferred customers in 2024 purchase at member prices without recruiting obligations. Active entrepreneurs — the 5.4 million direct sellers — treat the channel as supplemental or primary income, with annual retention rates between 15% and 20%.
US Direct Selling Market Forces and Dynamics
Entrepreneurial Access Sustains Channel Participation
Direct selling entrepreneurship opportunities persist because the channel offers low-barrier business ownership. As reported by the Direct Selling Association, 5.4 million active sellers contributed economic activity across all US states in 2024. The independent contractor pipeline of 12.2 million agreements shows intent far outpacing active execution.
Activation — converting signed contractors into active sellers — remains the core growth lever. The 126% gap between pipeline and active base signals that the channel’s structural reach is underutilized. Companies improving onboarding and digital training will disproportionately benefit from this latent participation pool.
Economic Headwinds Cut Active Seller and Buyer Counts
US direct selling retail sales declined to $34.7 billion in 2024 from $36.7 billion in 2023. According to growth-onomics, retail churn averaged 25.4% in 2024, with digital channels showing the highest erosion. This signals that digital-only direct selling models carry real retention risk without community support.
The long-term forecast to $90.01 billion by 2035 signals that this contraction is cyclical, not structural. The channel’s distributed economics and personal relationship model remain intact. Companies that maintained seller engagement through 2024 are better positioned to capture volume as consumer discretionary spending recovers.
Seller Decline of 12% Reflects Quality Filter, Not Exit
In our view, the 12% seller decline in 2024 is misread as a market shrinkage signal. Economic pressure raised the cost of recruiting uncommitted participants. Stricter FTC guidelines on income claims reduced misleading onboarding. The result is a smaller but better-qualified seller base.
The 12.2 million contract renewals in 2024 confirm that intent to participate remains well above active execution. A seller base filtered for commitment produces better retention outcomes. This dynamic makes the 2024 decline a long-term positive for channel quality, not a leading indicator of structural contraction.
Social Commerce Reshapes Customer Discovery and Acquisition
Social commerce now drives the majority of first-time purchases in US direct selling. Hybrid models combining affiliate structures, direct-to-consumer storefronts, and mobile platforms cut customer acquisition costs. Companies adopting these tools report faster scaling and improved retention in health and wellness, where product demonstration performs well in short-form video formats.
AI and Device Hardware Build Recurring Revenue Streams
AI and automation tools are reshaping distributor workflows in US direct selling. Nu Skin’s Prysm iO™ platform tracks carotenoid levels to measure antioxidant health, anchoring supplement sales to biometric data. According to Kertos, AI compliance tools delivered 170% ROI in 2024, cutting manual effort by 67%.
This cost advantage is material for direct selling companies investing in automated verification and personalization. The 67% reduction in manual compliance effort frees distributor bandwidth for sales activity. Companies deploying these tools in 2025 and 2026 will carry a structural cost advantage over those still using manual processes.
FTC Enforcement Raises Costs for Subscription-Based Models
Regulatory risk is a structural constraint for US direct selling companies using subscription-based wellness models. The Federal Trade Commission secured over $10 million in refunds in August 2024 from a credit repair pyramid scheme. This enforcement action is part of expanded FTC audits across the wellness direct selling space.
Companies with transparent income disclosures and product-first revenue models carry the lowest regulatory exposure. The $10 million refund action in August 2024 is a signal — not an isolated case. Subscription wellness models without clear product-value documentation face elevated audit probability and potential payout freezes.
US Direct Selling Market Segmentation by Product and Model
Health and Wellness Direct Selling Segment
| Sub-segment | Share % | Primary Driver |
|---|---|---|
| Health & Wellness | 35.3% | Supplement demand and aging demographics |
| Cosmetics & Personal Care | Second position | Women-led networks in the 35–44 age group |
| Household Goods & Durables | Third position | Home demonstration and subscription models |
Health and wellness dominates with 35.3% of US direct selling volume. Supplement and nutrition products align with personal demonstration and recurring purchase behavior. According to Matrix BCG, Amway’s Nutrilite holds 64% of total Amway sales, confirming that wellness products generate disproportionate repeat revenue within distributor networks.
Cosmetics and personal care holds the second position, anchored by Mary Kay’s estimated $2.4 billion in global 2024 revenue. As noted by Porters Five Force analysis, Mary Kay’s $2.4 billion 2024 revenue estimate reflects sustained B2B engagement with women’s networks. This sub-segment competes directly with social commerce beauty brands for the same 35–44 demographic.
Household goods and durables trail the top two categories. Tupperware’s financial restructuring shows this sub-segment’s vulnerability to e-commerce substitution. Melaleuca’s subscription-based model offers a more defensible recurring revenue structure, reducing single-transaction dependency and building more predictable seller income within the category.
Single-Level vs. Multi-Level Marketing in the US
| Business Model | Share % | Primary Driver |
|---|---|---|
| Single-Level Marketing (SLM) | 51.4% | Compliance clarity and regulatory simplicity |
| Multi-Level Marketing (MLM) | 48.6% | Network leverage and tiered compensation |
Single-level marketing holds 51.4% of the US market because FTC regulatory clarity makes SLM structures easier to operate compliantly. Insurance and financial services companies — including Primerica — use SLM frameworks. Services now exceed 60% of total US direct selling channel volume, pulling the model split toward single-level structures.
Multi-level marketing retains 48.6% share, driven by health and wellness companies with deep distributor hierarchies. Herbalife, Nu Skin, doTERRA, and Young Living operate MLM structures where network depth creates compounding recruitment incentives. According to Business For Home, distributor retention averaged 15–20% annually in 2024, confirming that turnover management is the central MLM operational challenge.
Key Market Segments
By Product Category
- Health & Wellness
- Cosmetics & Personal Care
- Household Goods & Durables
By Business Model
- Single-Level Marketing (SLM)
- Multi-Level Marketing (MLM)
By Participant Type
- Preferred Customers / Discount Buyers
- Active Direct Sellers / Entrepreneurs
By Demographics (Gender)
- Women
- Men
By Demographics (Age Groups)
- Ages 35–44
- Ages 45–54
- Ages 55–64
US Direct Selling Sales by State and Region
California, Texas, and Florida Lead US Direct Selling
California, Texas, and Florida anchor US direct selling retail sales, each generating over $1 billion annually. Combined population exceeds 75 million, with high independent contractor density and strong Hispanic and women-led seller communities. These three states represent an estimated 25–30% of total US channel volume in health, wellness, and cosmetics.
Southern and Sun Belt regions show above-average seller density, aligned with the 35–44 and 45–54 age groups dominating participant data. Midwest states including Michigan — home to Amway’s Ada, MI headquarters — contribute meaningful wholesale volumes to the national channel total.
As noted by MLive, Amway’s $7.4 billion in 2024 global sales marked its third consecutive year of decline. Currency pressures drove that contraction, not US market share erosion. This distinction matters for investors: Amway’s US distributor base and product demand remained stable while reported revenue fell on exchange rate translation.
Top Direct Selling Companies in the United States
The US direct selling landscape concentrates around companies with global distribution networks, proprietary product lines, and multi-decade brand equity. Amway, Herbalife, and doTERRA anchor the health and wellness tier. eXp Realty and Primerica lead the service model’s ascent. Legacy cosmetics brands face the sharpest pressure from social commerce competitors.
Amway leads the US and global market. Its newsroom confirmed $7.4 billion in 2024 global sales, down 3% from $7.7 billion in 2023 due to currency headwinds. Nutrilite represents 64% of total Amway revenue — a structural strength in health and wellness and an equal concentration risk.
Herbalife Nutrition sustains its position through distributor-focused nutrition clubs and an expanding digital line. As reported by Diet Business Watch, Herbalife’s 2024 results reflect continued distributor engagement despite macro headwinds. Cristiano Ronaldo’s $7.5 million investment in Pro2col™ technology in February 2026 signals a pivot toward AI-powered personalized health for distributor recruitment.
Nu Skin Enterprises recorded $1.73 billion in 2024 revenue, a 12% decline from $1.96 billion in 2023. The company then delivered over 50% earnings growth in full-year 2025. Its 2026 outlook forecasts revenue stabilization driven by the Prysm iO™ AI wellness platform and a return to channel growth by year-end.
doTERRA surpassed $2 billion in global sales in 2024, backed by over 3 million distributors worldwide. As documented by Direct Selling News, doTERRA’s 2024 revenue confirmed US digital tools rollout. This positions the brand as a hybrid selling benchmark in the essential oils and wellness sub-segment.
Mary Kay sustained an estimated $2.4 billion in global 2024 revenue through targeted engagement with women in the 35–44 demographic. eXp Realty applies the direct selling model to real estate agent recruitment without physical office overhead. That structural cost advantage over traditional brokerage competitors signals the channel’s service-sector scalability.
We believe the most underappreciated competitive shift in US direct selling is the split between two groups. Companies like Nu Skin and Herbalife are embedding AI and device hardware into their model. Those relying on social recruitment alone cannot match the defensible recurring revenue that hardware-software integration creates without material R&D investment.
Top Key Players
- Amway
- Herbalife Nutrition
- eXp Realty
- Primerica
- Mary Kay
- doTERRA
- Nu Skin Enterprises
- Melaleuca
- Young Living
- USANA
US Direct Selling Market Recent Developments
In February 2026, Herbalife announced Cristiano Ronaldo’s $7.5 million investment in Pro2col™ health technology, granting a 10% equity stake in HBL Pro2col Software, LLC. As reported by Herbalife investor relations, Ronaldo’s $7.5 million Pro2col stake elevates the platform’s profile and accelerates Herbalife’s push into AI-powered personalized wellness technology.
In February 2026, Nu Skin reported full-year 2025 results with over 50% earnings growth. As confirmed by Nu Skin Enterprises, Nu Skin’s 2025 earnings growth above 50% signals that its restructuring is producing measurable results. A 2026 revenue stabilization outlook accompanied the release, pointing to Prysm iO™ as the primary growth catalyst ahead of broader consumer rollout.
In February 2026, Nu Skin relaunched an updated edition of “The Aging Myth” by Dr. Joseph Chang, incorporating the latest science on measurable biology and longevity. As noted by Nu Skin Enterprises, Dr. Chang’s February 2026 book relaunch supports Nu Skin’s scientific credibility positioning as Prysm iO™ enters broader consumer distribution.
In December 2025, Nu Skin unveiled Prysm iO™, an AI-powered device measuring carotenoid levels as an antioxidant health proxy. As documented by Nu Skin Enterprises, Prysm iO’s December 2025 representative launch anchors recurring supplement sales to biometric data. This creates a technology-led retention model that ties distributor income to measurable consumer health outcomes.
In November 2025, Herbalife expanded its Liftoff® energy line with zero-sugar Cola and Ginger Beer flavors. As confirmed by Herbalife’s press room, the Liftoff zero-sugar expansion in November 2025 addresses sugar-reduction trends among the core 35–54 demographic. The new flavors broaden distributor retail variety and lower the barrier for health-conscious buyers new to Herbalife’s product ecosystem.
In August 2025, the Direct Selling Association released its 2025 Growth and Outlook Study. As published by the Direct Selling Association, $34.7 billion in 2024 US retail sales confirmed steady channel interest. Seller and buyer count declines were attributed to post-pandemic normalization, not structural demand loss — an important distinction for long-term market forecasts.
In February 2026, the Direct Selling Association issued a statement on the US Department of Labor’s proposed worker classification rule changes. As stated by the Direct Selling Association, the DSA’s worker classification advocacy in February 2026 carries direct implications for 12.2 million active contractor agreements.
A classification outcome reclassifying direct sellers as employees would reshape cost structures across the entire US channel. The DSA’s advocacy for economic reality analysis aims to protect the independent contractor framework. That framework underpins every major company’s distributor model in this sector — making the rule outcome a systemic risk, not a company-specific one.
US Direct Selling Within the Global Direct Selling Market
Global Direct Selling Market Reaches $538B by 2035
The global direct selling market will grow from USD 242.40 billion in 2025 to USD 538.04 billion by 2035 at a CAGR of 8.3%. The United States is one of the largest single-country contributors to this total. Its $47.95 billion 2025 valuation reflects both mature channel infrastructure and a services-heavy mix that sets it apart from emerging markets.
According to Supply Side Journal, Amway supplement sales grew while overall US revenue shrank. This shows the wellness sub-segment gaining share within a contracting revenue environment. Product mix, not channel structure, is driving recovery in the US market — a signal that targeted wellness positioning outperforms broad-portfolio approaches.
The US market grows at 6.5% CAGR versus the global average of 8.3%. This gap reflects Asia Pacific’s faster expansion from lower market penetration. China, India, and Southeast Asia are pulling the global average above the US rate. For investors, the US channel offers regulatory clarity and infrastructure maturity while global companies provide access to higher-growth international markets.
North America Direct Selling: Mature and Regulation-Led
North America represents the most regulated and structurally mature region within the global direct selling market. The US anchors North American volume, with Canada contributing an adjacent market under similar regulatory frameworks. As Direct Selling Association member companies expand digital and omnichannel capabilities, North America is positioned to maintain its global share through 2035.
US Direct Selling Market Scope and Report Coverage
| Report Features | Description |
|---|---|
| Market Value (2025) | USD 47.95 Billion |
| Forecast Revenue (2035) | USD 90.01 Billion |
| CAGR (2026–2035) | 6.5% |
| Base Year for Estimation | 2025 |
| Historic Period | 2020–2024 |
| Forecast Period | 2026–2035 |
| Report Coverage | Revenue Forecast, Market Dynamics, Competitive Landscape, Recent Developments |
| Segments Covered | By Product Category, By Business Model, By Participant Type, By Demographics (Gender), By Demographics (Age Groups) |
| Regional Analysis | North America, Europe, Asia Pacific, Latin America, Middle East & Africa |
| Dominant Segment | Health & Wellness (35.3%) |
| Dominant Business Model | Single-Level Marketing (51.4%) |
| Competitive Landscape | Amway, Herbalife Nutrition, eXp Realty, Primerica, Mary Kay, doTERRA, Nu Skin Enterprises, Melaleuca, Young Living, USANA |
| Data Sources | Direct Selling Association, DSA/DSEF Growth & Outlook Study, Company Filings, Federal Trade Commission, Direct Selling News |