What is the size of the Advanced and Intelligent Manufacturing Market?
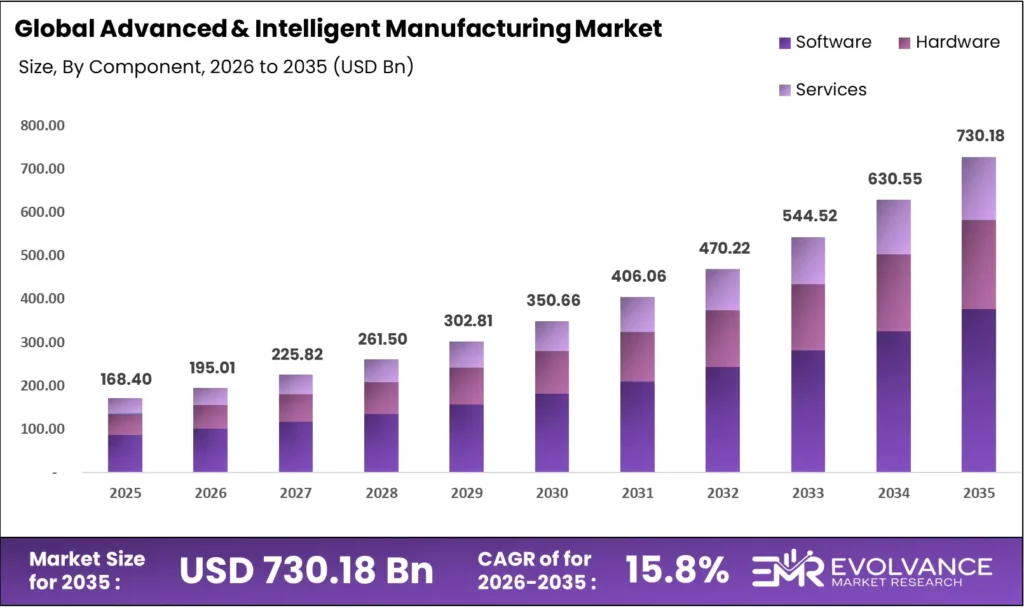
The global advanced and Intelligent Manufacturing Market size will be worth around USD 730.18 billion by 2035 from USD 460.8 billion in 2025, growing at a CAGR of 15.8% during the forecast period 2026 to 2035. AI integration into factory operations and the rollout of smart factory solutions are pulling capital spend forward at scale. Large enterprises are locking in on-premises software platforms to secure data control and production continuity. A widening shortage of skilled technical workers remains the primary constraint on faster adoption across mid-market manufacturers.
Market Highlights
- Market size grows from USD 460.8 Billion in 2025 to USD 730.18 billion by 2035, at a CAGR of 15.8%
- Software leads By Component with a 51.6% share, reflecting enterprise demand for integrated production intelligence platforms
- On-Premises dominates By Deployment with 61.56% share, driven by data security requirements and legacy system integration needs
- Large Enterprises hold 72.31% of market share By Enterprise Size, supported by higher capital budgets for smart factory rollouts
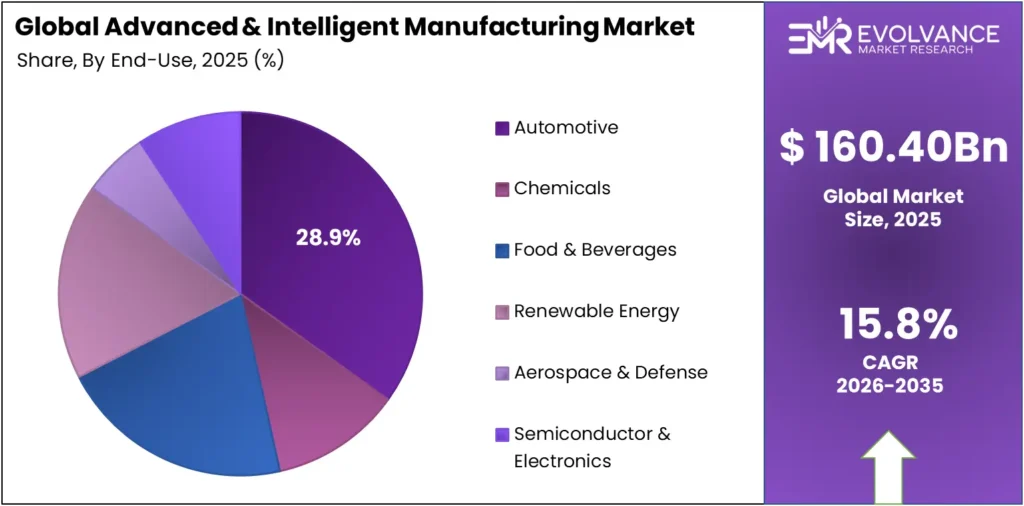
- Automotive leads By End-User with 28.9% share, with US auto robot installations reaching 13,700 units in 2024
- Additive Manufacturing dominates By Method/Process, anchored by its role in flexible production and aerospace/medical part adoption
- Programmable Logic Controllers (PLC) lead By Technology with 31.23% share, underpinning real-time industrial process control
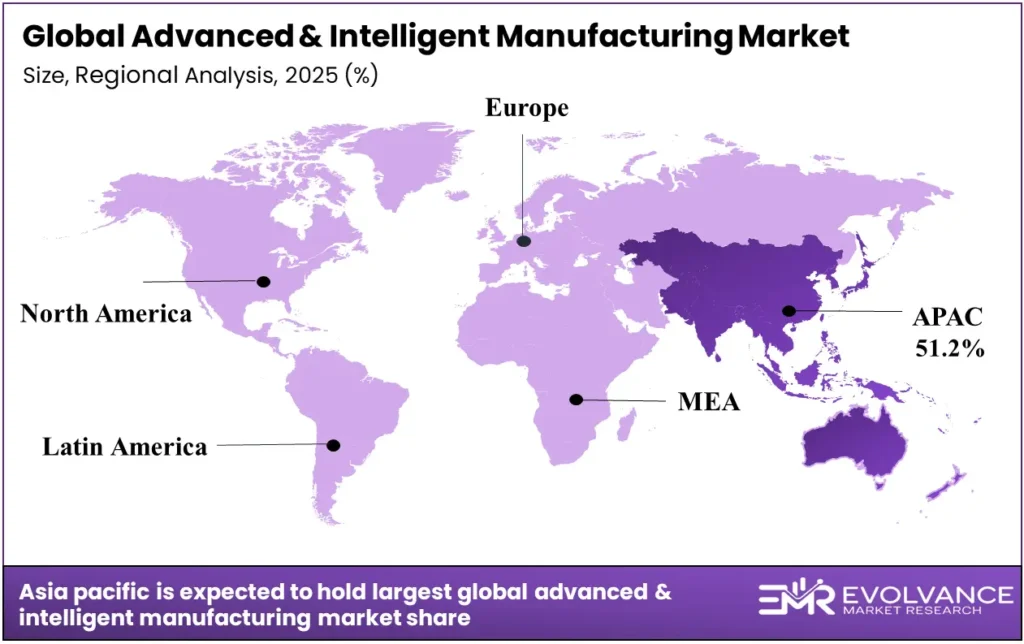
- Asia Pacific leads all regions with 51.2% share, valued at USD 235.0 Billion, driven by China’s 2,027,200 operational factory robots
Market Overview
The Advanced and Intelligent Manufacturing Market covers the integration of AI, robotics, digital twins, and connected software into industrial production. These technologies replace manual and semi-automated processes with data-driven, self-optimizing systems. The market spans hardware, software, and services across sectors including automotive, aerospace, chemicals, and semiconductors.
Smart factory adoption is no longer a pilot-stage decision for large manufacturers — it is a capital allocation priority. Manufacturers that delay AI and automation rollouts risk losing ground to competitors who are already using real-time analytics to cut cycle times and reduce defect rates. The shift is structural, not cyclical, and it is reshaping procurement patterns across all major end-user industries.
Government investment is accelerating the build-out of AI-enabled production infrastructure. In December 2025, the National Institute of Standards and Technology (NIST) launched dedicated AI Centers for Manufacturing with $20 million in funding, directly targeting technology transfer into production environments. This signals a policy shift toward treating smart manufacturing as critical infrastructure.
According to the International Federation of Robotics (IFR), 542,000 industrial robots were installed globally in 2024, the second-highest annual total in history, with total operational stock hitting 4,664,000 units. Four straight years above 500,000 annual installations confirm this is a permanent demand baseline, not a post-pandemic correction.
As reported by the IFR, global average robot density reached a record 162 units per 10,000 employees in 2023, more than double the 74 units recorded just seven years prior. South Korea leads at 1,012 robots per 10,000 employees. This density gap between leading and lagging markets defines where the next wave of capital spending will be concentrated.
Component Analysis
Software dominates with 51.6% due to enterprise demand for integrated production intelligence.
In 2025, Software held a dominant market position in the By Component segment of the Advanced and Intelligent Manufacturing Market, with a 51.6% share. Manufacturers prioritize software platforms because they unlock the value embedded in hardware and sensor networks — without analytics and control software, physical automation assets cannot be optimized at scale. Buyers are consolidating spend on unified platforms that span scheduling, quality control, and predictive maintenance.
Hardware underpins the physical layer of smart factory buildouts, covering programmable controllers, sensors, edge devices, and robotic systems. Hardware spending tracks closely with capital investment cycles. As reported by AMT Manufacturing Matters, US manufacturing technology orders totaled $386.7 million in May 2024, serving as a leading indicator that hardware investment continues despite sustained high interest rates.
Services cover system integration, commissioning, training, and ongoing managed support for advanced manufacturing deployments. As factories grow more complex, services become a recurring revenue stream rather than a one-time cost. Vendors offering outcome-based service contracts are gaining preference over transactional project models, especially among large enterprises running 24/7 production lines.
Technology Analysis
Programmable Logic Controllers (PLC) dominate with 31.23% due to proven reliability in real-time industrial process control.
In 2025, Programmable Logic Controllers (PLC) held a dominant market position in the By Technology segment, with a 31.23% share. PLCs are the foundational control layer in factories worldwide — they run deterministic processes where millisecond-level timing matters. Their deep integration into existing production lines makes displacement costly, giving established PLC vendors a durable installed base advantage.
Product Lifecycle Management (PLM) software connects design, engineering, and production data into a single source of record. Manufacturers using PLM reduce revision cycles and cut time-to-market for new product variants. The technology is particularly critical in aerospace and automotive, where regulatory documentation and design traceability are mandatory across multi-year production programs.
Manufacturing Execution Systems (MES) provide real-time visibility into shop floor operations, linking planning systems with machine-level data. MES adoption is expanding beyond discrete manufacturers into process industries, driven by demand for traceability and yield optimization. The technology sits at the intersection of operational data and enterprise decision-making.
Enterprise Resource Planning (ERP) remains the operational backbone for production planning, procurement, and finance across manufacturing enterprises. Modern ERP platforms are adding embedded AI modules, bringing predictive analytics directly into purchasing and inventory workflows. This convergence is blurring the boundary between ERP and MES functionality.
Human Machine Interface (HMI) systems are shifting from physical panels to software-based interfaces running on standard hardware. This transition reduces proprietary lock-in and allows remote monitoring. As factory workers interact with more complex systems, intuitive HMI design directly affects output quality and operator error rates.
Plant Asset Management covers monitoring, maintenance scheduling, and lifecycle tracking of production equipment. Condition-based maintenance enabled by real-time sensor data is replacing fixed maintenance schedules. This shift reduces unplanned downtime — a critical cost driver in continuous process manufacturing like chemicals and metals.
Digital Twin technology creates virtual replicas of physical assets and processes for simulation and optimization. Based on data from NIST, a 2024 study of 29 digital twin architectures found several multinationals adopting the ISO 23247 standard for manufacturing digital twins, though most implementations remain focused on functional aspects. Early adopters with mature digital twin programs are building compounding advantages in yield and uptime that competitors without them cannot replicate quickly.
Industrial IoT (IIoT) connects machines, sensors, and systems into unified data networks that feed analytics and control platforms. According to the IFR Americas Press Release 2025, China operated approximately five times more factory robots than the US in 2024 — 2,027,200 vs. 393,700 units. This gap reflects IIoT maturity differences and signals where IIoT infrastructure investment must accelerate to remain competitive.
Discrete Control Systems (DCS) manage complex continuous processes in industries like chemicals, oil refining, and power generation. DCS platforms are integrating AI-driven optimization layers that adjust process variables in real time. This reduces energy consumption per unit of output — a direct response to both cost pressure and ESG targets.
SCADA systems provide supervisory control and data acquisition across geographically distributed infrastructure. SCADA adoption is expanding into renewable energy and water management sectors, driven by the need to remotely monitor assets that span large areas. Cybersecurity hardening of SCADA networks has become a procurement requirement, not an option.
3D Printing (additive manufacturing) is transitioning from prototyping into end-use part production. Findings from SME’s 2024 Additive Manufacturing Industry Report track AM’s shift into mainstream production, with expanding adoption across aerospace, medical, and industrial sectors. Manufacturers using 3D printing for spare parts are cutting inventory carrying costs and lead times simultaneously.
Machine Vision systems automate inspection, measurement, and guidance tasks at production line speeds no human team can match. Adoption is accelerating in semiconductor fabrication and food processing, where defect tolerance is near zero. Machine vision is increasingly paired with AI inference chips, enabling real-time classification at the edge without cloud round-trip latency.
End-User Analysis
Automotive dominates with 28.9% due to high robot density and deep capital investment in automated assembly.
In 2025, Automotive held a dominant market position in the By End-User segment, with a 28.9% share. As reported by the IFR, US auto industry robot installations grew 10.7% in 2024, reaching 13,700 units. The US auto sector ties with Japan and Germany for fifth place globally in robot density. EV platform transitions are further accelerating automation spend as assembly line reconfigurations require new robot cells.
Chemicals manufacturers are adopting advanced process control and AI-driven optimization to reduce energy intensity and improve yield consistency. Regulatory pressure on emissions and waste reporting is creating demand for real-time monitoring solutions that feed sustainability disclosures. Continuous process environments in chemicals benefit disproportionately from predictive maintenance and DCS upgrades.
Food and Beverages manufacturers are deploying machine vision and robotics to address labor shortages in packing and palletizing operations. Hygiene and traceability regulations are pushing adoption of digital record-keeping integrated with MES platforms. The sector’s thin margins make automation ROI calculations particularly time-sensitive.
Renewable Energy producers are integrating SCADA and IIoT platforms to manage distributed generation assets. Solar and wind farms require remote monitoring infrastructure that can flag performance degradation before it compounds. The sector’s growth directly adds to demand for advanced monitoring and control technology.
Aerospace and Defense demands the highest precision tolerances and the most rigorous traceability of any manufacturing end-user. Additive manufacturing is gaining ground for low-volume structural components where traditional tooling costs are prohibitive. PLM and digital twin adoption in Aerospace and Defense is driven by regulatory audit requirements, not just operational preference.
Semiconductor and Electronics manufacturers operate at the intersection of precision engineering and high-volume throughput. Machine vision and automated quality inspection are essential at sub-micron scale. The US CHIPS Program’s $1.4 billion in advanced packaging awards, announced in January 2025, is directly funding factory automation upgrades in this segment.
Metals and Mining operations are deploying autonomous vehicles, remote monitoring systems, and AI-based ore grade prediction. These technologies reduce human exposure to hazardous environments while improving extraction efficiency. Digital twins of pit and shaft operations allow planners to model extraction scenarios before committing capital.
Logistics and Warehousing is one of the fastest-adopting end-user segments for automation technology. Based on data from the Bureau of Labor Statistics (BLS), warehousing firms are increasingly using automation — warehouse management systems, automated guided vehicles, robots, and AI — with productivity gains expected to limit labor demand. This dynamic makes the sector a steady absorber of IIoT and robotics investment regardless of broader economic cycles.
Healthcare and Medical Devices manufacturers face strict FDA and CE marking requirements that make quality traceability a compliance mandate, not a competitive option. Additive manufacturing is enabling patient-specific implants and surgical instruments. MES platforms in this sector must maintain complete audit trails from raw material to finished device.
Oil and Gas operators are deploying predictive analytics and IIoT sensors to extend asset life and reduce costly unplanned shutdowns on offshore and pipeline infrastructure. The sector’s high cost of downtime makes digital twin and remote monitoring ROI particularly compelling. ESG pressure is also driving investment in emissions monitoring systems.
Pharmaceuticals and Life Sciences manufacturers are under intense regulatory scrutiny from agencies including the FDA and EMA. Continuous manufacturing processes enabled by advanced process analytical technology (PAT) are replacing batch production. Manufacturers adopting these systems gain both regulatory advantage and cost efficiency through higher yields.
Deployment Analysis
On-Premises dominates with 61.56% due to data security requirements and deep legacy system integration needs.
In 2025, On-Premises held a dominant market position in the By Deployment segment, with a 61.56% share. Large manufacturers in regulated industries — aerospace, defense, pharmaceuticals — cannot expose production data to shared cloud environments without significant compliance risk. On-premises deployment keeps data within plant boundaries, satisfying both internal security policies and external audit requirements. This structural constraint is not dissolving quickly.
Cloud deployment is gaining adoption in non-critical applications where data latency and security exposure are manageable. Cloud-based MES and analytics platforms allow smaller manufacturers to access enterprise-grade capabilities without large upfront infrastructure spend. Hybrid architectures that keep sensitive process data on-premises while routing non-critical analytics to the cloud are the primary growth vector for cloud in this sector.
Hybrid deployment models are the pragmatic bridge between legacy on-premises infrastructure and cloud scalability. Manufacturers are architecting edge-to-cloud data pipelines where time-sensitive control functions run locally and aggregated analytics are processed in the cloud. According to AMT, manufacturing technology orders in H2 consistently exceed H1 by about 10%, a pattern that signals capital commitments to hybrid infrastructure tend to cluster in Q3 and Q4 planning cycles.
Enterprise Size Analysis
Large Enterprises dominate with 72.31% due to higher capital budgets and faster ROI realization on advanced tech investments.
In 2025, Large Enterprises held a dominant market position in the By Enterprise Size segment, with a 72.31% share. Large manufacturers have the financial capacity to absorb the integration complexity and upfront costs of smart factory deployments. They also have the data volumes required to train AI models effectively, creating a compounding advantage over smaller competitors who cannot generate equivalent training datasets.
Small and Medium Enterprises (SMEs) represent the underpenetrated opportunity in the advanced manufacturing space. SME adoption is constrained by capital access, IT talent gaps, and the complexity of integrating new systems with aging equipment. Cloud-based and subscription-priced platforms are the primary enablers of SME participation, but adoption rates remain well below those of large enterprise peers.
Method / Process Analysis
Additive Manufacturing dominates due to its unique ability to produce complex geometries at low volumes without tooling investment.
In 2025, Additive Manufacturing held a dominant market position in the By Method/Process segment. The technology’s core competitive advantage is geometric freedom — it can produce shapes impossible to machine subtractively, which is the primary reason aerospace and medical device manufacturers are expanding AM use beyond prototyping into certified end-use parts. According to NIST’s November 2024 review, additive manufacturing is identified as a core enabler of flexible and competitive production, particularly for rapid response to changing requirements and high data-volume integration.
Subtractive Manufacturing remains the dominant production method by volume for precision metal components. CNC machining and grinding deliver surface finishes and dimensional tolerances that additive processes cannot yet match for many industrial applications. The installed base of subtractive equipment is vast, and retrofitting it with smart controls and sensors is a near-term growth path for the advanced manufacturing sector.
Collaborative Robotics (Cobots) are designed to work alongside human operators without safety cages, making them accessible for small-batch and flexible assembly operations. Their lower cost and easier programming compared to traditional industrial robots are opening automation to SMEs and high-mix, low-volume production environments. Cobot adoption is particularly strong in electronics assembly and light manufacturing.
Agentic AI Production Scheduling uses AI agents to autonomously plan, adjust, and optimize production schedules in real time based on demand signals, machine availability, and supply chain inputs. This approach goes beyond rule-based scheduling by learning from historical production data to minimize changeover time and buffer stocks. Early adopters are reporting measurable reductions in work-in-process inventory and scheduling exceptions. The broader impact of these systems extends into Agentic AI in Supply Chain and Logistics, where autonomous agents are transforming procurement, transportation routing, and last-mile delivery across global manufacturing networks.
Market Segments Covered in the Report
By Component
- Software
- Hardware
- Services
By Technology
- Programmable Logic Controllers (PLC)
- Product Lifecycle Management (PLM)
- Manufacturing Execution Systems (MES)
- Enterprise Resource Planning (ERP)
- Human Machine Interface (HMI)
- Plant Asset Management
- Digital Twin
- Industrial IoT (IIoT)
- Discrete Control Systems (DCS)
- SCADA
- 3D Printing
- Machine Vision
By End-User
- Automotive
- Chemicals
- Food and Beverages
- Renewable Energy
- Aerospace and Defense
- Semiconductor and Electronics
- Metals and Mining
- Logistics and Warehousing
- Healthcare and Medical Devices
- Oil and Gas
- Pharmaceuticals and Life Sciences
By Deployment
- On-Premises
- Cloud
- Hybrid
By Enterprise Size
- Large Enterprises
- Small and Medium Enterprises (SMEs)
By Method / Process
- Additive Manufacturing
- Subtractive Manufacturing
- Collaborative Robotics (Cobots)
- Agentic AI Production Scheduling
Advanced and Intelligent Manufacturing Market Regional Insights
Asia Pacific Dominates the Advanced and Intelligent Manufacturing Market with a Market Share of 51.2%, Valued at USD 235.0 Billion
Asia Pacific commands 51.2% of the global advanced manufacturing market, valued at USD 235.0 Billion in 2025. China’s manufacturing scale is the primary structural driver — the country operates 2,027,200 factory robots, nearly five times the US total. Government-led industrial policy in China, Japan, and South Korea continues to direct public capital into automation, digital infrastructure, and AI-enabled production at a pace that no other region matches.
North America Advanced and Intelligent Manufacturing Market Trends
North America is the second-largest market, anchored by sustained US capital investment in AI-driven production. The US CHIPS Program and NIST’s AI manufacturing centers are channeling federal funding into semiconductor and advanced factory buildouts. US manufacturing technology orders reached USD 386.7 million in May 2024 alone, confirming that private capital investment in production technology remains robust despite interest rate pressure.
Europe Advanced and Intelligent Manufacturing Market Trends
Europe’s advanced manufacturing sector is shaped by Germany’s embedded industrial base and the European Union’s push for digital and green industrial transformation. The EU’s Net-Zero Industry Act and its Chips Act are directing investment into both sustainable production and semiconductor capacity. Germany and Sweden lead in robot density, with European manufacturers increasingly adopting digital twin frameworks to meet both efficiency and carbon reporting requirements.
Latin America Advanced and Intelligent Manufacturing Market Trends
Latin America is at an early stage of smart factory adoption, with Brazil and Mexico representing the primary markets. Mexico’s proximity to the US and its role in nearshoring supply chains is pulling advanced automation investment into automotive and electronics assembly. Brazil’s domestic manufacturing base is investing in MES and ERP upgrades to improve traceability and compliance with export market requirements.
Middle East and Africa Advanced and Intelligent Manufacturing Market Trends
The Middle East and Africa region is building advanced manufacturing capacity as part of economic diversification programs. Saudi Arabia’s Vision 2030 and the UAE’s industrial strategy are funding smart factory pilots in petrochemicals and aerospace MRO. South Africa is the primary African market, with automotive assembly and mining operations driving IIoT and automation adoption, supported by government manufacturing incentive programs.
Country-Level Market Insights
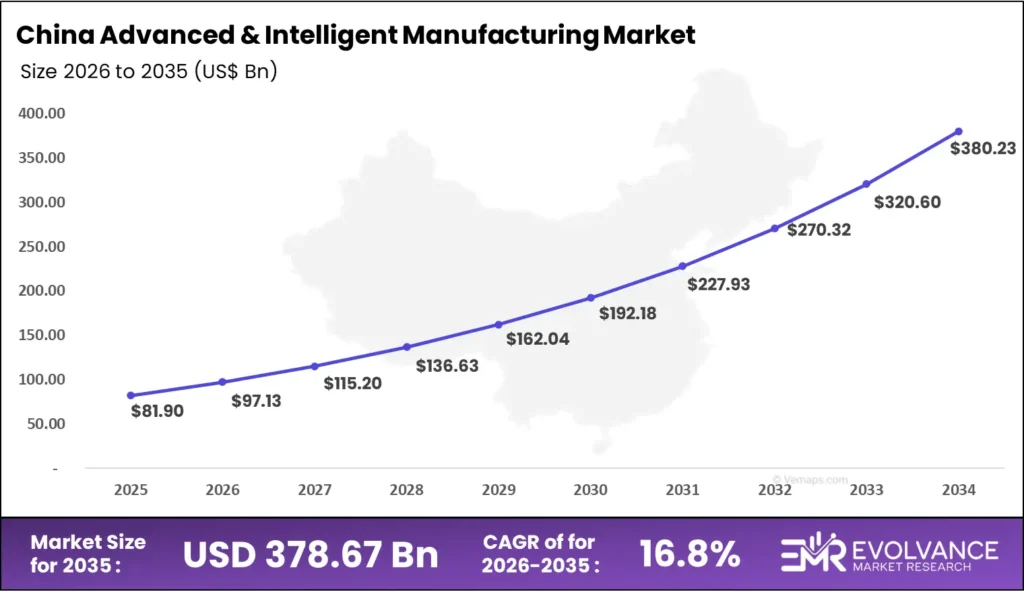
China Advanced & Intelligent Manufacturing Market
China’s Advanced & Intelligent Manufacturing Market is valued at USD 81.9 Billion in 2025 and will reach USD 380.2 Billion by 2035, at a CAGR of 18.6%. This growth rate exceeds the global average of 15.8%, confirming that China is not just participating in the advanced manufacturing shift — it is setting the pace for the rest of the world.
China operates 2,027,200 factory robots — nearly five times the US total — and now ranks third globally in robot density at 470 units per 10,000 employees, surpassing both Germany and Japan. This operational scale means Chinese manufacturers are already generating the production data volumes required to train and refine AI models at a speed that most global competitors cannot match.
Key Regions and Countries
North America
- US
- Canada
Europe
- Germany
- France
- The UK
- Spain
- Italy
- Rest of Europe
Asia Pacific
- China
- Japan
- South Korea
- India
- Australia
- Rest of APAC
Latin America
- Brazil
- Mexico
- Rest of Latin America
Middle East and Africa
- GCC
- South Africa
- Rest of MEA
Regulatory Landscape
In the US, NIST issued a $70 million funding opportunity in July 2024 for an AI-focused Manufacturing USA Institute, establishing AI integration standards and best practices for industrial settings. This initiative sets a de facto technology benchmark that US manufacturers and their suppliers are expected to align with over the 2025–2035 forecast period.
The White House Office of Science and Technology Policy (OSTP) issued a Request for Information in June 2025 for a National Strategic Plan for Advanced Manufacturing, per the Federal Register. This RFI signals that binding federal manufacturing technology standards are in development. Manufacturers supplying US government contractors should treat this as an early compliance signal.
In Europe, the EU Chips Act enacted in 2023 mandates investment in semiconductor manufacturing capacity and sets technology resilience requirements that ripple into advanced factory equipment procurement. The EU’s Corporate Sustainability Reporting Directive (CSRD), effective from 2024, requires large manufacturers to disclose Scope 1 and Scope 2 emissions — creating compliance demand for real-time energy monitoring systems integrated with production platforms.
In Asia Pacific, China’s “Made in China 2025” and subsequent industrial policies require domestic manufacturers in priority sectors to meet automation density and AI adoption benchmarks. South Korea’s government maintains direct subsidies for smart factory certification programs, with certified facilities accessing preferential financing rates. These policy frameworks create mandatory adoption timelines that private sector buyers cannot ignore.
Drivers
AI Integration and Smart Factory Investment Create Durable Competitive Pressure on All Manufacturers
Manufacturers that invest in AI-driven production platforms are compressing cycle times and defect rates in ways that cannot be replicated by labor-intensive competitors. The structural advantage compounds over time as AI models train on accumulated production data. This creates a first-mover dynamic where early adopters widen their cost and quality gap every quarter they operate ahead of laggards.
In July 2024, NIST announced a $70 million funding opportunity for an AI-focused Manufacturing USA Institute, directly subsidizing AI adoption in US factories. This program lowers the entry cost for manufacturers testing AI-driven scheduling, quality control, and process optimization. Federal co-investment of this scale signals to private capital that AI manufacturing is a government-backed priority sector for the next decade.
According to AMT Manufacturing Matters, since January 2020, US machine tool orders grew 40%, cutting tool shipments rose 36%, and workholding technology shipments increased 27%. Capital intensity in US manufacturing rose 10% in the three years after 2020. These figures confirm that AI investment is not theoretical — it is already translating into measurable equipment spending across the US industrial base.
Restraints
Skilled Labour Shortages and Geopolitical Supply Risks Slow Advanced Tech Rollouts Across Manufacturing
Advanced manufacturing technology requires operators, programmers, and maintenance staff who can work with AI systems, robotics, and digital platforms. This workforce does not exist in sufficient numbers. According to NIST, 83% of US manufacturers reported an overall shortage of qualified employees in the additive manufacturing field. That figure reflects a systemic gap, not a cyclical one — and it directly caps the rate at which new technology can be productively absorbed.
Geopolitical trade tensions and semiconductor export restrictions are creating supply instability for advanced manufacturing technology components. Chip shortages that delayed automotive production in 2021–2022 demonstrated how a single constrained input can halt entire assembly lines. Restrictions on high-bandwidth memory and advanced logic chips — critical for AI inference at the edge — create ongoing procurement uncertainty for manufacturers building AI-integrated production systems.
The combination of workforce gaps and supply chain risk creates a compounding constraint. Manufacturers cannot scale up smart factory operations if they lack both the people to run new systems and a reliable supply of the chips those systems depend on. This dual restraint is not easily resolved by vendor relationships or training programs alone — it requires coordinated policy responses that are still in early stages in most markets.
Growth Factors
Government Capital and Digital Infrastructure Buildout Expand the Addressable Market Beyond Early Adopters
Hyundai’s $7.6 billion AI-powered smart factory in the US is one of the clearest signals that advanced manufacturing investment is moving from pilot to full-scale production commitment. Purpose-built AI manufacturing plants create immediate demand for the full stack — robotics, IIoT sensors, MES software, digital twins, and edge computing hardware. Each facility of this scale generates a multi-year procurement cycle across dozens of technology vendors.
As reported by BLS Employment Projections 2024–2034, computer and data-related occupations will grow more than three times the average US employment rate, at 10.1% through 2034, driven by AI integration across industries. This workforce growth projection confirms that the technical talent required to sustain advanced manufacturing operations is being actively produced — reducing the long-term severity of the skills constraint.
In January 2025, the US Department of Commerce announced $1.4 billion in final CHIPS Program awards for advanced semiconductor packaging. These awards fund the physical production infrastructure — cleanrooms, automated handling systems, and process control platforms — that advanced packaging requires. Semiconductor capacity built with CHIPS funding becomes long-term demand for advanced manufacturing technology suppliers across the supply chain.
Emerging Trends
Digital Twins and Real-Time Analytics Shift Manufacturing from Reactive to Predictive Operations
Digital twin adoption is moving from concept to production-floor standard in leading manufacturing organizations. NIST launched a cross-laboratory Digital Twins research initiative in FY2024, covering manufacturing, smart cities, healthcare, and energy. This institutional commitment signals that digital twin frameworks will increasingly be embedded in procurement specifications and compliance requirements across government-adjacent manufacturing contracts.
Based on data from NIST, unplanned downtime accounts for 8.3% to 13.3% of planned production time in US discrete manufacturing, creating $245 billion in annual losses, with defects adding another $32 billion to $58.6 billion per year. The estimated annual benefit of full digital twin adoption across US manufacturing is $37.9 billion. For any CFO assessing the ROI of a digital twin program, these NIST figures provide an anchored business case that internal estimates cannot credibly dismiss.
The White House OSTP’s June 2025 Request for Information on a National Strategic Plan for Advanced Manufacturing specifically flagged connected factory ecosystems — integrating IoT, 5G, AI, and cloud analytics — as priority areas for national policy. Manufacturers building these integrated stacks now are positioning themselves ahead of standards that will likely become procurement requirements for government contractors within the forecast period.
Advanced and Intelligent Manufacturing Market Key Companies Insights
Siemens AG operates across the full advanced manufacturing stack — from PLC hardware and SCADA systems to PLM software and digital twin platforms. Its Xcelerator portfolio integrates hardware and software into a unified industrial data environment, which gives Siemens a cross-selling advantage that pure-play software or pure-play hardware vendors cannot replicate. Manufacturers standardizing on Siemens infrastructure face high switching costs, creating durable recurring revenue for the company.
Rockwell Automation, Inc. focuses on industrial control systems and information software for North American manufacturing, with particular strength in the food and beverage, automotive, and life sciences verticals. Its FactoryTalk software suite connects MES, analytics, and asset management into a single platform. Rockwell’s partnership with Microsoft Azure for cloud-connected manufacturing intelligence positions it to capture hybrid deployment spend as customers move edge data to the cloud.
ABB Ltd. competes at the intersection of robotics, electrification, and process automation — making it one of the few vendors with credible offerings across both discrete and continuous manufacturing environments. ABB’s robotics division benefits directly from the global robot density expansion tracked by the IFR. In June 2025, Honeywell completed its acquisition of Sundyne for $2.16 billion, intensifying competitive pressure on ABB’s process automation business by strengthening a major rival’s pump and compressor solutions portfolio.
Schneider Electric SE built its advanced manufacturing position around energy management and industrial automation, combining EcoStruxure — its IoT-enabled architecture — with a strong SCADA and DCS portfolio. Its ESG-aligned positioning is a strategic differentiator as manufacturers face mounting carbon reporting requirements. Schneider’s ability to offer both energy efficiency and production automation in a single vendor relationship reduces procurement complexity for large industrial buyers pursuing sustainability targets.
Key players
- Siemens AG
- Rockwell Automation, Inc.
- ABB Ltd.
- Schneider Electric SE
- Mitsubishi Electric Corporation
- Stratasys Ltd.
- 3D Systems Corporation
- EOS GmbH
- HP Inc.
- NVIDIA Corporation
- Microsoft Corporation
- PTC Inc.
- Amazon Web Services (AWS)
- Robotics and Machinery
- FANUC Corporation
- KUKA AG
- Emerson Electric Co.
Recent Development
- July 2025 – MaintainX raised $150 million in a Series D funding round. The company provides AI-powered maintenance and operations management software for industrial facilities, with this raise targeting expansion into advanced manufacturing verticals.
- January 2026 – Redwood Materials secured $425 million in a Series E round with Google as a participant. The round funds battery materials recycling infrastructure that directly supports the AI-powered manufacturing supply chain for EV and energy storage production.
- December 2024 – SK hynix received a $458 million CHIPS incentives award from the Biden-Harris administration via NIST. The award funds advanced memory chip production capacity essential for AI inference hardware used in smart manufacturing systems.
- 2025 – Global advanced manufacturing MandA reached $717 billion in deal value, according to Bain and Company, as part of a broader $4.8 trillion record-level global MandA rebound. Consolidation at this scale is reshaping competitive boundaries and accelerating technology portfolio expansion among the largest industrial players.
Market Scope
| Report Features | Description |
|---|---|
| Market Value (2025) | USD 460.8 Billion |
| Forecast Revenue (2035) | USD 730.18 Billion |
| CAGR (2026-2035) | 15.8% |
| Base Year for Estimation | 2025 |
| Historic Period | 2020-2024 |
| Forecast Period | 2026-2035 |
| Report Coverage | Revenue Forecast, Market Dynamics, Competitive Landscape, Recent Developments |
| Segments Covered | By Component (Software, Hardware, Services), By Technology (PLC, PLM, MES, ERP, HMI, Plant Asset Management, Digital Twin, IIoT, DCS, SCADA, 3D Printing, Machine Vision), By End-User (Automotive, Chemicals, Food and Beverages, Renewable Energy, Aerospace and Defense, Semiconductor and Electronics, Metals and Mining, Logistics and Warehousing, Healthcare and Medical Devices, Oil and Gas, Pharmaceuticals and Life Sciences), By Deployment (On-Premises, Cloud, Hybrid), By Enterprise Size (Large Enterprises, SMEs), By Method/Process (Additive Manufacturing, Subtractive Manufacturing, Collaborative Robotics, Agentic AI Production Scheduling) |
| Regional Analysis | North America (US and Canada), Europe (Germany, France, The UK, Spain, Italy, and Rest of Europe), Asia Pacific (China, Japan, South Korea, India, Australia, and Rest of APAC), Latin America (Brazil, Mexico, and Rest of Latin America), Middle East and Africa (GCC, South Africa, and Rest of MEA) |
| Competitive Landscape | Siemens AG, Rockwell Automation Inc., ABB Ltd., Schneider Electric SE, Mitsubishi Electric Corporation, Stratasys Ltd., 3D Systems Corporation, EOS GmbH, HP Inc., NVIDIA Corporation, Microsoft Corporation, PTC Inc., Amazon Web Services (AWS), Robotics and Machinery, FANUC Corporation, KUKA AG, Emerson Electric Co. |
| Customization Scope | Customization for segments, region/country-level will be provided. Moreover, additional customization can be done based on the requirements. |
| Purchase Options | We have three licenses to opt for: Single User License, Multi-User License (Up to 5 Users), Corporate Use License (Unlimited User and Printable PDF) |