What is the Grid-scale Battery Storage Market Size?
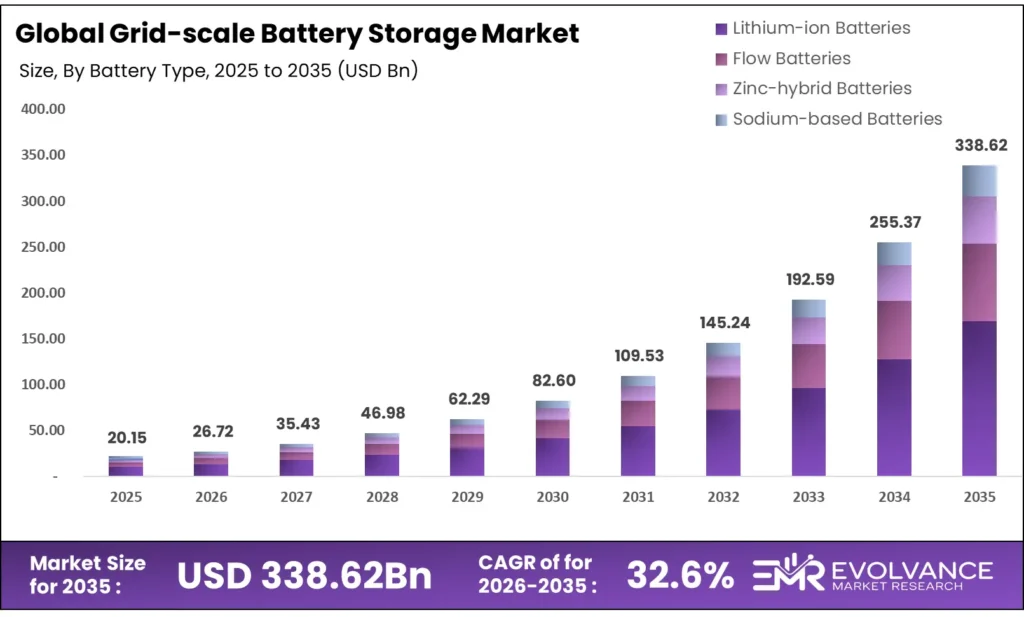
The Global Grid-scale Battery Storage Market size will be worth around USD 338.62 Billion by 2035 from USD 20.15 Billion in 2025, growing at a CAGR of 32.6% during the forecast period 2026 to 2035. Utility buyers are shifting spend from gas peaker plants to battery systems as renewable output rises and grid costs fall. Enterprise procurement now favors multi-hour storage assets over short-duration systems, signaling a move toward longer discharge requirements. Supply chain risks tied to tariff policy and raw material sourcing remain the key constraint on project timelines.
Market Highlights
- The Global Grid-scale Battery Storage Market value will grow from USD 20.15 Billion in 2025 to USD 338.62 Billion by 2035, at a CAGR of 32.6% from 2026 to 2035.
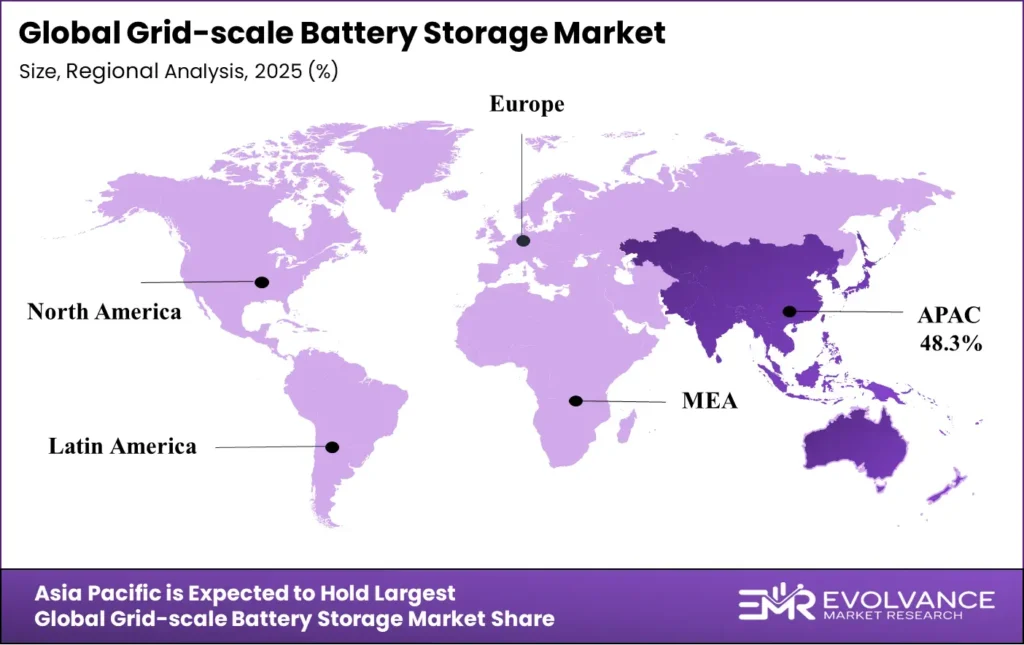
- Asia-Pacific leads with 48.3% regional share, valued at USD 9.7 Billion.
- Lithium-ion batteries dominate with 67.2% share of the battery type segment.
- The 100–250 MW range was the leading segment in By Power Capacity with a 54.1% share.
- Renewable Load Sharing was the dominant application with a 35.7% share.
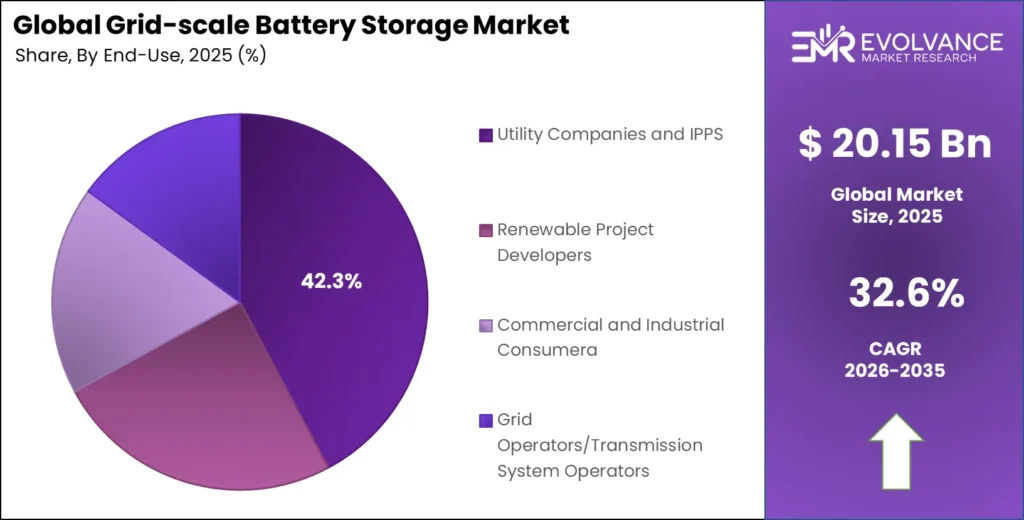
- Utility Companies and Independent Power Producers (IPPs) accounted for the largest 42.3% share in the By End-User segment.
Market Overview
Grid-scale battery storage refers to large battery systems tied directly to electricity grids. These systems store power during low-demand periods and release it during peaks. Utilities, grid operators, and renewable developers use them to balance supply, cut curtailment, and meet frequency regulation needs without burning fossil fuels.
The market covers several battery types, including lithium-ion, flow, sodium-based, and zinc-hybrid chemistries. It spans multiple deployment points — from transmission and distribution networks to direct links with renewable energy generators. End-users range from large utility firms and independent power producers to commercial buyers and grid system operators.
Government policy is a strong pull factor. Italy awarded 10 GWh of grid battery capacity in its first auction in 2025, with Enel winning over half at average prices of roughly €13,000 per MWh per year — well below the regulatory cap of €37,000. That price gap shows strong private sector appetite and signals that regulated auction models are viable tools for governments aiming to add storage at scale.
According to the U.S. Energy Information Administration, the U.S. added a record 15 GW of utility-scale battery storage in 2025, with 24 GW planned for 2026. This sharp jump signals that procurement cycles are compressing — what took five years now happens in one — and vendors who cannot scale production fast enough will lose orders to those who can.
Global BESS installed capacity was set to exceed 110 GWh in 2025, a projected 41% rise from 78 GWh in 2024, based on data from Global Growth Insights. This pace tells buyers that system prices will continue falling as volumes rise, making 2025–2027 the window where early procurement locks in the best long-term cost positions.
Battery Type Insights
Lithium-ion Batteries dominate with 67.2% due to mature supply chains and falling cell costs.
In 2025, Lithium-ion Batteries held a dominant market position in the By Battery Type segment of the Grid-scale Battery Storage Market, with a 67.2% share. Lithium iron phosphate chemistry accounted for 62% of new BESS installations in 2025. LFP’s edge comes from lower thermal risk and a cost curve that keeps declining as Chinese cell producers scale output — making it the default choice for utility procurement teams.
Flow Batteries serve markets where discharge duration matters more than upfront cost. These systems cycle for 6–12 hours per day without significant capacity loss over time. That trait suits applications where utilities need multi-day backup or seasonal balancing — use cases that lithium-ion cells cannot fill economically at scale today.
Zinc-hybrid Batteries address supply chain concerns linked to lithium and cobalt. Zinc is globally abundant and far less subject to trade restrictions. This makes zinc-hybrid systems a credible hedge for developers in markets where tariff risk — such as the U.S. 156%+ tariff on non-EV Chinese batteries imposed in April 2025 — threatens project economics for lithium-dependent storage solutions.
Sodium-based Batteries are gaining traction as an alternative for large, stationary storage where weight and energy density matter less than cycle life and material cost. Sodium cells use no lithium, cobalt, or nickel — removing the three costliest raw material inputs. For emerging markets building new grid infrastructure, sodium chemistry offers a lower-cost path into utility-scale storage without relying on constrained supply chains.
Deployment Network Insights
Transmission Network dominates with 46.3% due to high-capacity project concentration and grid stability demand.
In 2025, Transmission Network held a dominant market position in the By Deployment Network segment of the Grid-scale Battery Storage Market, with a 46.3% share. Transmission-connected systems handle the largest power flows and generate the most revenue through ancillary services. Fluence Energy’s 1 GW / 4 GWh project with LEAG in Jänschwalde, Germany — Europe’s largest single battery storage project — sits at this level, showing that transmission-scale assets now attract headline investment in both volume and deal size.
Distribution Network storage is growing as utilities push storage closer to load centers. Congestion at the transmission level makes local distribution assets more valuable — especially in dense urban grids where building new lines is either too costly or physically impossible. This segment benefits directly from the shift toward localized energy management.
Renewable Energy Generators co-located with battery systems are now the most capital-efficient model for solar and wind developers. Tesla’s full EPC agreement with Matrix Renewables for a 500 MW / 1 GWh standalone Megapack project in Scotland shows that standalone BESS at generator sites is now a bankable asset class — not just an add-on to renewable farms.
Power Capacity Insights
100–250 MW dominates with 54.1% due to alignment with utility procurement specs and project finance thresholds.
In 2025, 100–250 MW held a dominant market position in the By Power Capacity segment of the Grid-scale Battery Storage Market, with a 54.1% share. Projects in this tier are large enough to qualify for long-term power purchase agreements and small enough to avoid the regulatory complexity of transmission-scale infrastructure. That balance makes this tier the most financeable range in the market today.
Up to 10 MW projects serve commercial and industrial buyers who need on-site backup or demand charge management. These systems often avoid grid interconnection queues entirely — an increasingly important advantage as queue backlogs grow across the U.S. and Europe and delay larger project timelines by years.
10–50 MW assets bridge distributed and utility-scale use cases. Municipal utilities and smaller renewable developers favor this tier because it fits within standard procurement budgets and can be permitted faster than larger systems. This segment is likely to grow as grid operators push decentralized storage strategies.
50–100 MW capacity systems are common in markets with active storage auction programs. Italy’s 10 GWh auction in 2025 attracted bids at this scale, and the clearing price well below the regulatory cap signals competitive tension — which will keep this segment active as more European countries replicate the auction model.
Above 250 MW projects are now emerging as a distinct category driven by flagship announcements. The BYD HaoHan system, with configurations up to 14.5 MWh per container, and Tesla’s Megablock facility in Houston targeting 50 GWh annual capacity from 2026, both point to a new tier of hyperscale projects that will redefine what “large” means in grid storage over the next five years.
Application Insights
Renewable Load Sharing dominates with 35.7% due to rapid renewable capacity additions and curtailment management needs.
In 2025, Renewable Load Sharing held a dominant market position in the By Application segment of the Grid-scale Battery Storage Market, with a 35.7% share. As solar and wind capacity expands faster than grid upgrades, curtailment losses mount. Batteries co-located with renewable assets capture that otherwise wasted output and sell it when prices are higher — turning an operational cost into a revenue stream for project owners.
Peak Shaving allows utilities and large industrial users to reduce demand charges by drawing on stored energy during high-cost grid windows. With electricity prices spiking during peak hours in liberalized markets, the financial case for peak shaving is strongest where retail tariff structures reward demand flexibility — conditions that now apply across most of the U.S., UK, and Australia.
Load Shifting arbitrage — charging at low overnight prices and discharging during daytime peaks — is becoming more viable as price spreads widen on grids with high renewable penetration. U.S. utility-scale battery capacity increased 66% in 2024 to exceed 26 GW cumulative, per EIA data, with Solar Photovoltaic (PV) Materials plus battery accounting for 81% of new capacity additions. That mix shows load shifting and renewable load sharing are now deeply linked applications.
Backup Power storage serves critical infrastructure, data centers, and industrial facilities where grid outages carry high financial or safety costs. This application is less price-sensitive than arbitrage-based uses, making it attractive for vendors who can offer premium reliability guarantees rather than competing on system cost alone.
Others include frequency regulation, voltage support, and black-start capability. These ancillary services often carry the highest per-MWh revenue in grid markets but require fast-response lithium-based systems. New York State’s filing of its Retail and Residential Energy Storage Implementation Plan in 2025, advancing its 6 GW roadmap policy from June 2024, signals that regulators are now creating structured revenue streams for these applications.
End-User Insights
Utility Companies and IPPs dominate with 42.3% due to large capital capacity and long-term offtake structures.
In 2025, Utility Companies and IPPs held a dominant market position in the By End-User segment of the Grid-scale Battery Storage Market, with a 42.3% share. Utilities hold the grid contracts, land rights, and regulatory relationships that make large-scale storage bankable. Independent power producers use storage to extend the value of their generation assets — particularly in merchant markets where ancillary service revenues supplement energy sales.
Renewable Project Developers are the fastest-growing buyer group as storage becomes a standard component of new renewable project bids. Developers who bundle storage with generation win longer PPAs and better capacity prices in competitive tenders. This trend is reshaping project finance models, with lenders now routinely underwriting storage as core infrastructure rather than an optional add-on.
Commercial and Industrial Consumers are adopting storage to cut energy costs and meet corporate sustainability targets. Large manufacturers and data center operators now view on-site storage as both a cost tool and a resilience asset. This segment will expand as battery system prices continue falling from $117/kWh globally in 2025, making the payback period shorter for mid-size C&I buyers.
Grid Operators and Transmission System Operators procure storage to manage network constraints and replace fast-response fossil assets. As interconnection queues build across the U.S. and Europe — blocking hundreds of gigawatts of new capacity — TSOs face rising pressure to use storage for congestion relief, giving this buyer segment growing budget authority for storage procurement.
Market Segments Covered in the Report
By Battery Type
- Lithium-ion Batteries
- Flow Batteries
- Zinc-hybrid Batteries
- Sodium-based Batteries
By Deployment Network
- Transmission Network
- Distribution Network
- Renewable Energy Generators
By Power Capacity
- Up to 10 MW
- 10–50 MW
- 50–100 MW
- 100–250 MW
- Above 250 MW
By Application
- Renewable Load Sharing
- Peak Shaving
- Load Shifting
- Backup Power
- Others
By End-User
- Utility Companies and IPPs
- Renewable Project Developers
- Commercial and Industrial Consumers
- Grid Operators/Transmission System Operators
Grid-scale Battery Storage Market Regional Insights
Asia-Pacific Dominates the Grid-scale Battery Storage Market with a Market Share of 48.3%, Valued at USD 9.7 Billion
Asia-Pacific leads with 48.3% share, valued at USD 9.7 Billion in 2025. China drives this position through massive domestic production capacity, government-mandated storage co-location rules, and dominant global cell manufacturing scale. Tesla’s first grid-scale Megapack project in China, valued at $556 Million, marks the market’s pull even for Western vendors — confirming Asia-Pacific as both the supply hub and a high-growth demand market.
North America Grid-scale Battery Storage Market Trends
North America is the most active storage procurement market outside Asia-Pacific. The U.S. added a record 15 GW of utility-scale battery storage in 2025, with 24 GW more planned for 2026, per EIA data. However, tariffs above 156% on Chinese batteries and FEOC restrictions on ITC eligibility are forcing developers to reroute supply chains — adding cost and schedule risk to otherwise well-funded projects.
Europe Grid-scale Battery Storage Market Trends
Europe is building structured auction markets to accelerate storage procurement. Italy awarded 10 GWh of grid battery capacity in its first auction in 2025, with clearing prices far below the regulatory cap — a signal of strong supply competition. Fluence’s 1 GW / 4 GWh project in Germany is the region’s largest single battery storage deal and sets a new benchmark for project scale in European grid infrastructure.
Latin America Grid-scale Battery Storage Market Trends
Latin America is in the early build phase of grid-scale storage adoption. Brazil and Chile lead with renewable energy growth and grid stability needs that create a clear demand case for battery storage. However, infrastructure gaps, thin capital markets, and limited local cell manufacturing keep project pipelines smaller and slower than in North America or Asia. International developers are watching for policy signals before committing large capital.
Middle East & Africa Grid-scale Battery Storage Market Trends
Middle East and Africa are adopting storage primarily to support solar energy growth and reduce diesel dependency in remote and off-grid areas. GCC nations are investing in grid modernization as part of broader energy transition goals. South Africa faces severe grid instability, creating urgent demand for storage solutions. Yet financing complexity and limited local technical capacity slow deployment timelines across much of the region.
Key Regions and Countries
North America
- US
- Canada
Europe
- Germany
- France
- The UK
- Spain
- Italy
- Rest of Europe
Asia Pacific
- China
- Japan
- South Korea
- India
- Australia
- Rest of APAC
Latin America
- Brazil
- Mexico
- Rest of Latin America
Middle East & Africa
- GCC
- South Africa
- Rest of MEA
Regulatory Landscape
The U.S. Treasury Department issued final rules under the Inflation Reduction Act’s Section 45X and 48C provisions, setting domestic content and manufacturing requirements for storage systems claiming investment tax credits. Projects using batteries sourced from foreign entities of concern cannot claim the ITC — a ruling that directly shapes vendor selection for U.S. utility procurement teams from 2024 onward.
The European Union’s Battery Regulation, which took effect in phases from 2024, mandates carbon footprint declarations, recycled content thresholds, and end-of-life collection requirements for all batteries sold in EU markets. Suppliers who cannot document their full supply chain will face market access barriers — raising compliance costs but also creating a quality signal that favors established, traceable producers.
China’s National Development and Reform Commission updated its mandatory storage co-location rules in 2024, requiring new solar and wind farms above a certain capacity to install battery storage equal to a set percentage of output. This policy directly supports domestic BESS demand and gives Chinese cell makers a guaranteed home market — a structural advantage that non-Chinese producers cannot easily replicate.
New York State filed its Retail and Residential Energy Storage Implementation Plan in 2025, advancing the state’s 6 GW storage roadmap first set in June 2024. The plan creates structured procurement pathways and revenue stacking rules that reduce investment risk for storage developers — making New York one of the clearest regulatory frameworks for storage monetization in the United States.
Grid-scale Battery Storage Market Dynamics
Drivers
Record U.S. Battery Storage Additions Signal Compressed Procurement Cycles and Narrow Vendor Windows
The U.S. added a record 15 GW of utility-scale battery storage in 2025, with 24 GW planned for 2026, according to the U.S. Energy Information Administration. This is not incremental — it reflects a structural shift where utilities are replacing planned gas peaker capacity with battery systems at a pace few vendors anticipated even two years ago.
For vendors, this pace creates a narrow but high-value window. Manufacturers who can guarantee large-volume delivery within tight timelines will win the bulk of U.S. utility contracts over the next three years. Those who cannot — due to supply chain gaps or insufficient factory output — will lose share to competitors who invested earlier in domestic or allied-nation production.
Moreover, Tesla deployed 31.4 GWh of total energy storage in 2024, a 114% increase from 14.7 GWh in 2023, with Q4 2024 alone recording 11 GWh — a quarterly record. This deployment velocity shows that the market can absorb very large volumes quickly when supply, logistics, and grid interconnection align — setting a benchmark that other integrators will need to approach to remain competitive.
Restraints
Tariff Shocks and Grid Queue Backlogs Are Slowing Project Timelines Across the U.S. and Europe
U.S. trade policy imposed tariffs above 156% on non-EV Chinese batteries in April 2025, while FEOC and domestic content restrictions blocked ITC eligibility for many storage projects. This directly raises project costs and forces developers to find alternative supply chains — a process that takes 12–24 months and adds both cost and schedule uncertainty.
Grid interconnection bottlenecks compound the tariff problem. Hundreds of gigawatts of new capacity sit in queue across the U.S. and Europe, with wait times stretching three to five years in congested regions. A project with procurement locked in and financing closed can still face years of delay before it connects to the grid — reducing returns and discouraging new project starts.
However, these restraints are not uniform. Markets with clear auction frameworks — like Italy’s 10 GWh grid battery auction in 2025 — move faster because the procurement process bypasses individual interconnection negotiations. Developers who focus on markets with structured auction pipelines can reduce timeline risk even as broader grid queue problems persist elsewhere.
Growth Factors
Factory Expansion and DOE Testing Infrastructure Are Unlocking the Next Wave of Cost Reduction
Tesla is building a Houston facility with 50 GWh annual Megablock production capacity, scheduled to start in 2026. At that scale, Tesla’s domestic manufacturing alone would represent roughly twice the total U.S. utility-scale storage installed in 2024. This capacity addition directly increases supply availability for U.S. projects constrained by import tariffs and domestic content rules.
The U.S. Department of Energy’s Pacific Northwest National Laboratory began the first testing of utility-grade grid-scale battery technology at its new Grid Storage Launchpad in December 2025. This federal testing platform accelerates the path from lab chemistry to commercial deployment — reducing the validation timeline that has historically slowed the entry of new chemistries like sodium-based and zinc-hybrid systems into utility procurement.
Additionally, global BESS turnkey prices fell to $117/kWh in 2025, with a 37% drop in Europe driven by Chinese supplier overcapacity. Lower system prices expand the addressable market by pulling in buyers whose projects were not viable at earlier price points — particularly commercial and industrial users and smaller municipal utilities that previously could not justify the capital outlay.
Emerging Trends
Larger Container Formats and Hyperscale Projects Are Resetting What “Grid-Scale” Means
BYD launched the HaoHan system with configurations up to 14.5 MWh per container, directly competing with Tesla’s Megapack format. Larger container sizes reduce installation labor, balance-of-system costs, and land use per MWh — making the economics of large projects more attractive and raising the bar for what buyers expect from a standard storage product offering.
Sungrow’s energy storage segment reached a gross margin of 36.69% in 2024, up 4.07 percentage points year-on-year, making it the company’s highest-margin business line at 32% of total revenue. High and rising margins in storage — even as system prices fall — show that efficiency gains in manufacturing and software are outpacing price pressure, meaning vendors who invest in scale will protect earnings even in a falling-price environment.
Furthermore, solar plus battery now accounts for 81% of new U.S. capacity additions. That figure signals a market shift where standalone solar or wind is no longer the default build — storage is now bundled from the start. Developers who do not integrate storage into their project design from day one are losing bids to those who do, reshaping how both equipment vendors and project financiers structure their offerings.
Grid-scale Battery Storage Market Key Companies Insights
BYD Co. Ltd. operates energy storage systems across 110 countries with over 75 GWh of commercial energy storage in active use and 350 completed projects, per company data. Total 2024 revenue reached CNY 777.1 billion ($107.1 billion USD), up 29% year-on-year. BYD’s global footprint and vertical integration — from cell chemistry through system assembly — give it a cost and delivery speed advantage that few competitors can match at scale.
Fluence Energy reported record revenue of approximately $2.7 billion for fiscal year 2024, a 22% rise from fiscal year 2023, with positive net income of $30.4 million — the first profitable year in company history. As of September 30, 2025, Fluence had deployed 6.8 GW of storage assets, held 9.1 GW of contracted backlog, and managed a global pipeline of 128.8 GW. Its Europe-largest single project — the 1 GW / 4 GWh Jänschwalde BESS with LEAG — anchors its position as the leading independent integrator for utility-scale projects.
LG Chem Ltd. is a core cell supplier to the grid storage market, with its energy storage business benefiting from LFP chemistry adoption across utility projects. LG Chem’s downstream brand, LG Energy Solution, ranks among the top global ESS battery shippers. The parent company’s broad chemical materials expertise gives it raw material sourcing advantages as cell producers race to reduce costs and reduce dependence on single-origin mineral inputs.
Samsung SDI Co. Ltd. targets the premium segment of the grid storage market, focusing on high-cycle-life and high-energy-density cells for demanding utility applications. Samsung SDI ranked among the top 10 global ESS battery shippers in 2024, per EVTank data. Its strong R&D base and existing relationships with European and North American utility buyers position it well to benefit from the shift toward longer-duration and higher-reliability storage requirements in regulated grid markets.
Key Companies
- BYD Co. Ltd.
- ABB Group
- Hitachi Ltd.
- Tesla
- GS Yuasa Corp.
- LG Chem Ltd.
- NGK Insulators Ltd.
- Panasonic Corp.
- Samsung SDI Co. Ltd.
- General Electric
- Fluence Energy
- Mitsubishi Electric Corp.
- Sumitomo Electric Industries, Ltd.
Recent Development
- August 2025 – Tesla retained the top global BESS integrator position in 2024 with 15% market share by MWh shipments, per Wood Mackenzie, though Sungrow narrowed the gap to just 1 percentage point. Tesla also held 39% of the North American BESS integrator market for the third consecutive year.
- March 2025 – CATL reported energy storage cell shipments of 93 GWh in 2024, up 34.32% year-on-year, with energy storage revenue reaching CNY 57.29 billion ($7.96 billion USD). CATL held 36.5% global energy storage market share for the fourth consecutive year.
- February 2025 – CATL led global ESS battery shipments in 2024 with nearly 110 GWh and a 29.5% global ESS market share, per EVTank data. The top 10 global ESS battery companies held concentrated share, with six Chinese firms accounting for nearly 70% combined.
- March 2025 – CATL reported total 2024 revenue declining 9.7% year-on-year to CNY 362.01 billion ($50.4 billion USD), while net profit rose 15.01% to CNY 50.75 billion — showing that margin discipline and cost control more than offset top-line pressure from falling battery cell prices.
- April 2025 – Sungrow reported full year 2024 revenue of CNY 77.857 billion ($10.8 billion USD), up 7.76% year-on-year, with energy storage systems gross margin at 36.69% — the company’s highest-margin segment and 32% of total revenue.
- October 2025 – Italy awarded all 10 GWh of grid battery capacity in its first storage auction, with Enel winning over half. Average clearing prices of roughly €13,000 per MWh per year came in well below the €37,000 regulatory cap, showing deep competitive supply and establishing a replicable auction model for other European markets.
Market Scope
| Report Features | Description |
|---|---|
| Market Value (2025) | USD 20.15 Billion |
| Forecast Revenue (2035) | USD 338.62 Billion |
| CAGR (2026-2035) | 32.6% |
| Base Year for Estimation | 2025 |
| Historic Period | 2020-2024 |
| Forecast Period | 2026-2035 |
| Report Coverage | Revenue Forecast, Market Dynamics, Competitive Landscape, Recent Developments |
| Segments Covered | By Battery Type (Lithium-ion Batteries, Flow Batteries, Zinc-hybrid Batteries, Sodium-based Batteries), By Deployment Network (Transmission Network, Distribution Network, Renewable Energy Generators), By Power Capacity (Up to 10 MW, 10–50 MW, 50–100 MW, 100–250 MW, Above 250 MW), By Application (Renewable Load Sharing, Peak Shaving, Load Shifting, Backup Power, Others), By End-User (Utility Companies and IPPs, Renewable Project Developers, Commercial and Industrial Consumers, Grid Operators/Transmission System Operators) |
| Regional Analysis | North America (US and Canada), Europe (Germany, France, The UK, Spain, Italy, and Rest of Europe), Asia Pacific (China, Japan, South Korea, India, Australia, and Rest of APAC), Latin America (Brazil, Mexico, and Rest of Latin America), Middle East & Africa (GCC, South Africa, and Rest of MEA) |
| Competitive Landscape | BYD Co. Ltd., ABB Group, Hitachi Ltd., GS Yuasa Corp., LG Chem Ltd., NGK Insulators Ltd., Panasonic Corp., Samsung SDI Co. Ltd., General Electric, Fluence Energy, Mitsubishi Electric Corp., Sumitomo Electric Industries, Ltd. |
| Customization Scope | Customization for segments, region/country-level will be provided. Moreover, additional customization can be done based on the requirements. |
| Purchase Options | We have three licenses to opt for: Single User License, Multi-User License (Up to 5 Users), Corporate Use License (Unlimited User and Printable PDF) |
