

What is the Chlor-Alkali Market Size?
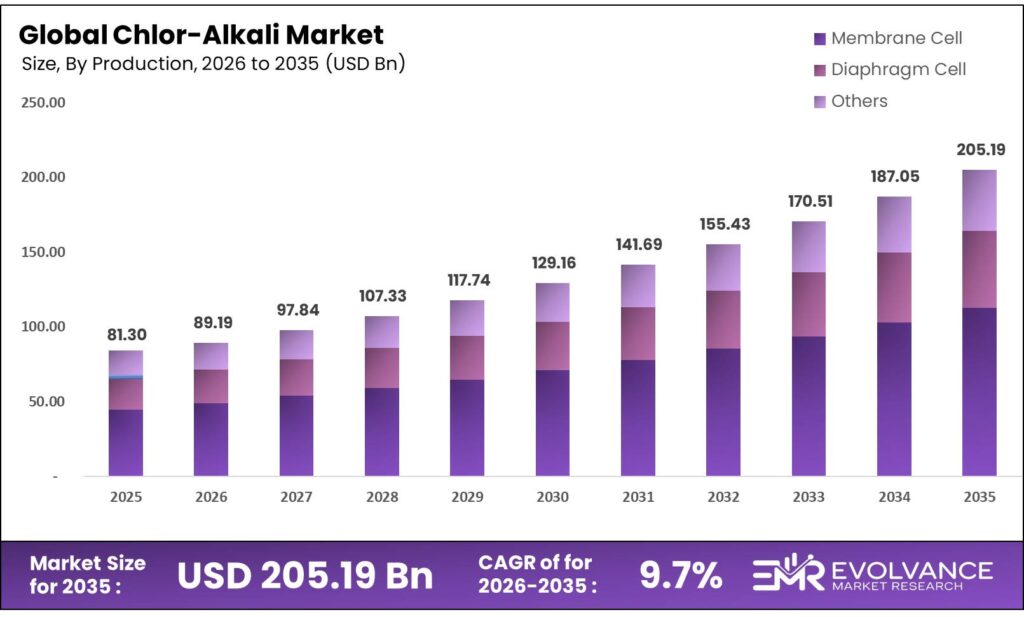
The Global Chlor-Alkali Market size is expected to be worth around USD 205.19 Billion by 2035 from USD 81.30 Billion in 2025, growing at a CAGR of 9.7% during the forecast period 2026 to 2035. This growth stems from rising demand for caustic soda in alumina refining and pulp production. Chlorine consumption in water treatment and PVC making also drives market gains across global industries.
Market Highlights
- The Global Chlor-Alkali Market valued at USD 81.30 Billion in 2025, projected to reach USD 205.19 Billion by 2035, at a CAGR of 9.7% during forecast period 2026-2035
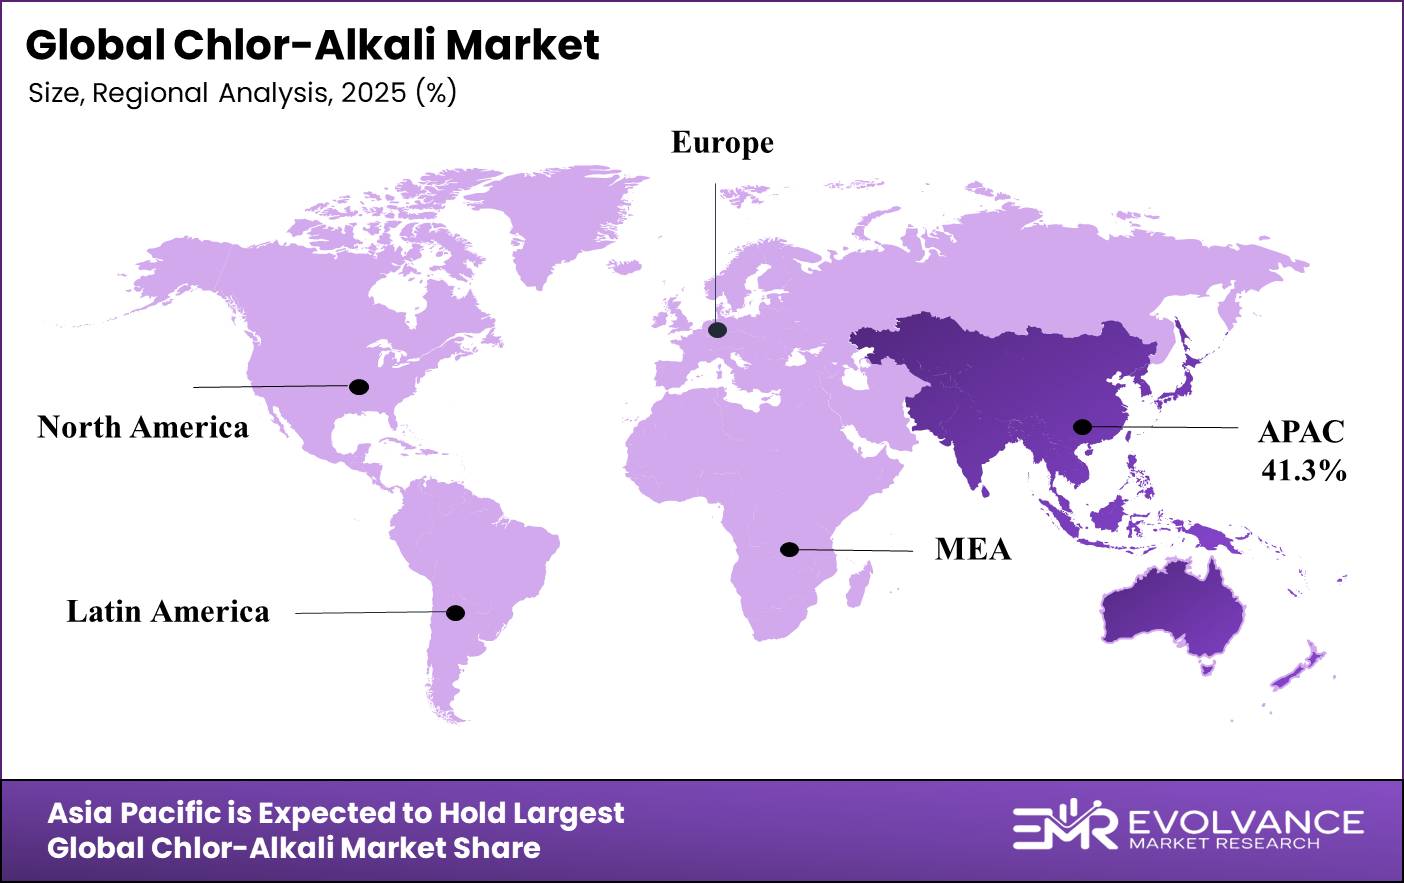
- Asia-Pacific region dominates with 41.3% market share, valued at USD 33.3 Billion
- Caustic Soda segment dominates product category with 47.3% market share
- Membrane Cell technology leads production process segment with 61.2% share
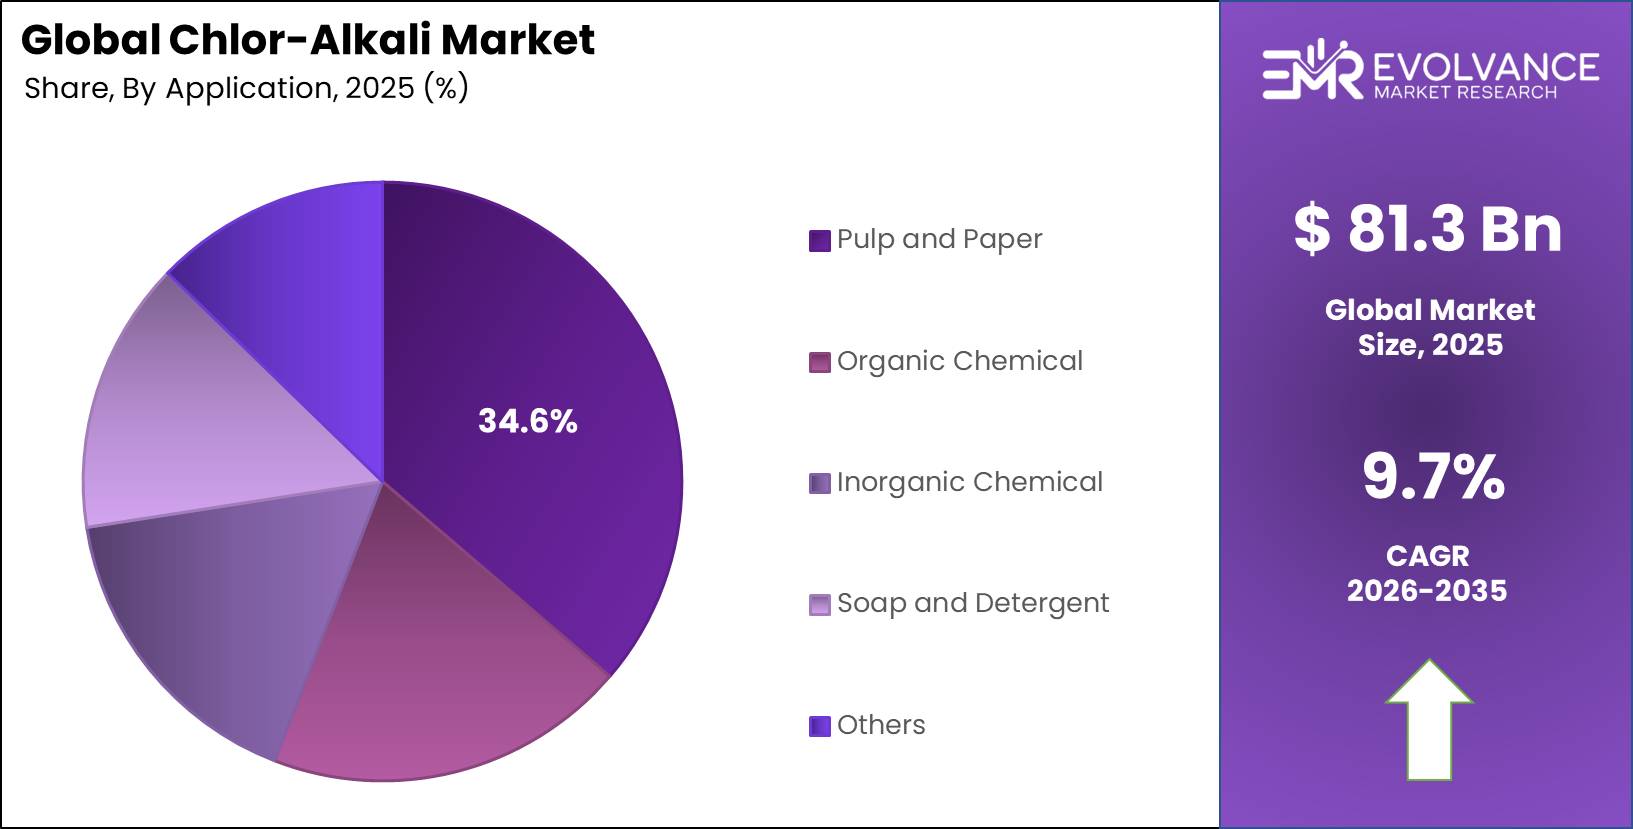
- Pulp and Paper application holds largest share at 34.6% of total market
- Chemical Processing and Manufacturing end user segment accounts for 31.4% market share
Market Overview
Chlor-alkali products form the backbone of modern chemical making and water treatment systems worldwide. These basic chemicals include caustic soda, chlorine, and soda ash made through electrolysis of salt brine. Industries rely on these outputs for pulp making, PVC production, water cleaning, and pharma making across global markets.
The sector serves vital roles in building materials, textiles, and aluminum refining through supply of key raw inputs. Plants use three main cell types for production: membrane, diaphragm, and older mercury systems. Modern units favor membrane cells for better energy use and lower emissions in line with green rules.
About 70% of US chlorine output serves organic chemical making, with nearly 40% going to vinyl chloride for PVC production. Caustic soda splits across 30% organic chemical use and 20% inorganic chemical applications for neutralizing and scrubbing operations. The pulp and paper sector takes another 20% of sodium hydroxide for wood processing and bleaching steps in mills.
Plants cluster near end users since chlorine proves hard to store and ship at low cost. About 72% of US chlorine production occurs in Gulf Coast facilities close to chemical makers and paper mills. This proximity cuts transport costs and ensures reliable supply to high-volume industrial customers in regional manufacturing corridors.
Plants face rising power bills that affect profit margins since electrolysis needs heavy energy input for cell reactions. Makers invest in process upgrades to boost efficiency and meet tighter rules on chlorine handling and plant emissions. Digital tools now help plants track cell performance and predict upkeep needs before system failures occur.
Product Insights
Caustic Soda dominates with 47.3% due to broad industrial applications and essential role in chemical processing.
In 2025, Caustic Soda held a dominant market position in the By Product segment of Chlor-Alkali Market, with a 47.3% share. This leadership stems from wide use in alumina refining, pulp making, and organic chemical production across global industries. Plants rely on caustic soda for neutralizing acids, cleaning systems, and making soaps and detergents in daily operations.
Chlorine serves as vital input for PVC making, water treatment, and organic chemical synthesis in industrial sectors. Municipal water plants use chlorine for disinfection and sanitation to protect public health and safety standards. The pharma sector also consumes chlorine for active ingredient production and facility cleaning in controlled environments.
Soda Ash finds primary use in glass making, detergent production, and water softening across consumer and industrial markets. This product supports flat glass output for building and auto sectors while enabling soap and cleaning product making. Soda ash also helps adjust pH levels in chemical processes and wastewater treatment plant operations nationwide.
Others category includes specialty chlor-alkali outputs and co-products from electrolysis cells used in niche applications. These materials support specific industrial needs in metal processing, textile making, and food production with customized specifications. Minor products also serve regional markets with unique regulatory or technical requirements for chemical composition and purity.
Production Process Insights
Membrane Cell dominates with 61.2% due to superior energy efficiency and lower environmental impact.
In 2025, Membrane Cell held a dominant market position in the By Production Process segment of Chlor-Alkali Market, with a 61.2% share. This technology uses ion-exchange membranes to produce high-purity caustic soda with less power consumption than older methods. Modern plants favor membrane cells for meeting strict emissions rules and cutting operating costs through improved energy efficiency.
Diaphragm Cell technology remains in use at legacy plants where capital costs limit upgrades to newer membrane systems. This method produces lower-purity caustic soda that requires additional processing steps for certain end use applications. Diaphragm cells still serve regional markets with established infrastructure and stable customer bases for standard-grade chemical outputs.
Others category includes legacy mercury cell systems being phased out globally due to environmental and health concerns. Some older plants continue operations under strict regulatory oversight while planning transitions to cleaner technologies. This segment shrinks steadily as nations ban mercury processes and makers invest in modern membrane cell capacity.
Application Insights
Pulp and Paper dominates with 34.6% due to essential role in wood chip processing and bleaching operations.
In 2025, Pulp and Paper held a dominant market position in the By Application segment of Chlor-Alkali Market, with a 34.6% share. Mills use caustic soda for pulping wood chips and chlorine for bleaching paper products to meet quality standards. This sector maintains steady chlor-alkali demand through integrated supply contracts with nearby chemical plants for reliable product delivery.
Organic Chemical production consumes large volumes of chlorine for vinyl chloride, solvents, and petrochemical intermediate making. These outputs feed into PVC plants, refrigerant units, and specialty chemical facilities across industrial value chains. Organic chemical makers often locate near chlor-alkali plants to ensure steady chlorine supply for continuous process operations.
Inorganic Chemical making uses caustic soda for neutralizing acids, scrubbing emissions, and producing alumina and other base materials. This application supports metal refining, pigment making, and industrial gas production with consistent alkali demand patterns. Plants rely on predictable caustic soda quality for maintaining product specs and process control in chemical reactions.
Soap and Detergent production uses caustic soda for saponification and cleaning product formulation in consumer goods making. This sector values high-purity sodium hydroxide for meeting safety rules and product performance standards in retail markets. Detergent plants maintain steady alkali purchases through long-term supply deals with regional chlor-alkali producers for cost control.
End User Insights
Chemical Processing and Manufacturing dominates with 31.4% due to extensive use across organic and inorganic chemical production.
In 2025, Chemical Processing and Manufacturing held a dominant market position in the By End User segment of Chlor-Alkali Market, with a 31.4% share. This sector consumes chlorine for vinyl chloride, solvents, and intermediates while using caustic soda for neutralizing and chemical synthesis. Integrated chemical complexes often include chlor-alkali units to ensure reliable supply of these essential raw materials for downstream operations.
Textiles industry uses caustic soda for mercerizing cotton, scouring fabrics, and dyeing operations in garment and home textile making. Chlorine serves in bleaching and disinfection steps to meet quality and cleanliness standards for finished goods. Textile mills maintain steady alkali demand through seasonal production cycles and export-oriented output targets in global markets.
Water and Wastewater Treatment facilities rely on chlorine for disinfecting drinking water and treating sewage to protect public health. Caustic soda helps adjust pH levels and neutralize acids in treatment processes at municipal and industrial plants. This sector shows stable demand growth tied to population expansion and stricter water quality rules in developing regions.
Aluminum and Metal Processing uses caustic soda for alumina refining from bauxite ore in primary metal production operations. This application consumes large alkali volumes at smelters and refineries located near chlor-alkali plants for cost efficiency. Metal processors also use chlorine for titanium production and surface treatment in specialty alloy making operations.
Glass Manufacturing uses soda ash as flux in melting silica sand and limestone to make flat glass and containers. Caustic soda serves in glass cleaning and etching processes for specialty products and quality control steps. Glass plants maintain steady purchases tied to building construction cycles and auto industry demand for windshields and windows.
Market Segments Covered in the Report
By Product
- Caustic Soda
- Chlorine
- Soda Ash
- Others
By Production Process
- Membrane Cell
- Diaphragm Cell
- Others
By Application
- Pulp and Paper
- Organic Chemical
- Inorganic Chemical
- Soap and Detergent
- Others
By End User
- Chemical Processing and Manufacturing
- Textiles
- Water and Wastewater Treatment
- Aluminum and Metal Processing
- Glass Manufacturing
- Pharmaceuticals
- Food Processing
Chlor-Alkali Market Regional Insights
Asia-Pacific Dominates the Chlor-Alkali Market with a Market Share of 41.3%, Valued at USD 33.3 Billion
Asia-Pacific leads global chlor-alkali output with 41.3% market share worth USD 33.3 Billion through massive chemical complexes and growing industrial demand. China, India, Japan, and South Korea host large production sites serving regional pulp mills, chemical plants, and water treatment facilities. Fast urban growth and building booms drive strong PVC and caustic soda consumption across emerging Asian economies and mature markets.
North America Market Trends
North America maintains significant chlor-alkali capacity concentrated along the Gulf Coast near chemical clusters and pulp mills. The US and Canada operate advanced membrane cell plants with integrated downstream units for vinyl chloride and other derivatives. Makers focus on energy efficiency gains and capacity debottlenecking to serve stable regional demand from established industrial customers.
Europe Market Trends
Europe pursues strict environmental rules driving conversion from legacy mercury and diaphragm cells to clean membrane technology. Germany, France, and the UK host major chemical hubs consuming chlor-alkali outputs for specialty chemicals and export products. Regional makers invest in carbon footprint cuts and renewable power sourcing to meet climate targets and green chemistry standards.
Latin America Market Trends
Latin America shows steady chlor-alkali demand growth tied to infrastructure projects and expanding industrial sectors in Brazil and Mexico. Regional plants serve pulp exports, aluminum smelters, and domestic chemical making with reliable product supply and competitive pricing. Makers explore capacity additions to capture growing consumption from water treatment upgrades and building material production nationwide.
Middle East & Africa Market Trends
Middle East and Africa develop new chlor-alkali capacity leveraging low-cost power and salt resources for petrochemical integration. GCC nations invest in large-scale plants linked to PVC chains and export-oriented chemical complexes in industrial zones. South Africa maintains regional output serving mining, water treatment, and chemical sectors with stable demand from established industries.
Key Regions and Countries
North America
- US
- Canada
Europe
- Germany
- France
- The UK
- Spain
- Italy
- Rest of Europe
Asia Pacific
- China
- Japan
- South Korea
- India
- Australia
- Rest of APAC
Latin America
- Brazil
- Mexico
- Rest of Latin America
Middle East & Africa
- GCC
- South Africa
- Rest of MEA
Regulatory Landscape
Global chlor-alkali rules tighten emissions limits and phase out mercury cell technology to protect worker health and the environment. The United Nations Minamata Convention on Mercury drives plant closures and conversions to membrane cells across signatory nations by 2025. This treaty affects legacy facilities worldwide and requires capital investment in cleaner production systems for regulatory compliance.
European Union regulations set strict standards for chlorine handling, storage, and transport under REACH and Seveso directives issued in 2024. These rules mandate safety upgrades, emergency response plans, and emissions monitoring at chemical plants to prevent accidents. US EPA also enforces Clean Air Act requirements on chlorine plants with periodic rule updates affecting operating permits nationwide.
Water quality rules in developing nations drive chlorine demand for municipal disinfection systems meeting WHO drinking water standards. Governments invest in treatment infrastructure and mandate chlorine use for public health protection in urban supply networks. These regulatory drivers support steady chlor-alkali consumption growth tied to sanitation improvements and population expansion in emerging economies.
Demand Drivers
| Driver | (~) % Impact on CAGR Forecast | Geographic Relevance | Impact Timeline |
|---|---|---|---|
| Chlorine demand from PVC and vinyl chloride monomer | +1.3% | Asia Pacific, Global | Short term (2 years or less) |
| Caustic soda demand from alumina, detergents, and chemicals | +1.1% | Asia Pacific, North America | Short term (2 years or less) |
| Urbanization, infrastructure, and construction growth | +0.9% | Asia Pacific, Middle East | Medium term (2 to 4 years) |
| Water and wastewater treatment disinfection demand | +0.7% | Global, Emerging Markets | Medium term (2 to 4 years) |
| Pulp, paper, textile, and pharmaceutical end use | +0.5% | Asia Pacific, Global | Medium term (2 to 4 years) |
Chlorine Demand From PVC And Vinyl Chloride Monomer
The key driver is strong chlorine demand from VCM and PVC applications in pipes and construction, with chlorine holding 37.5% of the market in 2025. Asia Pacific leads, while the fixed 1.10:1.00 chlorine-to-caustic soda co-production ratio benefits integrated producers, which account for roughly 45% of the market.
Market Barriers
| Restraint | (~) % Impact on CAGR Forecast | Geographic Relevance | Impact Timeline |
|---|---|---|---|
| High electricity cost and energy price volatility | -1.5% | Europe, Global | Short term (2 years or less) |
| Co product imbalance depressing caustic or chlorine prices | -1.0% | Global | Short term (2 years or less) |
| Environmental regulation on chlorine and brine handling | -0.7% | Europe, North America | Medium term (2 to 4 years) |
| Salt feedstock and logistics cost fluctuation | -0.5% | Global | Short term (2 years or less) |
| Import competition pressuring regional producers | -0.3% | Europe, Emerging Markets | Medium term (2 to 4 years) |
High Electricity Cost And Energy Price Volatility
The key restraint is chlor-alkali’s heavy electricity dependence, with power accounting for 50%+ of cash production costs. High and volatile electricity prices, particularly in Europe, pressure margins, increase curtailment and idling risks, and shift competitiveness toward regions with cheaper or renewable power, making energy costs a major near-term constraint.
Chlor-alkali plants consume heavy electricity for electrolysis cells making them vulnerable to power price swings affecting profit margins. Energy typically represents 30 to 40% of total production costs creating exposure to utility rate changes and fuel price volatility. Plants in regions with high power costs face competitive disadvantages compared to facilities accessing cheap hydroelectric or natural gas generation.
Operational Challenges
| Challenge | (~) % CAGR Friction Drag | Geographic Relevance | Mitigation Horizon |
|---|---|---|---|
| Decarbonizing energy intensive electrolysis | -1.3% | Europe, North America, Global | Long term (4 years or more) |
| Legacy diaphragm and mercury cell technology transition | -0.8% | North America, Emerging Markets | Long term (4 years or more) |
| Chlorine storage, transport, and safety management | -0.6% | Global | Medium term (2 to 4 years) |
| Matching co product demand to fixed output ratio | -0.5% | Global | Medium term (2 to 4 years) |
| Specialized process engineering talent gap | -0.3% | Global | Long term (4 years or more) |
Decarbonizing Energy Intensive Electrolysis
The key challenge is chlor-alkali’s high electricity intensity, which increases emissions exposure under tightening climate policies such as the EU ETS and CBAM. European membrane-cell capacity rose from 11% to 59% by 2020, while nearly 56% of companies plan renewable-powered electrolysis and AI optimization, requiring significant long-term investment to decarbonize operations.
Integrated chlor-alkali and downstream chemical complexes capture value from both chlorine and caustic soda outputs in balanced operations. Plants producing PVC, epoxy resins, propylene glycole and propylene oxide consume chlorine onsite eliminating transport costs and supply risks. This vertical integration model supports new project development in regions with growing chemical demand and favorable investment climates.
Market Potential
| Opportunity | (~) % Potential CAGR Upside | Geographic Relevance | Execution Window |
|---|---|---|---|
| Green chlor alkali with renewable powered electrolysis whitespace | +1.3% | Europe, North America, Middle East | Long term (4 years or more) |
| Hydrogen co product valorization as clean energy carrier | +1.0% | Europe, Asia Pacific | Long term (4 years or more) |
| Water treatment demand growth in emerging economies | +0.8% | India, Africa, Southeast Asia | Medium term (2 to 4 years) |
| AI driven process optimization and circular manufacturing | +0.6% | Global | Medium term (2 to 4 years) |
| M&A and integrated consolidation of producers | +0.4% | Global | Medium term (2 to 4 years) |
Green Chlor Alkali With Renewable Powered Electrolysis Whitespace
Green chlor-alkali represents future white-space potential as renewable-powered brine electrolysis enables low-carbon caustic soda and chlorine while hedging electricity costs. With nearly 56% of companies planning renewable-powered electrolysis, producers could achieve estimated margin expansion of 300–600 basis points through renewable power sourcing, membrane-cell upgrades, and grid integration.
Key Companies Insights
Tata Chemicals Limited operates integrated soda ash and salt businesses in India with growing chlor-alkali capacity serving domestic chemical and paper sectors. The company leverages its broad product portfolio and distribution network to capture market share in emerging Asian economies. Recent investments in membrane cell technology and sustainability programs position Tata for long-term growth in environmentally conscious markets.
Occidental Petroleum Corporation runs major chlor-alkali and vinyls operations through its OxyChem division serving North American chemical and building material makers. The company maintains cost leadership through vertical integration and access to low-cost feedstocks from its energy business units. Strategic capacity additions and reliability improvements support stable market share in commodity chemical segments with cyclical demand patterns.
Formosa Plastics Corporation operates large-scale chlor-alkali plants integrated with PVC and specialty chemical production in Taiwan and international locations. The company’s global footprint and diversified product mix provide resilience against regional market volatility and trade disruptions. Formosa invests in advanced manufacturing technology and environmental compliance to meet evolving regulatory standards across its operating regions.
Hanwha Solutions Corporation combines chlor-alkali capacity with solar energy and chemical businesses creating synergies in sustainable manufacturing operations. The company focuses on energy-efficient production methods and renewable power integration to cut carbon footprint and operating costs. Strategic partnerships and technology licensing support Hanwha’s expansion in Asian markets with growing industrial chemical demand and green chemistry adoption.
Key Companies
- Tata Chemicals Limited
- Occidental Petroleum Corporation
- Formosa Plastics Corporation
- Hanwha Solutions Corporation
- AGC, Inc.
- INOVYN
- Wanhua-Borsodchem
- Dow Inc.
- Solvay SA
- Tosoh Corporation
- Olin Corporation
- Westlake Chemical Corporation
- Xinjiang Zhongtai Chemical Co. Ltd.
Recent Development
- January 2025 – Olin Corporation completed membrane cell technology upgrade at its Louisiana plant boosting caustic soda capacity by 15% with improved energy efficiency. This expansion supports growing Gulf Coast chemical demand and reduces the facility’s carbon footprint through advanced electrolysis systems.
- November 2025 – Dow Inc. announced plans to build a new 500,000 ton per year chlor-alkali plant in Texas integrated with downstream PVC production. The project will use state-of-the-art membrane cells and renewable power to meet sustainability targets while serving regional construction markets.
- September 2025 – Solvay SA invested €120 Million in upgrading European chlor-alkali facilities to phase out legacy diaphragm cells by 2026. These conversions align with EU environmental regulations and improve product purity for pharmaceutical and food-grade applications across the region.
- July 2025 – Westlake Chemical Corporation completed acquisition of a 300,000 ton chlor-alkali plant in the Southeast US expanding regional market presence. The deal strengthens Westlake’s vertically integrated vinyls business and provides raw material security for PVC operations during tight supply conditions.
- May 2025 – Tosoh Corporation launched digital monitoring platform across its Japanese chlor-alkali plants cutting energy costs by 8% through optimized operations. The smart manufacturing system uses AI to predict cell performance and schedule maintenance reducing downtime in high-utilization facilities.
- March 2025 – INOVYN signed long-term power purchase agreement for 200 MW of renewable electricity to supply Belgian chlor-alkali operations. This deal supports the company’s carbon neutrality goals and provides stable energy costs for electrolysis-intensive production processes through 2030.
Market Scope
| Report Features | Description |
|---|---|
| Market Value (2025) | USD 81.30 Billion |
| Forecast Revenue (2035) | USD 205.19 Billion |
| CAGR (2026-2035) | 9.7% |
| Base Year for Estimation | 2025 |
| Historic Period | 2020-2024 |
| Forecast Period | 2026-2035 |
| Report Coverage | Revenue Forecast, Market Dynamics, Competitive Landscape, Recent Developments |
| Segments Covered | By Product (Caustic Soda, Chlorine, Soda Ash, Others), By Production Process (Membrane Cell, Diaphragm Cell, Others), By Application (Pulp and Paper, Organic Chemical, Inorganic Chemical, Soap and Detergent, Others), By End User (Chemical Processing and Manufacturing, Textiles, Water and Wastewater Treatment, Aluminum and Metal Processing, Glass Manufacturing, Pharmaceuticals, Food Processing) |
| Regional Analysis | North America (US and Canada), Europe (Germany, France, The UK, Spain, Italy, and Rest of Europe), Asia Pacific (China, Japan, South Korea, India, Australia, and Rest of APAC), Latin America (Brazil, Mexico, and Rest of Latin America), Middle East & Africa (GCC, South Africa, and Rest of MEA) |
| Competitive Landscape | Tata Chemicals Limited, Occidental Petroleum Corporation, Formosa Plastics Corporation, Hanwha Solutions Corporation, AGC, Inc., INOVYN, Wanhua-Borsodchem, Dow Inc., Solvay SA, Tosoh Corporation, Olin Corporation, Westlake Chemical Corporation, Xinjiang Zhongtai Chemical Co. Ltd. |
| Customization Scope | Customization for segments, region/country-level will be provided. Moreover, additional customization can be done based on the requirements. |
| Purchase Options | We have three licenses to opt for: Single User License, Multi-User License (Up to 5 Users), Corporate Use License (Unlimited User and Printable PDF) |